Statistiques de base
| Valeur du portefeuille | $ 5 227 493 603 |
| Positions actuelles | 93 |
Dernières positions, performances, ASG (à partir des dépôts 13F, 13D)
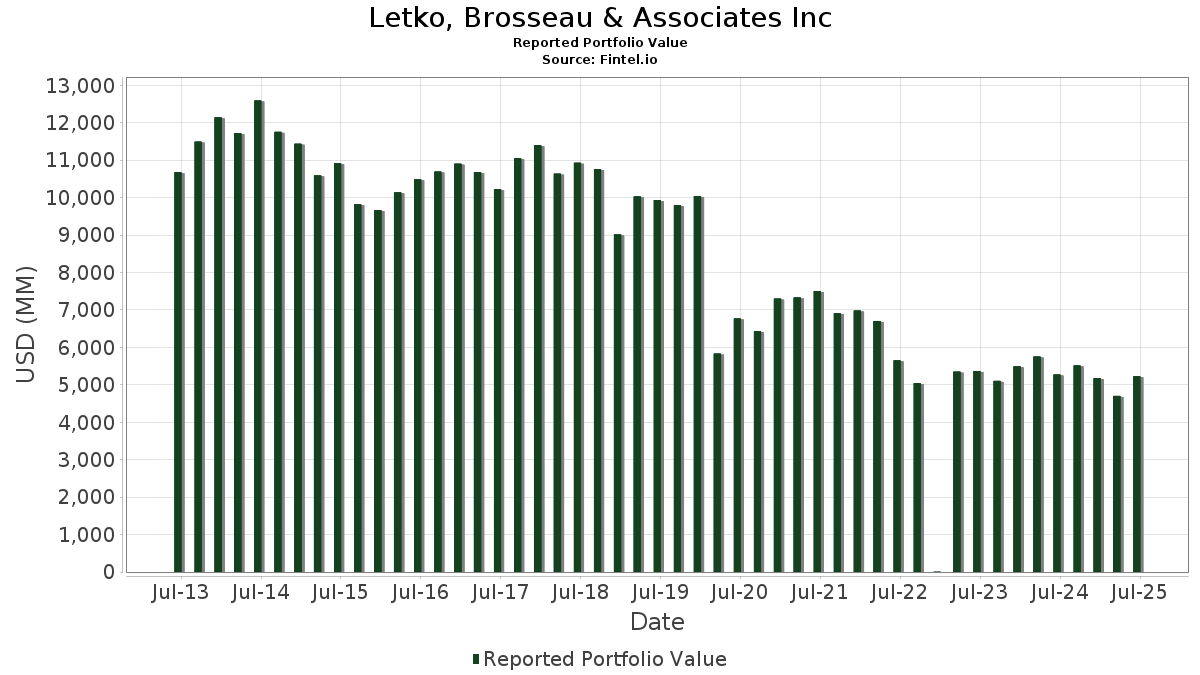
Letko, Brosseau & Associates Inc a déclaré un total de 93 positions dans ses derniers dépôts auprès de la SEC. La valeur la plus récente du portefeuille est calculée à 5 227 493 603 USD. Les actifs sous gestion réels (ASG) sont cette valeur plus les liquidités (qui ne sont pas divulguées). Les principales positions de Letko, Brosseau & Associates Inc sont The Toronto-Dominion Bank (US:TD) , The Bank of Nova Scotia (US:BNS) , Royal Bank of Canada (US:RY) , MicroSectors Gold Miners -3X Inverse Leveraged ETNs due June 29, 2040 (US:GDXD) , and Rogers Communications Inc. (US:RCI) . Les nouvelles positions de Letko, Brosseau & Associates Inc incluent Barrick Mining Corporation (US:B) , Amrize AG (GB:AMRZZ) , Emera Incorporated (US:EMRAF) , NewAmsterdam Pharma Company N.V. (US:NAMS) , and . Les principales industries de Letko, Brosseau & Associates Inc sont "Paper And Allied Products" (sic 26) , "Security And Commodity Brokers, Dealers, Exchanges, And Services" (sic 62) , and "Transportation By Air" (sic 45) .
Meilleures augmentations ce trimestre
Nous utilisons la variation de l'allocation du portefeuille car il s'agit de l'indicateur le plus significatif. Les changements peuvent être dus à des transactions ou à des variations de prix des actions.
| Titre | Actions (en millions) |
Valeur ($ en millions) |
% du portefeuille | ΔPortefeuille % |
|---|---|---|---|---|
| 5,02 | 104,22 | 1,9936 | 1,9936 | |
| 1,48 | 28,84 | 0,5517 | 0,5517 | |
| 5,65 | 164,75 | 3,1517 | 0,5431 | |
| 6,75 | 199,92 | 3,8244 | 0,4827 | |
| 0,87 | 153,78 | 2,9418 | 0,4156 | |
| 0,21 | 155,18 | 2,9686 | 0,3734 | |
| 3,18 | 233,77 | 4,4719 | 0,3163 | |
| 1,95 | 138,39 | 2,6474 | 0,2812 | |
| 8,06 | 85,38 | 1,6334 | 0,2803 | |
| 0,27 | 13,63 | 0,2608 | 0,2608 |
Principales baisses ce trimestre
Nous utilisons la variation de l'allocation du portefeuille car il s'agit de l'indicateur le plus significatif. Les changements peuvent être dus à des transactions ou à des variations de prix des actions.
| Titre | Actions (en millions) |
Valeur ($ en millions) |
% du portefeuille | ΔPortefeuille % |
|---|---|---|---|---|
| 0,01 | 0,42 | 0,0081 | -0,7825 | |
| 6,25 | 199,57 | 3,8176 | -0,3396 | |
| 0,85 | 63,51 | 1,2148 | -0,3395 | |
| 0,30 | 55,13 | 1,0545 | -0,2805 | |
| 4,17 | 120,71 | 2,3092 | -0,2318 | |
| 2,09 | 77,95 | 1,4912 | -0,2278 | |
| 1,65 | 71,42 | 1,3663 | -0,2264 | |
| 3,99 | 96,62 | 1,8483 | -0,2251 | |
| 1,12 | 81,88 | 1,5664 | -0,2183 | |
| 0,43 | 38,20 | 0,7308 | -0,2057 |
Déclarations 13D/G
Il s'agit d'une liste des déclarations 13D et 13G déposées au cours de la dernière année (le cas échéant). Cliquez sur l'icône du lien pour voir l'historique complet des transactions. Les lignes vertes indiquent de nouvelles positions. Les lignes rouges indiquent des positions fermées.
| Date de dépôt | Formulaire | Titre | Actions précédentes |
Actions actuelles |
ΔActions % | % de participation |
% ΔParticipation | |
|---|---|---|---|---|---|---|---|---|
| 2025-04-09 | EFXT / Enerflex Ltd. | 5 049 686 | ||||||
| 2024-10-11 | PROF / Profound Medical Corp. | 1 177 850 | 0 | -100,00 | 4,90 | -10,91 |
Déclarations 13F et dépôts de fonds
Ce formulaire a été déposé le 2025-08-08 pour la période de déclaration 2025-06-30. Cliquez sur l'icône du lien pour voir l'historique complet des transactions.
Mettre à niveau pour débloquer les données premium et exporter vers Excel ![]() .
.
| Titre | Type | Prix moyen de l'action | Actions (en millions) |
ΔActions (%) |
ΔActions (%) |
Valeur ($ en millions) |
Portefeuille (%) |
ΔPortefeuille (%) |
|
|---|---|---|---|---|---|---|---|---|---|
| TD / The Toronto-Dominion Bank | 3,18 | -2,36 | 233,77 | 19,63 | 4,4719 | 0,3163 | |||
| BNS / The Bank of Nova Scotia | 4,05 | 1,01 | 223,62 | 17,59 | 4,2777 | 0,2335 | |||
| RY / Royal Bank of Canada | 1,53 | -1,14 | 201,05 | 15,45 | 3,8459 | 0,1426 | |||
| GDXD / MicroSectors Gold Miners -3X Inverse Leveraged ETNs due June 29, 2040 | 1,81 | -0,95 | 200,10 | 14,74 | 3,8279 | 0,1191 | |||
| RCI / Rogers Communications Inc. | 6,75 | 14,76 | 199,92 | 27,22 | 3,8244 | 0,4827 | |||
| MFC / Manulife Financial Corporation | 6,25 | -0,33 | 199,57 | 2,09 | 3,8176 | -0,3396 | |||
| SLF / Sun Life Financial Inc. | 2,75 | -0,76 | 182,53 | 15,16 | 3,4918 | 0,1210 | |||
| NTR / Nutrien Ltd. | 2,94 | -1,96 | 171,13 | 14,90 | 3,2737 | 0,1063 | |||
| OTEX / Open Text Corporation | 5,65 | 16,23 | 164,75 | 34,31 | 3,1517 | 0,5431 | |||
| MGA / Magna International Inc. | 4,05 | 2,33 | 156,30 | 16,17 | 2,9899 | 0,1287 | |||
| META / Meta Platforms, Inc. | 0,21 | -0,70 | 155,18 | 27,16 | 2,9686 | 0,3734 | |||
| GOOG / Alphabet Inc. | 0,87 | 14,01 | 153,78 | 29,45 | 2,9418 | 0,4156 | |||
| CM / Canadian Imperial Bank of Commerce | 1,95 | -1,25 | 138,39 | 24,38 | 2,6474 | 0,2812 | |||
| BCE / BCE Inc. | 5,65 | 8,57 | 125,00 | 4,70 | 2,3913 | -0,1476 | |||
| T / AT&T Inc. | 4,17 | -1,28 | 120,71 | 1,03 | 2,3092 | -0,2318 | |||
| TU / TELUS Corporation | 6,60 | 2,15 | 105,71 | 14,17 | 2,0222 | 0,0532 | |||
| B / Barrick Mining Corporation | 5,02 | 104,22 | 1,9936 | 1,9936 | |||||
| CAE / CAE Inc. | 3,32 | -1,81 | 97,22 | 16,84 | 1,8597 | 0,0902 | |||
| PFE / Pfizer Inc. | 3,99 | 3,59 | 96,62 | -0,90 | 1,8483 | -0,2251 | |||
| HBM / Hudbay Minerals Inc. | 8,06 | -3,94 | 85,38 | 34,20 | 1,6334 | 0,2803 | |||
| C / Citigroup Inc. | 0,97 | -3,35 | 82,95 | 15,88 | 1,5868 | 0,0646 | |||
| CVE / Cenovus Energy Inc. | 6,06 | 6,02 | 82,26 | 3,61 | 1,5736 | -0,1147 | |||
| WFG / West Fraser Timber Co. Ltd. | 1,12 | 2,38 | 81,88 | -2,43 | 1,5664 | -0,2183 | |||
| ILMN / Illumina, Inc. | 0,85 | 1,12 | 81,44 | 21,60 | 1,5579 | 0,1337 | |||
| SU / Suncor Energy Inc. | 2,09 | -0,13 | 77,95 | -3,56 | 1,4912 | -0,2278 | |||
| CVS / CVS Health Corporation | 1,11 | -0,01 | 76,71 | 1,81 | 1,4675 | -0,1349 | |||
| STT / State Street Corporation | 0,69 | -0,06 | 73,49 | 18,71 | 1,4058 | 0,0893 | |||
| TFC / Truist Financial Corporation | 1,67 | 1,54 | 71,90 | 6,08 | 1,3754 | -0,0660 | |||
| VZ / Verizon Communications Inc. | 1,65 | -0,03 | 71,42 | -4,64 | 1,3663 | -0,2264 | |||
| INTC / Intel Corporation | 2,98 | 2,66 | 66,79 | 1,26 | 1,2776 | -0,1250 | |||
| CMCSA / Comcast Corporation | 1,83 | 0,62 | 65,23 | -2,68 | 1,2478 | -0,1776 | |||
| ADBE / Adobe Inc. | 0,17 | 4,44 | 64,71 | 5,36 | 1,2378 | -0,0683 | |||
| GSK / GSK plc - Depositary Receipt (Common Stock) | 1,66 | 2,58 | 63,79 | 1,68 | 1,2203 | -0,1138 | |||
| EMN / Eastman Chemical Company | 0,85 | 2,54 | 63,51 | -13,11 | 1,2148 | -0,3395 | |||
| ELP / Companhia Paranaense de Energia - COPEL - Depositary Receipt (Common Stock) | 6,70 | -0,15 | 61,21 | 24,71 | 1,1710 | 0,1271 | |||
| GILD / Gilead Sciences, Inc. | 0,53 | -2,76 | 59,15 | -3,79 | 1,1315 | -0,1759 | |||
| TECK / Teck Resources Limited | 1,45 | -0,79 | 58,52 | 9,93 | 1,1196 | -0,0126 | |||
| SWKS / Skyworks Solutions, Inc. | 0,77 | 5,27 | 57,35 | 21,38 | 1,0971 | 0,0923 | |||
| WFC / Wells Fargo & Company | 0,69 | -3,68 | 55,62 | 7,50 | 1,0639 | -0,0363 | |||
| ABBV / AbbVie Inc. | 0,30 | -0,89 | 55,13 | -12,19 | 1,0545 | -0,2805 | |||
| SBS / Companhia de Saneamento Básico do Estado de São Paulo - SABESP - Depositary Receipt (Common Stock) | 2,25 | -4,20 | 49,51 | 17,85 | 0,9471 | 0,0537 | |||
| FDX / FedEx Corporation | 0,21 | 7,01 | 47,50 | -0,22 | 0,9087 | -0,1037 | |||
| CRUS / Cirrus Logic, Inc. | 0,45 | 0,24 | 46,82 | 4,87 | 0,8956 | -0,0538 | |||
| BAC / Bank of America Corporation | 0,99 | -0,12 | 46,72 | 13,26 | 0,8937 | 0,0166 | |||
| SHEL / Shell plc - Depositary Receipt (Common Stock) | 0,64 | -1,67 | 44,77 | -5,52 | 0,8564 | -0,1513 | |||
| EFXT / Enerflex Ltd. | 5,06 | 0,12 | 39,83 | 2,09 | 0,7620 | -0,0677 | |||
| WMT / Walmart Inc. | 0,41 | -6,27 | 39,71 | 4,39 | 0,7596 | -0,0493 | |||
| COP / ConocoPhillips | 0,43 | 1,52 | 38,20 | -13,25 | 0,7308 | -0,2057 | |||
| GPK / Graphic Packaging Holding Company | 1,55 | 37,63 | 32,72 | 11,70 | 0,6259 | 0,0030 | |||
| QSR / Restaurant Brands International Inc. | 0,47 | 4,65 | 31,31 | 3,94 | 0,5989 | -0,0416 | |||
| ADNT / Adient plc | 1,48 | 28,84 | 0,5517 | 0,5517 | |||||
| MRK / Merck & Co., Inc. | 0,35 | 44,16 | 27,49 | 27,14 | 0,5259 | 0,0660 | |||
| MAC / The Macerich Company | 1,67 | 0,72 | 27,03 | -5,09 | 0,5170 | -0,0885 | |||
| CX / CEMEX, S.A.B. de C.V. - Depositary Receipt (Common Stock) | 3,73 | 0,43 | 25,85 | 24,06 | 0,4945 | 0,0514 | |||
| MRNA / Moderna, Inc. | 0,92 | 2,43 | 25,33 | -0,32 | 0,4846 | -0,0558 | |||
| IVZ / Invesco Ltd. | 1,60 | 0,60 | 25,27 | 4,58 | 0,4834 | -0,0304 | |||
| BAP / Credicorp Ltd. | 0,10 | 0,52 | 21,67 | 20,69 | 0,4145 | 0,0327 | |||
| CPA / Copa Holdings, S.A. | 0,19 | 0,71 | 20,54 | 19,79 | 0,3930 | 0,0283 | |||
| HES / Hess Corporation | 0,13 | -0,95 | 18,21 | -14,09 | 0,3483 | -0,1024 | |||
| LULU / lululemon athletica inc. | 0,07 | 3,66 | 15,75 | -13,00 | 0,3012 | -0,0837 | |||
| IBN / ICICI Bank Limited - Depositary Receipt (Common Stock) | 0,47 | -2,25 | 15,71 | 4,33 | 0,3006 | -0,0197 | |||
| CXM / Sprinklr, Inc. | 1,76 | 0,66 | 14,89 | 1,99 | 0,2849 | -0,0256 | |||
| BIIB / Biogen Inc. | 0,12 | 1,77 | 14,78 | -6,60 | 0,2827 | -0,0538 | |||
| AMRZZ / Amrize AG | 0,27 | 13,63 | 0,2608 | 0,2608 | |||||
| PROF / Profound Medical Corp. | 1,20 | -0,30 | 7,15 | 20,79 | 0,1367 | 0,0109 | |||
| HDB / HDFC Bank Limited - Depositary Receipt (Common Stock) | 0,06 | 2,88 | 4,52 | 18,69 | 0,0865 | 0,0055 | |||
| SW / Smurfit Westrock Plc | 0,09 | 10,51 | 3,90 | 5,80 | 0,0747 | -0,0038 | |||
| XBI / SPDR Series Trust - SPDR S&P Biotech ETF | 0,04 | -4,19 | 3,18 | -2,03 | 0,0608 | -0,0082 | |||
| SCHW / The Charles Schwab Corporation | 0,02 | -9,61 | 1,80 | 5,32 | 0,0345 | -0,0019 | |||
| ING / ING Groep N.V. - Depositary Receipt (Common Stock) | 0,05 | 0,00 | 1,08 | 11,67 | 0,0207 | 0,0001 | |||
| FLIN / Franklin Templeton ETF Trust - Franklin FTSE India ETF | 0,02 | 30,28 | 0,84 | 40,81 | 0,0160 | 0,0034 | |||
| ORCL / Oracle Corporation | 0,00 | 0,68 | 0,0129 | 0,0129 | |||||
| UPS / United Parcel Service, Inc. | 0,01 | 0,62 | 0,0119 | 0,0119 | |||||
| ELP / Companhia Paranaense de Energia - COPEL - Depositary Receipt (Common Stock) | 0,07 | -2,64 | 0,58 | 27,19 | 0,0111 | 0,0014 | |||
| PBA / Pembina Pipeline Corporation | 0,01 | 3,21 | 0,48 | -3,21 | 0,0092 | -0,0014 | |||
| SPRY / ARS Pharmaceuticals, Inc. | 0,02 | 0,00 | 0,43 | 39,03 | 0,0082 | 0,0016 | |||
| SKX / Skechers U.S.A., Inc. | 0,01 | -98,97 | 0,42 | -98,86 | 0,0081 | -0,7825 | |||
| FTS / Fortis Inc. | 0,01 | 0,00 | 0,41 | 4,65 | 0,0077 | -0,0005 | |||
| EMRAF / Emera Incorporated | 0,01 | 0,39 | 0,0074 | 0,0074 | |||||
| NXPI / NXP Semiconductors N.V. | 0,00 | 0,39 | 0,0074 | 0,0074 | |||||
| VALE / Vale S.A. - Depositary Receipt (Common Stock) | 0,04 | 0,00 | 0,36 | -2,74 | 0,0068 | -0,0010 | |||
| MSFT / Microsoft Corporation | 0,00 | 0,00 | 0,32 | 32,64 | 0,0061 | 0,0010 | |||
| FCX / Freeport-McMoRan Inc. | 0,01 | 0,30 | 0,0057 | 0,0057 | |||||
| MGTX / MeiraGTx Holdings plc | 0,05 | 0,00 | 0,30 | -3,91 | 0,0057 | -0,0009 | |||
| ERO / Ero Copper Corp. | 0,01 | 0,00 | 0,24 | 39,43 | 0,0047 | 0,0009 | |||
| MLYS / Mineralys Therapeutics, Inc. | 0,02 | 0,00 | 0,22 | -14,89 | 0,0043 | -0,0013 | |||
| NAMS / NewAmsterdam Pharma Company N.V. | 0,01 | 0,21 | 0,0041 | 0,0041 | |||||
| TCRX / TScan Therapeutics, Inc. | 0,10 | 24,35 | 0,14 | 31,13 | 0,0027 | 0,0004 | |||
| AURA / Aura Biosciences, Inc. | 0,02 | 0,00 | 0,13 | 6,45 | 0,0025 | -0,0001 | |||
| ETNB / 89bio, Inc. | 0,01 | 0,00 | 0,11 | 36,36 | 0,0020 | 0,0004 | |||
| REPL / Replimune Group, Inc. | 0,01 | 0,10 | 0,0019 | 0,0019 | |||||
| HUMA / Humacyte, Inc. | 0,05 | 85,28 | 0,10 | 128,57 | 0,0018 | 0,0009 | |||
| ALDX / Aldeyra Therapeutics, Inc. | 0,02 | 0,00 | 0,07 | -33,33 | 0,0013 | -0,0008 | |||
| GOLD / Barrick Mining Corporation | 0,00 | -100,00 | 0,00 | 0,0000 | |||||
| PLRX / Pliant Therapeutics, Inc. | 0,00 | -100,00 | 0,00 | 0,0000 | |||||
| IIF / Morgan Stanley India Investment Fund, Inc. | 0,00 | -100,00 | 0,00 | 0,0000 | |||||
| PROK / ProKidney Corp. | 0,00 | -100,00 | 0,00 | 0,0000 | |||||
| KMB / Kimberly-Clark Corporation | 0,00 | -100,00 | 0,00 | 0,0000 | |||||
| DUK / Duke Energy Corporation | 0,00 | -100,00 | 0,00 | 0,0000 |