Statistiques de base
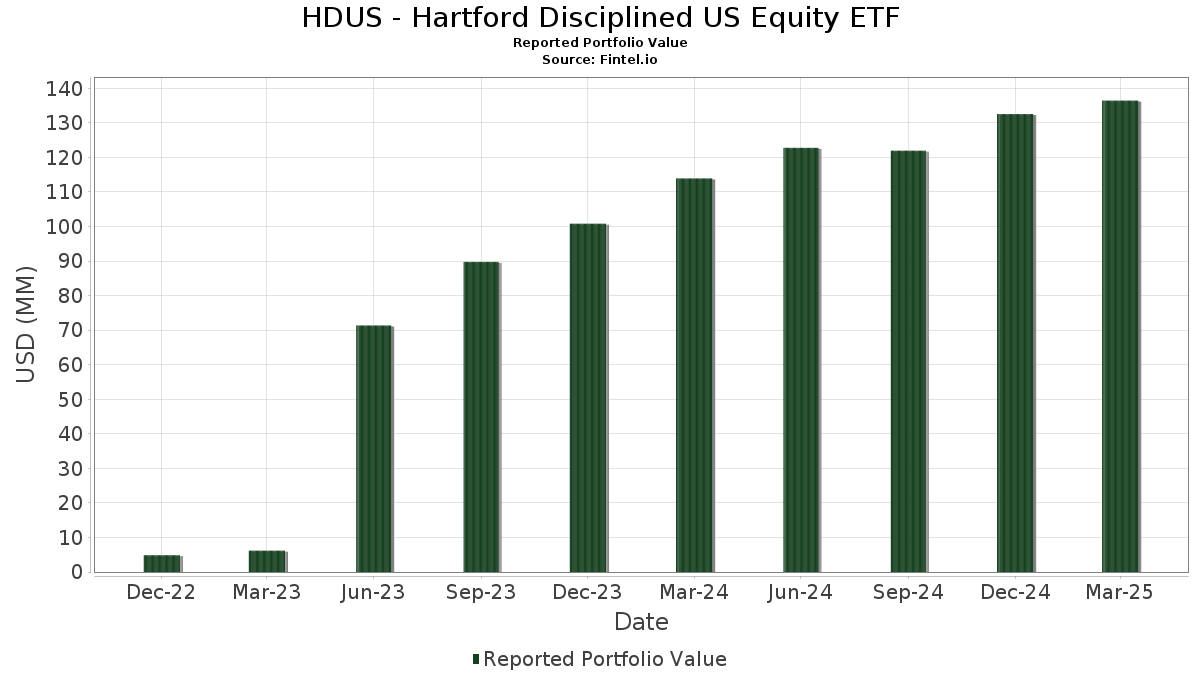
| Valeur du portefeuille | $ 136 445 214 |
| Positions actuelles | 261 |
Dernières positions, performances, ASG (à partir des dépôts 13F, 13D)
HDUS - Hartford Disciplined US Equity ETF a déclaré un total de 261 positions dans ses derniers dépôts auprès de la SEC. La valeur la plus récente du portefeuille est calculée à 136 445 214 USD. Les actifs sous gestion réels (ASG) sont cette valeur plus les liquidités (qui ne sont pas divulguées). Les principales positions de HDUS - Hartford Disciplined US Equity ETF sont Apple Inc. (US:AAPL) , Microsoft Corporation (US:MSFT) , NVIDIA Corporation (US:NVDA) , Alphabet Inc. (US:GOOGL) , and Amazon.com, Inc. (US:AMZN) . Les nouvelles positions de HDUS - Hartford Disciplined US Equity ETF incluent Cal-Maine Foods, Inc. (US:CALM) , Genpact Limited (US:G) , SEI Investments Company (US:SEIC) , Viper Energy, Inc. (US:VNOM) , and Primo Brands Corporation (US:PRMB) .
Meilleures augmentations ce trimestre
Nous utilisons la variation de l'allocation du portefeuille car il s'agit de l'indicateur le plus significatif. Les changements peuvent être dus à des transactions ou à des variations de prix des actions.
| Titre | Actions (en millions) |
Valeur ($ en millions) |
% du portefeuille | ΔPortefeuille % |
|---|---|---|---|---|
| 0,02 | 1,47 | 1,0734 | 1,0734 | |
| 0,01 | 1,15 | 0,8420 | 0,8420 | |
| 0,03 | 1,31 | 0,9572 | 0,7591 | |
| 0,00 | 1,10 | 0,8065 | 0,7525 | |
| 0,02 | 0,88 | 0,6453 | 0,6453 | |
| 0,00 | 1,32 | 0,9653 | 0,6417 | |
| 0,00 | 0,91 | 0,6676 | 0,6181 | |
| 0,01 | 0,99 | 0,7230 | 0,5151 | |
| 0,00 | 0,85 | 0,6195 | 0,5115 | |
| 0,01 | 1,40 | 1,0214 | 0,5060 |
Principales baisses ce trimestre
Nous utilisons la variation de l'allocation du portefeuille car il s'agit de l'indicateur le plus significatif. Les changements peuvent être dus à des transactions ou à des variations de prix des actions.
| Titre | Actions (en millions) |
Valeur ($ en millions) |
% du portefeuille | ΔPortefeuille % |
|---|---|---|---|---|
| 0,06 | 6,00 | 4,3937 | -1,2467 | |
| 0,02 | 6,33 | 4,6322 | -0,8280 | |
| 0,00 | 0,66 | 0,4809 | -0,5731 | |
| 0,00 | 0,00 | -0,5508 | ||
| 0,00 | 0,16 | 0,1173 | -0,5084 | |
| 0,00 | 0,94 | 0,6898 | -0,4062 | |
| 0,00 | 0,35 | 0,2575 | -0,3945 | |
| 0,01 | 0,78 | 0,5716 | -0,3834 | |
| 0,00 | 0,66 | 0,4826 | -0,3805 | |
| 0,03 | 5,41 | 3,9596 | -0,3638 |
Déclarations 13F et dépôts de fonds
Ce formulaire a été déposé le 2025-05-22 pour la période de déclaration 2025-03-31. Cliquez sur l'icône du lien pour voir l'historique complet des transactions.
Mettre à niveau pour débloquer les données premium et exporter vers Excel ![]() .
.
| Titre | Type | Prix moyen de l'action | Actions (en millions) |
ΔActions (%) |
ΔActions (%) |
Valeur ($ en millions) |
Portefeuille (%) |
ΔPortefeuille (%) |
|
|---|---|---|---|---|---|---|---|---|---|
| AAPL / Apple Inc. | 0,03 | 10,74 | 7,42 | -1,77 | 5,4282 | -0,2565 | |||
| MSFT / Microsoft Corporation | 0,02 | -2,01 | 6,33 | -12,74 | 4,6322 | -0,8280 | |||
| NVDA / NVIDIA Corporation | 0,06 | -0,71 | 6,00 | -19,87 | 4,3937 | -1,2467 | |||
| GOOGL / Alphabet Inc. | 0,03 | 15,33 | 5,41 | -5,78 | 3,9596 | -0,3638 | |||
| AMZN / Amazon.com, Inc. | 0,03 | 18,09 | 5,07 | 2,41 | 3,7086 | -0,0167 | |||
| META / Meta Platforms, Inc. | 0,01 | 22,91 | 3,13 | 21,00 | 2,2898 | 0,3430 | |||
| AVGO / Broadcom Inc. | 0,01 | 32,37 | 2,32 | -4,41 | 1,6994 | -0,1293 | |||
| TSLA / Tesla, Inc. | 0,01 | 35,89 | 2,09 | -12,80 | 1,5260 | -0,2741 | |||
| JNJ / Johnson & Johnson | 0,01 | -6,57 | 2,06 | 7,14 | 1,5056 | 0,0599 | |||
| PEP / PepsiCo, Inc. | 0,01 | 31,47 | 1,90 | 29,60 | 1,3911 | 0,2873 | |||
| CVX / Chevron Corporation | 0,01 | 18,48 | 1,52 | 36,84 | 1,1152 | 0,2769 | |||
| VLTO / Veralto Corporation | 0,02 | 1,47 | 1,0734 | 1,0734 | |||||
| JPM / JPMorgan Chase & Co. | 0,01 | 12,67 | 1,43 | 15,35 | 1,0453 | 0,1127 | |||
| GILD / Gilead Sciences, Inc. | 0,01 | 68,07 | 1,40 | 103,95 | 1,0214 | 0,5060 | |||
| DBX / Dropbox, Inc. | 0,05 | 92,82 | 1,37 | 71,54 | 1,0058 | 0,4023 | |||
| MO / Altria Group, Inc. | 0,02 | -18,83 | 1,32 | -6,84 | 0,9677 | -0,1008 | |||
| V / Visa Inc. | 0,00 | 147,96 | 1,32 | 231,41 | 0,9653 | 0,6417 | |||
| BMY / Bristol-Myers Squibb Company | 0,02 | 28,28 | 1,32 | 38,34 | 0,9638 | 0,2470 | |||
| ORI / Old Republic International Corporation | 0,03 | 358,56 | 1,31 | 397,34 | 0,9572 | 0,7591 | |||
| GLPI / Gaming and Leisure Properties, Inc. | 0,03 | 87,20 | 1,28 | 97,98 | 0,9337 | 0,4483 | |||
| LAMR / Lamar Advertising Company | 0,01 | 33,66 | 1,24 | 24,85 | 0,9087 | 0,1604 | |||
| VZ / Verizon Communications Inc. | 0,03 | -36,15 | 1,15 | -27,61 | 0,8428 | -0,3544 | |||
| CALM / Cal-Maine Foods, Inc. | 0,01 | 1,15 | 0,8420 | 0,8420 | |||||
| LLY / Eli Lilly and Company | 0,00 | -15,69 | 1,11 | -9,76 | 0,8117 | -0,1141 | |||
| NFLX / Netflix, Inc. | 0,00 | 21,94 | 1,10 | 27,63 | 0,8080 | 0,1565 | |||
| SNA / Snap-on Incorporated | 0,00 | 1 449,76 | 1,10 | 1 452,11 | 0,8065 | 0,7525 | |||
| RTX / RTX Corporation | 0,01 | 109,32 | 1,00 | 139,71 | 0,7335 | 0,4186 | |||
| MDT / Medtronic plc | 0,01 | 218,02 | 0,99 | 257,61 | 0,7230 | 0,5151 | |||
| BSX / Boston Scientific Corporation | 0,01 | 94,42 | 0,97 | 119,64 | 0,7128 | 0,3789 | |||
| VRSK / Verisk Analytics, Inc. | 0,00 | 156,20 | 0,95 | 176,74 | 0,6970 | 0,4380 | |||
| ABBV / AbbVie Inc. | 0,00 | -45,09 | 0,94 | -35,26 | 0,6898 | -0,4062 | |||
| FOXA / Fox Corporation | 0,02 | 119,92 | 0,93 | 156,32 | 0,6833 | 0,4089 | |||
| CME / CME Group Inc. | 0,00 | 1 009,35 | 0,91 | 1 420,00 | 0,6676 | 0,6181 | |||
| G / Genpact Limited | 0,02 | 0,88 | 0,6453 | 0,6453 | |||||
| TROW / T. Rowe Price Group, Inc. | 0,01 | 59,65 | 0,88 | 29,79 | 0,6440 | 0,1332 | |||
| KMB / Kimberly-Clark Corporation | 0,01 | 158,47 | 0,88 | 180,51 | 0,6432 | 0,4073 | |||
| IBM / International Business Machines Corporation | 0,00 | -23,70 | 0,87 | -13,75 | 0,6387 | -0,1225 | |||
| QCOM / QUALCOMM Incorporated | 0,01 | 38,36 | 0,87 | 38,44 | 0,6354 | 0,1629 | |||
| BK / The Bank of New York Mellon Corporation | 0,01 | -2,73 | 0,87 | 6,25 | 0,6346 | 0,0198 | |||
| WMT / Walmart Inc. | 0,01 | -10,21 | 0,87 | -12,79 | 0,6344 | -0,1136 | |||
| ECL / Ecolab Inc. | 0,00 | 445,59 | 0,85 | 491,61 | 0,6195 | 0,5115 | |||
| T / AT&T Inc. | 0,03 | -7,23 | 0,85 | 15,26 | 0,6193 | 0,0664 | |||
| RPM / RPM International Inc. | 0,01 | 58,74 | 0,82 | 49,18 | 0,5976 | 0,1856 | |||
| NTAP / NetApp, Inc. | 0,01 | 33,25 | 0,78 | 0,77 | 0,5721 | -0,0115 | |||
| XOM / Exxon Mobil Corporation | 0,01 | -44,31 | 0,78 | -38,41 | 0,5716 | -0,3834 | |||
| UNH / UnitedHealth Group Incorporated | 0,00 | -18,37 | 0,77 | -15,48 | 0,5638 | -0,1224 | |||
| SPG / Simon Property Group, Inc. | 0,00 | 84,19 | 0,77 | 77,49 | 0,5605 | 0,2359 | |||
| BKNG / Booking Holdings Inc. | 0,00 | 25,76 | 0,76 | 16,64 | 0,5596 | 0,0659 | |||
| ABT / Abbott Laboratories | 0,01 | -7,19 | 0,75 | 8,97 | 0,5511 | 0,0302 | |||
| COST / Costco Wholesale Corporation | 0,00 | -14,72 | 0,75 | -12,08 | 0,5495 | -0,0926 | |||
| CRM / Salesforce, Inc. | 0,00 | 91,15 | 0,75 | 53,39 | 0,5473 | 0,1804 | |||
| MA / Mastercard Incorporated | 0,00 | 408,68 | 0,74 | 536,21 | 0,5407 | 0,4458 | |||
| INGR / Ingredion Incorporated | 0,01 | 98,94 | 0,74 | 95,76 | 0,5405 | 0,2562 | |||
| CTAS / Cintas Corporation | 0,00 | -8,61 | 0,72 | 2,84 | 0,5302 | -0,0003 | |||
| PAYX / Paychex, Inc. | 0,00 | 935,23 | 0,70 | 1 050,82 | 0,5143 | 0,4678 | |||
| ORCL / Oracle Corporation | 0,00 | -1,18 | 0,69 | -17,19 | 0,5049 | -0,1216 | |||
| AXS / AXIS Capital Holdings Limited | 0,01 | 3,02 | 0,67 | 16,61 | 0,4883 | 0,0572 | |||
| DRI / Darden Restaurants, Inc. | 0,00 | 247,39 | 0,66 | 288,30 | 0,4859 | 0,3566 | |||
| CMI / Cummins Inc. | 0,00 | -36,03 | 0,66 | -42,50 | 0,4826 | -0,3805 | |||
| TXN / Texas Instruments Incorporated | 0,00 | -51,02 | 0,66 | -53,07 | 0,4809 | -0,5731 | |||
| KNF / Knife River Corporation | 0,01 | -23,66 | 0,66 | -32,26 | 0,4798 | -0,2486 | |||
| ACI / Albertsons Companies, Inc. | 0,03 | 162,89 | 0,65 | 194,55 | 0,4748 | 0,3089 | |||
| OGE / OGE Energy Corp. | 0,01 | 1 881,32 | 0,65 | 2 134,48 | 0,4745 | 0,4524 | |||
| GE / General Electric Company | 0,00 | 187,16 | 0,64 | 245,95 | 0,4686 | 0,3287 | |||
| ADC / Agree Realty Corporation | 0,01 | 33,27 | 0,63 | 46,15 | 0,4591 | 0,1357 | |||
| EME / EMCOR Group, Inc. | 0,00 | 9,21 | 0,62 | -11,02 | 0,4555 | -0,0714 | |||
| EOG / EOG Resources, Inc. | 0,00 | 10,61 | 0,62 | 15,79 | 0,4509 | 0,0501 | |||
| STWD / Starwood Property Trust, Inc. | 0,03 | -5,72 | 0,61 | -1,61 | 0,4482 | -0,0205 | |||
| SEIC / SEI Investments Company | 0,01 | 0,59 | 0,4341 | 0,4341 | |||||
| NOW / ServiceNow, Inc. | 0,00 | 209,24 | 0,59 | 132,14 | 0,4288 | 0,2389 | |||
| HD / The Home Depot, Inc. | 0,00 | 2,06 | 0,58 | -3,81 | 0,4248 | -0,0296 | |||
| TRV / The Travelers Companies, Inc. | 0,00 | 48,71 | 0,58 | 63,46 | 0,4225 | 0,1563 | |||
| VNOM / Viper Energy, Inc. | 0,01 | 0,58 | 0,4214 | 0,4214 | |||||
| UNM / Unum Group | 0,01 | 127,87 | 0,55 | 311,94 | 0,4045 | 0,2713 | |||
| WFC / Wells Fargo & Company | 0,01 | 52,00 | 0,55 | 55,37 | 0,4030 | 0,1361 | |||
| RITM / Rithm Capital Corp. | 0,05 | 9,12 | 0,54 | 15,30 | 0,3918 | 0,0425 | |||
| EBAY / eBay Inc. | 0,01 | 33,63 | 0,52 | 45,94 | 0,3818 | 0,1130 | |||
| R / Ryder System, Inc. | 0,00 | 2,09 | 0,52 | -6,31 | 0,3805 | -0,0377 | |||
| JHG / Janus Henderson Group plc | 0,01 | -31,42 | 0,51 | -41,70 | 0,3758 | -0,2874 | |||
| RS / Reliance, Inc. | 0,00 | 43,65 | 0,51 | 48,70 | 0,3755 | 0,0333 | |||
| CAH / Cardinal Health, Inc. | 0,00 | 124,52 | 0,51 | 207,23 | 0,3739 | 0,2092 | |||
| DGX / Quest Diagnostics Incorporated | 0,00 | 18,44 | 0,50 | 33,16 | 0,3674 | 0,0829 | |||
| MRK / Merck & Co., Inc. | 0,01 | 53,39 | 0,50 | 38,66 | 0,3625 | 0,0931 | |||
| LRCX / Lam Research Corporation | 0,01 | 127,78 | 0,49 | 129,44 | 0,3599 | 0,1984 | |||
| ZTS / Zoetis Inc. | 0,00 | 165,63 | 0,49 | 169,78 | 0,3594 | 0,2217 | |||
| CRWD / CrowdStrike Holdings, Inc. | 0,00 | 74,56 | 0,49 | 80,07 | 0,3576 | 0,1531 | |||
| PRMB / Primo Brands Corporation | 0,01 | 0,45 | 0,3326 | 0,3326 | |||||
| CTSH / Cognizant Technology Solutions Corporation | 0,01 | -37,02 | 0,44 | -37,32 | 0,3185 | -0,2044 | |||
| PLTR / Palantir Technologies Inc. | 0,01 | -13,27 | 0,43 | -3,12 | 0,3177 | -0,0200 | |||
| MS / Morgan Stanley | 0,00 | -12,97 | 0,43 | -19,32 | 0,3152 | -0,0863 | |||
| OHI / Omega Healthcare Investors, Inc. | 0,01 | 4,07 | 0,42 | 4,77 | 0,3057 | 0,0054 | |||
| EVRG / Evergy, Inc. | 0,01 | 0,40 | 0,2955 | 0,2955 | |||||
| DLB / Dolby Laboratories, Inc. | 0,01 | 346,58 | 0,40 | 352,81 | 0,2953 | 0,2229 | |||
| EGP / EastGroup Properties, Inc. | 0,00 | 1 919,64 | 0,40 | 2 241,18 | 0,2916 | 0,2781 | |||
| DLR / Digital Realty Trust, Inc. | 0,00 | 0,40 | 0,2901 | 0,2901 | |||||
| EXEL / Exelixis, Inc. | 0,01 | 97,92 | 0,39 | 206,25 | 0,2873 | 0,1598 | |||
| RHI / Robert Half Inc. | 0,01 | -21,89 | 0,39 | -39,53 | 0,2857 | -0,2003 | |||
| TXRH / Texas Roadhouse, Inc. | 0,00 | -29,41 | 0,39 | -34,84 | 0,2851 | -0,1648 | |||
| C / Citigroup Inc. | 0,01 | 194,88 | 0,39 | 198,46 | 0,2843 | 0,1860 | |||
| AGNC / AGNC Investment Corp. | 0,04 | -16,61 | 0,38 | -13,41 | 0,2794 | -0,0520 | |||
| GLW / Corning Incorporated | 0,01 | 126,46 | 0,38 | 118,60 | 0,2758 | 0,1458 | |||
| TJX / The TJX Companies, Inc. | 0,00 | 291,14 | 0,38 | 295,79 | 0,2754 | 0,2036 | |||
| NEE / NextEra Energy, Inc. | 0,01 | 33,01 | 0,37 | 31,80 | 0,2732 | 0,0595 | |||
| VICI / VICI Properties Inc. | 0,01 | 278,04 | 0,37 | 332,56 | 0,2729 | 0,2026 | |||
| PG / The Procter & Gamble Company | 0,00 | -40,09 | 0,37 | -38,10 | 0,2726 | -0,2161 | |||
| HSY / The Hershey Company | 0,00 | 22,81 | 0,37 | 24,07 | 0,2682 | 0,0458 | |||
| AMAT / Applied Materials, Inc. | 0,00 | -13,46 | 0,35 | -22,81 | 0,2582 | -0,0857 | |||
| CL / Colgate-Palmolive Company | 0,00 | -60,58 | 0,35 | -59,47 | 0,2575 | -0,3945 | |||
| GRMN / Garmin Ltd. | 0,00 | 0,35 | 0,2574 | 0,2574 | |||||
| CF / CF Industries Holdings, Inc. | 0,00 | 1 243,37 | 0,35 | 1 350,00 | 0,2551 | 0,2351 | |||
| CSCO / Cisco Systems, Inc. | 0,01 | -23,47 | 0,35 | -20,28 | 0,2534 | -0,0734 | |||
| TE Connectivity PLC / EC (IE000IVNQZ81) | 0,00 | -27,06 | 0,34 | -28,09 | 0,2517 | -0,1074 | |||
| TE Connectivity PLC / EC (IE000IVNQZ81) | 0,00 | -27,06 | 0,34 | -28,09 | 0,2517 | -0,1074 | |||
| ALSN / Allison Transmission Holdings, Inc. | 0,00 | -50,10 | 0,33 | -55,90 | 0,2414 | -0,3207 | |||
| APH / Amphenol Corporation | 0,00 | -42,54 | 0,32 | -45,85 | 0,2347 | -0,2102 | |||
| SYK / Stryker Corporation | 0,00 | 190,69 | 0,31 | 200,96 | 0,2296 | 0,1510 | |||
| NRG / NRG Energy, Inc. | 0,00 | 118,69 | 0,31 | 131,58 | 0,2256 | 0,1253 | |||
| BBY / Best Buy Co., Inc. | 0,00 | 392,41 | 0,31 | 323,61 | 0,2236 | 0,1692 | |||
| CNP / CenterPoint Energy, Inc. | 0,01 | 0,30 | 0,2217 | 0,2217 | |||||
| WST / West Pharmaceutical Services, Inc. | 0,00 | -5,21 | 0,30 | -35,27 | 0,2205 | -0,1296 | |||
| LNG / Cheniere Energy, Inc. | 0,00 | 3,51 | 0,30 | 11,52 | 0,2200 | 0,0170 | |||
| DY / Dycom Industries, Inc. | 0,00 | 89,15 | 0,30 | 65,19 | 0,2195 | 0,0831 | |||
| ACN / Accenture plc | 0,00 | -36,00 | 0,30 | -43,21 | 0,2176 | -0,1767 | |||
| CB / Chubb Limited | 0,00 | -52,78 | 0,30 | -48,43 | 0,2161 | -0,2146 | |||
| LYB / LyondellBasell Industries N.V. | 0,00 | 64,71 | 0,29 | 22,03 | 0,2114 | -0,0229 | |||
| XEL / Xcel Energy Inc. | 0,00 | 0,29 | 0,2112 | 0,2112 | |||||
| KR / The Kroger Co. | 0,00 | 15,62 | 0,28 | 56,98 | 0,2060 | 0,0602 | |||
| COP / ConocoPhillips | 0,00 | -27,35 | 0,27 | -23,03 | 0,2009 | -0,0677 | |||
| CHRW / C.H. Robinson Worldwide, Inc. | 0,00 | -26,69 | 0,27 | -27,47 | 0,1994 | -0,0829 | |||
| OC / Owens Corning | 0,00 | 156,66 | 0,27 | 115,87 | 0,1993 | 0,1040 | |||
| WTM / White Mountains Insurance Group, Ltd. | 0,00 | 0,27 | 0,1987 | 0,1987 | |||||
| CRH / CRH plc | 0,00 | 263,21 | 0,27 | 246,15 | 0,1983 | 0,1392 | |||
| HUBS / HubSpot, Inc. | 0,00 | 37,90 | 0,27 | 13,45 | 0,1977 | 0,0178 | |||
| NYT / The New York Times Company | 0,01 | -4,38 | 0,27 | -8,84 | 0,1967 | -0,0254 | |||
| NXPI / NXP Semiconductors N.V. | 0,00 | -38,24 | 0,26 | -43,57 | 0,1899 | -0,1559 | |||
| TT / Trane Technologies plc | 0,00 | 62,26 | 0,26 | 47,98 | 0,1876 | 0,0572 | |||
| BRK.B / Berkshire Hathaway Inc. | 0,00 | -64,02 | 0,26 | -57,76 | 0,1875 | -0,2688 | |||
| GWRE / Guidewire Software, Inc. | 0,00 | -8,38 | 0,26 | 1,59 | 0,1873 | -0,0019 | |||
| STT / State Street Corporation | 0,00 | 33,84 | 0,25 | 22,22 | 0,1855 | 0,0292 | |||
| ROL / Rollins, Inc. | 0,00 | 17,58 | 0,25 | 45,61 | 0,1824 | 0,0129 | |||
| CHRD / Chord Energy Corporation | 0,00 | -7,18 | 0,25 | -10,55 | 0,1803 | -0,0270 | |||
| FDX / FedEx Corporation | 0,00 | -12,50 | 0,25 | -24,38 | 0,1798 | -0,0642 | |||
| EQIX / Equinix, Inc. | 0,00 | 32,57 | 0,24 | 43,29 | 0,1724 | 0,0385 | |||
| LOW / Lowe's Companies, Inc. | 0,00 | 2,47 | 0,23 | -2,93 | 0,1700 | -0,0106 | |||
| KLAC / KLA Corporation | 0,00 | -43,33 | 0,23 | -38,89 | 0,1691 | -0,1155 | |||
| GNTX / Gentex Corporation | 0,01 | 129,53 | 0,23 | 86,07 | 0,1667 | 0,0746 | |||
| AYI / Acuity Inc. | 0,00 | 370,72 | 0,22 | 330,77 | 0,1642 | 0,1244 | |||
| DCI / Donaldson Company, Inc. | 0,00 | -43,90 | 0,22 | -44,14 | 0,1640 | -0,1380 | |||
| JKHY / Jack Henry & Associates, Inc. | 0,00 | 390,40 | 0,22 | 418,60 | 0,1638 | 0,1308 | |||
| MRVL / Marvell Technology, Inc. | 0,00 | 0,22 | 0,1618 | 0,1618 | |||||
| WM / Waste Management, Inc. | 0,00 | -67,56 | 0,22 | -64,90 | 0,1601 | -0,3446 | |||
| HRB / H&R Block, Inc. | 0,00 | -54,53 | 0,22 | -52,81 | 0,1598 | -0,1880 | |||
| DDOG / Datadog, Inc. | 0,00 | 65,46 | 0,22 | 14,81 | 0,1589 | 0,0166 | |||
| KMI / Kinder Morgan, Inc. | 0,01 | -54,33 | 0,22 | -52,53 | 0,1584 | -0,1843 | |||
| RL / Ralph Lauren Corporation | 0,00 | -56,38 | 0,21 | -58,40 | 0,1562 | -0,2293 | |||
| CEG / Constellation Energy Corporation | 0,00 | -50,42 | 0,21 | -50,23 | 0,1557 | -0,1905 | |||
| SBUX / Starbucks Corporation | 0,00 | 135,92 | 0,21 | 153,66 | 0,1528 | 0,0908 | |||
| PR / Permian Resources Corporation | 0,02 | 0,21 | 0,1524 | 0,1524 | |||||
| LMT / Lockheed Martin Corporation | 0,00 | -43,10 | 0,21 | -47,61 | 0,1523 | -0,1473 | |||
| LPLA / LPL Financial Holdings Inc. | 0,00 | 827,27 | 0,20 | 1 328,57 | 0,1465 | 0,1264 | |||
| PYPL / PayPal Holdings, Inc. | 0,00 | 898,37 | 0,20 | 665,38 | 0,1459 | 0,1262 | |||
| MCO / Moody's Corporation | 0,00 | -63,75 | 0,20 | -64,49 | 0,1442 | -0,2717 | |||
| WSM / Williams-Sonoma, Inc. | 0,00 | 32,58 | 0,19 | 12,87 | 0,1417 | 0,0129 | |||
| ADP / Automatic Data Processing, Inc. | 0,00 | 0,19 | 0,1409 | 0,1409 | |||||
| NTRS / Northern Trust Corporation | 0,00 | 0,19 | 0,1406 | 0,1406 | |||||
| LII / Lennox International Inc. | 0,00 | 72,22 | 0,19 | 59,17 | 0,1400 | 0,0491 | |||
| NET / Cloudflare, Inc. | 0,00 | 467,79 | 0,19 | 493,75 | 0,1395 | 0,1154 | |||
| NLY / Annaly Capital Management, Inc. | 0,01 | 367,01 | 0,19 | 427,78 | 0,1395 | 0,1118 | |||
| ALV / Autoliv, Inc. | 0,00 | -28,26 | 0,19 | -32,50 | 0,1390 | -0,0724 | |||
| AWI / Armstrong World Industries, Inc. | 0,00 | 0,19 | 0,1378 | 0,1378 | |||||
| PEN / Penumbra, Inc. | 0,00 | 449,21 | 0,19 | 330,23 | 0,1354 | 0,0747 | |||
| AM / Antero Midstream Corporation | 0,01 | 0,18 | 0,1344 | 0,1344 | |||||
| UBER / Uber Technologies, Inc. | 0,00 | -54,67 | 0,18 | -45,35 | 0,1336 | -0,1174 | |||
| ANET / Arista Networks Inc | 0,00 | 0,18 | 0,1332 | 0,1332 | |||||
| DASH / DoorDash, Inc. | 0,00 | 42,03 | 0,18 | 55,65 | 0,1311 | 0,0439 | |||
| RSG / Republic Services, Inc. | 0,00 | 51,97 | 0,17 | 89,77 | 0,1228 | 0,0508 | |||
| BIIB / Biogen Inc. | 0,00 | 0,17 | 0,1214 | 0,1214 | |||||
| PRU / Prudential Financial, Inc. | 0,00 | -38,89 | 0,17 | -42,51 | 0,1211 | -0,0953 | |||
| PCAR / PACCAR Inc | 0,00 | -78,01 | 0,16 | -79,22 | 0,1173 | -0,5084 | |||
| BRBR / BellRing Brands, Inc. | 0,00 | 0,16 | 0,1169 | 0,1169 | |||||
| COKE / Coca-Cola Consolidated, Inc. | 0,00 | -5,60 | 0,16 | 1,27 | 0,1166 | -0,0020 | |||
| ISRG / Intuitive Surgical, Inc. | 0,00 | 677,50 | 0,15 | 670,00 | 0,1127 | 0,0970 | |||
| ETN / Eaton Corporation plc | 0,00 | -37,42 | 0,15 | -48,99 | 0,1118 | -0,1126 | |||
| GEHC / GE HealthCare Technologies Inc. | 0,00 | -13,73 | 0,15 | -11,04 | 0,1066 | -0,0165 | |||
| COIN / Coinbase Global, Inc. | 0,00 | 212,45 | 0,14 | 118,46 | 0,1044 | 0,0548 | |||
| JBL / Jabil Inc. | 0,00 | -47,71 | 0,14 | -34,60 | 0,1014 | -0,0707 | |||
| SWKS / Skyworks Solutions, Inc. | 0,00 | 140,45 | 0,14 | 75,64 | 0,1006 | 0,0416 | |||
| LKQ / LKQ Corporation | 0,00 | 534,99 | 0,13 | 664,71 | 0,0955 | 0,0821 | |||
| AXP / American Express Company | 0,00 | -46,74 | 0,13 | -51,89 | 0,0933 | -0,1055 | |||
| KEYS / Keysight Technologies, Inc. | 0,00 | 66,88 | 0,12 | 82,54 | 0,0845 | 0,0332 | |||
| RBLX / Roblox Corporation | 0,00 | 87,31 | 0,12 | 88,52 | 0,0844 | 0,0384 | |||
| CWAN / Clearwater Analytics Holdings, Inc. | 0,00 | 0,11 | 0,0810 | 0,0810 | |||||
| AMCR / Amcor plc | 0,01 | 0,11 | 0,0801 | 0,0801 | |||||
| TEAM / Atlassian Corporation | 0,00 | -43,45 | 0,11 | -31,87 | 0,0798 | -0,0508 | |||
| BEN / Franklin Resources, Inc. | 0,01 | 0,11 | 0,0792 | 0,0792 | |||||
| HPQ / HP Inc. | 0,00 | -18,06 | 0,11 | -30,97 | 0,0790 | -0,0379 | |||
| TTD / The Trade Desk, Inc. | 0,00 | 0,10 | 0,0759 | 0,0759 | |||||
| COLD / Americold Realty Trust, Inc. | 0,00 | 114,20 | 0,10 | 52,24 | 0,0751 | 0,0083 | |||
| SHW / The Sherwin-Williams Company | 0,00 | -81,99 | 0,10 | -81,67 | 0,0746 | -0,3402 | |||
| PANW / Palo Alto Networks, Inc. | 0,00 | -47,15 | 0,10 | -50,25 | 0,0718 | -0,0772 | |||
| BLK / BlackRock, Inc. | 0,00 | -39,77 | 0,10 | -44,57 | 0,0713 | -0,0606 | |||
| RJF / Raymond James Financial, Inc. | 0,00 | 0,10 | 0,0704 | 0,0704 | |||||
| EHC / Encompass Health Corporation | 0,00 | 0,09 | 0,0683 | 0,0683 | |||||
| ALNY / Alnylam Pharmaceuticals, Inc. | 0,00 | 67,48 | 0,09 | 138,46 | 0,0682 | 0,0292 | |||
| TMUS / T-Mobile US, Inc. | 0,00 | -75,88 | 0,09 | -71,15 | 0,0666 | -0,1684 | |||
| PGR / The Progressive Corporation | 0,00 | -81,93 | 0,09 | -78,77 | 0,0634 | -0,2420 | |||
| AAON / AAON, Inc. | 0,00 | 0,09 | 0,0633 | 0,0633 | |||||
| ALL / The Allstate Corporation | 0,00 | 0,09 | 0,0627 | 0,0627 | |||||
| BWXT / BWX Technologies, Inc. | 0,00 | -77,45 | 0,08 | -71,02 | 0,0601 | -0,2200 | |||
| DKS / DICK'S Sporting Goods, Inc. | 0,00 | -51,96 | 0,08 | -57,81 | 0,0596 | -0,0853 | |||
| FDS / FactSet Research Systems Inc. | 0,00 | 0,08 | 0,0592 | 0,0592 | |||||
| COG / Cabot Oil & Gas Corp. | 0,00 | 515,40 | 0,08 | 618,18 | 0,0583 | 0,0470 | |||
| FICO / Fair Isaac Corporation | 0,00 | -78,35 | 0,08 | -80,05 | 0,0567 | -0,2341 | |||
| DE / Deere & Company | 0,00 | -5,20 | 0,08 | 18,75 | 0,0563 | 0,0038 | |||
| BR / Broadridge Financial Solutions, Inc. | 0,00 | -56,15 | 0,08 | -53,37 | 0,0562 | -0,0668 | |||
| MTB / M&T Bank Corporation | 0,00 | 0,08 | 0,0557 | 0,0557 | |||||
| MSCI / MSCI Inc. | 0,00 | 32,00 | 0,07 | 23,33 | 0,0546 | 0,0095 | |||
| PLD / Prologis, Inc. | 0,00 | -14,46 | 0,07 | -14,63 | 0,0513 | -0,0156 | |||
| UPS / United Parcel Service, Inc. | 0,00 | -62,59 | 0,07 | -70,27 | 0,0490 | -0,1319 | |||
| LNTH / Lantheus Holdings, Inc. | 0,00 | 0,07 | 0,0486 | 0,0486 | |||||
| BAC / Bank of America Corporation | 0,00 | -25,98 | 0,07 | -29,79 | 0,0486 | -0,0225 | |||
| BYD / Boyd Gaming Corporation | 0,00 | 111,18 | 0,07 | 124,14 | 0,0482 | 0,0189 | |||
| FTNT / Fortinet, Inc. | 0,00 | 0,06 | 0,0459 | 0,0459 | |||||
| EMR / Emerson Electric Co. | 0,00 | 0,06 | 0,0457 | 0,0457 | |||||
| VRT / Vertiv Holdings Co | 0,00 | 99,30 | 0,06 | 69,44 | 0,0450 | 0,0149 | |||
| EMN / Eastman Chemical Company | 0,00 | 0,06 | 0,0411 | 0,0411 | |||||
| IDCC / InterDigital, Inc. | 0,00 | 0,05 | 0,0389 | 0,0389 | |||||
| FFIV / F5, Inc. | 0,00 | 0,05 | 0,0386 | 0,0386 | |||||
| FR / First Industrial Realty Trust, Inc. | 0,00 | 68,35 | 0,05 | 85,19 | 0,0368 | 0,0159 | |||
| PPG / PPG Industries, Inc. | 0,00 | 0,05 | 0,0354 | 0,0354 | |||||
| NXT / Nextracker Inc. | 0,00 | 0,05 | 0,0332 | 0,0332 | |||||
| HWM / Howmet Aerospace Inc. | 0,00 | 0,04 | 0,0325 | 0,0325 | |||||
| MLI / Mueller Industries, Inc. | 0,00 | -90,27 | 0,04 | -90,81 | 0,0320 | -0,3206 | |||
| CRDO / Credo Technology Group Holding Ltd | 0,00 | 0,04 | 0,0318 | 0,0318 | |||||
| APD / Air Products and Chemicals, Inc. | 0,00 | -62,66 | 0,04 | -63,25 | 0,0315 | -0,1325 | |||
| PH / Parker-Hannifin Corporation | 0,00 | 0,04 | 0,0311 | 0,0311 | |||||
| GTLB / GitLab Inc. | 0,00 | 0,04 | 0,0304 | 0,0304 | |||||
| BAH / Booz Allen Hamilton Holding Corporation | 0,00 | -87,84 | 0,04 | -90,24 | 0,0304 | -0,2860 | |||
| ADBE / Adobe Inc. | 0,00 | -69,77 | 0,04 | -73,89 | 0,0300 | -0,0885 | |||
| BJ / BJ's Wholesale Club Holdings, Inc. | 0,00 | -87,37 | 0,04 | -84,17 | 0,0284 | -0,1526 | |||
| FLEX / Flex Ltd. | 0,00 | -80,36 | 0,04 | -83,26 | 0,0282 | -0,1432 | |||
| DVA / DaVita Inc. | 0,00 | 0,03 | 0,0254 | 0,0254 | |||||
| TRGP / Targa Resources Corp. | 0,00 | -81,54 | 0,03 | -79,37 | 0,0244 | -0,0964 | |||
| CH1300646267 / Bunge Global SA | 0,00 | -89,43 | 0,03 | -89,90 | 0,0234 | -0,2080 | |||
| ESTC / Elastic N.V. | 0,00 | -53,85 | 0,03 | -58,11 | 0,0227 | -0,0335 | |||
| ADSK / Autodesk, Inc. | 0,00 | 0,03 | 0,0207 | 0,0207 | |||||
| CW / Curtiss-Wright Corporation | 0,00 | 0,03 | 0,0202 | 0,0202 | |||||
| RGLD / Royal Gold, Inc. | 0,00 | 0,03 | 0,0195 | 0,0195 | |||||
| OTIS / Otis Worldwide Corporation | 0,00 | -66,23 | 0,03 | -62,86 | 0,0193 | -0,0335 | |||
| BX / Blackstone Inc. | 0,00 | 0,03 | 0,0192 | 0,0192 | |||||
| SNOW / Snowflake Inc. | 0,00 | 48,72 | 0,03 | 38,89 | 0,0186 | 0,0050 | |||
| TRNO / Terreno Realty Corporation | 0,00 | 53,67 | 0,03 | 66,67 | 0,0184 | -0,0034 | |||
| NDAQ / Nasdaq, Inc. | 0,00 | -89,93 | 0,02 | -90,16 | 0,0177 | -0,1667 | |||
| TPR / Tapestry, Inc. | 0,00 | -45,61 | 0,02 | -43,24 | 0,0160 | -0,0121 | |||
| CTVA / Corteva, Inc. | 0,00 | -1,54 | 0,02 | 11,11 | 0,0147 | -0,0113 | |||
| ESI / Element Solutions Inc | 0,00 | -81,59 | 0,02 | -83,90 | 0,0142 | -0,0752 | |||
| SCHW / The Charles Schwab Corporation | 0,00 | -79,71 | 0,02 | -72,58 | 0,0128 | -0,0748 | |||
| EXPE / Expedia Group, Inc. | 0,00 | 0,02 | 0,0123 | 0,0123 | |||||
| A / Agilent Technologies, Inc. | 0,00 | -93,84 | 0,02 | -94,16 | 0,0113 | -0,3497 | |||
| JBHT / J.B. Hunt Transport Services, Inc. | 0,00 | -16,10 | 0,01 | -30,00 | 0,0107 | -0,0044 | |||
| WTW / Willis Towers Watson Public Limited Company | 0,00 | -100,00 | 0,00 | -100,00 | -0,0887 | ||||
| AMD / Advanced Micro Devices, Inc. | 0,00 | -100,00 | 0,00 | -100,00 | -0,0618 | ||||
| RDN / Radian Group Inc. | 0,00 | -100,00 | 0,00 | -100,00 | -0,3397 | ||||
| DHR / Danaher Corporation | 0,00 | -100,00 | 0,00 | -100,00 | -0,0807 | ||||
| CAT / Caterpillar Inc. | 0,00 | -100,00 | 0,00 | -100,00 | -0,2201 | ||||
| GM / General Motors Company | 0,00 | -100,00 | 0,00 | -100,00 | -0,0172 | ||||
| REGN / Regeneron Pharmaceuticals, Inc. | 0,00 | -100,00 | 0,00 | -100,00 | -0,0241 | ||||
| CDNS / Cadence Design Systems, Inc. | 0,00 | -100,00 | 0,00 | -100,00 | -0,1597 | ||||
| YUM / Yum! Brands, Inc. | 0,00 | -100,00 | 0,00 | -100,00 | -0,5508 | ||||
| PFE / Pfizer Inc. | 0,00 | -100,00 | 0,00 | -100,00 | -0,2002 | ||||
| FUN / Six Flags Entertainment Corporation | 0,00 | -100,00 | 0,00 | -100,00 | -0,2479 | ||||
| TMO / Thermo Fisher Scientific Inc. | 0,00 | -100,00 | 0,00 | -100,00 | -0,1574 | ||||
| IBKR / Interactive Brokers Group, Inc. | 0,00 | -100,00 | 0,00 | -100,00 | -0,0277 | ||||
| SP500 MIC EMIN FUTJUN25 / DE (000000000) | -0,01 | -0,0039 | -0,0039 |