Statistiques de base
| Valeur du portefeuille | $ 131 312 042 |
| Positions actuelles | 134 |
Dernières positions, performances, ASG (à partir des dépôts 13F, 13D)
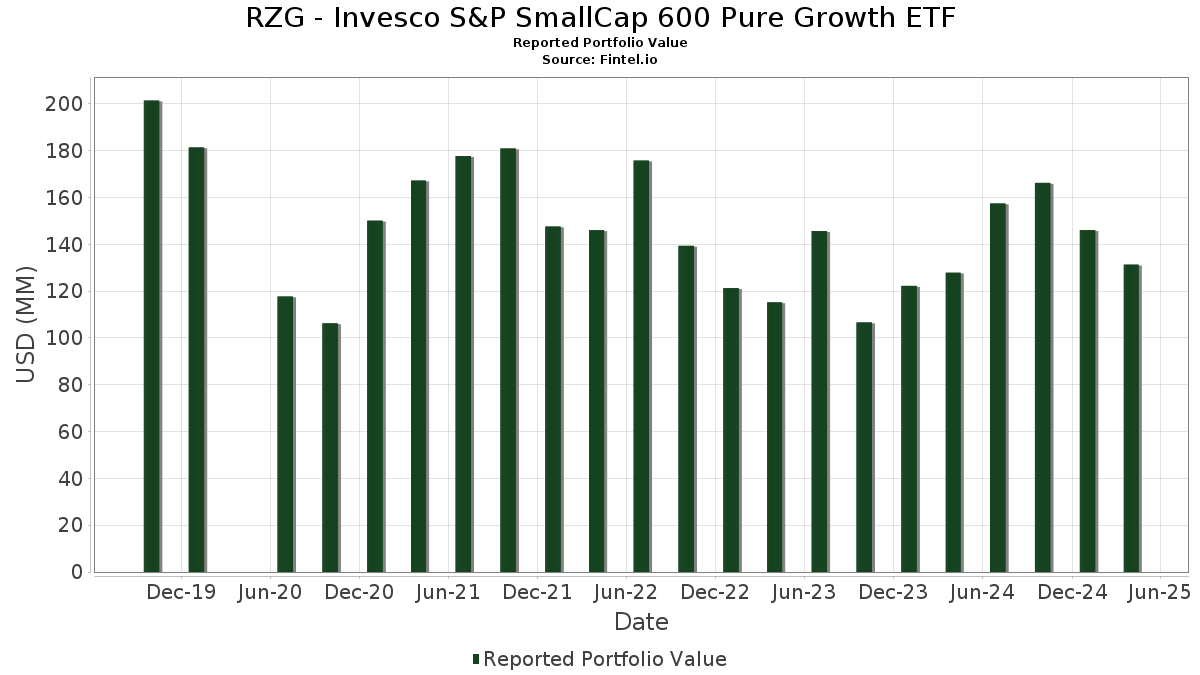
RZG - Invesco S&P SmallCap 600 Pure Growth ETF a déclaré un total de 134 positions dans ses derniers dépôts auprès de la SEC. La valeur la plus récente du portefeuille est calculée à 131 312 042 USD. Les actifs sous gestion réels (ASG) sont cette valeur plus les liquidités (qui ne sont pas divulguées). Les principales positions de RZG - Invesco S&P SmallCap 600 Pure Growth ETF sont TG Therapeutics, Inc. (US:TGTX) , Palomar Holdings, Inc. (US:PLMR) , ADMA Biologics, Inc. (US:ADMA) , Protagonist Therapeutics, Inc. (US:PTGX) , and Corcept Therapeutics Incorporated (US:CORT) . Les nouvelles positions de RZG - Invesco S&P SmallCap 600 Pure Growth ETF incluent Freshpet, Inc. (US:FRPT) , Sterling Infrastructure, Inc. (US:STRL) , Ryman Hospitality Properties, Inc. (US:RHP) , CleanSpark, Inc. (US:CLSK) , and Mueller Water Products, Inc. (US:MWA) .
Meilleures augmentations ce trimestre
Nous utilisons la variation de l'allocation du portefeuille car il s'agit de l'indicateur le plus significatif. Les changements peuvent être dus à des transactions ou à des variations de prix des actions.
| Titre | Actions (en millions) |
Valeur ($ en millions) |
% du portefeuille | ΔPortefeuille % |
|---|---|---|---|---|
| 23,64 | 23,64 | 23,9641 | 23,9641 | |
| 9,08 | 9,08 | 9,2078 | 9,2078 | |
| 0,01 | 0,97 | 0,9884 | 0,9884 | |
| 0,05 | 2,32 | 2,3507 | 0,8877 | |
| 0,08 | 1,92 | 1,9419 | 0,7638 | |
| 0,00 | 0,70 | 0,7095 | 0,7095 | |
| 0,01 | 1,97 | 1,9950 | 0,6670 | |
| 0,01 | 0,66 | 0,6649 | 0,6649 | |
| 0,08 | 0,62 | 0,6296 | 0,6296 | |
| 0,02 | 0,58 | 0,5838 | 0,5838 |
Principales baisses ce trimestre
Nous utilisons la variation de l'allocation du portefeuille car il s'agit de l'indicateur le plus significatif. Les changements peuvent être dus à des transactions ou à des variations de prix des actions.
| Titre | Actions (en millions) |
Valeur ($ en millions) |
% du portefeuille | ΔPortefeuille % |
|---|---|---|---|---|
| 0,00 | 0,00 | -1,7501 | ||
| 0,00 | 0,00 | -1,0955 | ||
| 0,00 | 0,00 | -0,5511 | ||
| 0,02 | 0,93 | 0,9410 | -0,3739 | |
| 0,05 | 0,61 | 0,6228 | -0,3224 | |
| 0,02 | 0,73 | 0,7449 | -0,3031 | |
| 0,03 | 0,82 | 0,8323 | -0,2901 | |
| 0,01 | 0,65 | 0,6542 | -0,2480 | |
| 0,01 | 1,01 | 1,0199 | -0,2176 | |
| 0,07 | 0,90 | 0,9135 | -0,2071 |
Déclarations 13F et dépôts de fonds
Ce formulaire a été déposé le 2025-06-27 pour la période de déclaration 2025-04-30. Cliquez sur l'icône du lien pour voir l'historique complet des transactions.
Mettre à niveau pour débloquer les données premium et exporter vers Excel ![]() .
.
| Titre | Type | Prix moyen de l'action | Actions (en millions) |
ΔActions (%) |
ΔActions (%) |
Valeur ($ en millions) |
Portefeuille (%) |
ΔPortefeuille (%) |
|
|---|---|---|---|---|---|---|---|---|---|
| Invesco Private Prime Fund / STIV (N/A) | 23,64 | 23,64 | 23,9641 | 23,9641 | |||||
| Invesco Private Government Fund / STIV (N/A) | 9,08 | 9,08 | 9,2078 | 9,2078 | |||||
| TGTX / TG Therapeutics, Inc. | 0,05 | -2,09 | 2,32 | 40,57 | 2,3507 | 0,8877 | |||
| PLMR / Palomar Holdings, Inc. | 0,01 | -2,25 | 1,97 | 31,40 | 1,9950 | 0,6670 | |||
| ADMA / ADMA Biologics, Inc. | 0,08 | -2,16 | 1,92 | 44,20 | 1,9419 | 0,7638 | |||
| PTGX / Protagonist Therapeutics, Inc. | 0,04 | -2,06 | 1,86 | 18,73 | 1,8909 | 0,4975 | |||
| CORT / Corcept Therapeutics Incorporated | 0,03 | -2,18 | 1,83 | 5,04 | 1,8601 | 0,3114 | |||
| DXPE / DXP Enterprises, Inc. | 0,02 | -2,18 | 1,68 | -14,61 | 1,7071 | -0,0410 | |||
| IDCC / InterDigital, Inc. | 0,01 | -2,17 | 1,63 | 7,51 | 1,6548 | 0,3078 | |||
| CNK / Cinemark Holdings, Inc. | 0,05 | -2,21 | 1,62 | 2,14 | 1,6440 | 0,2363 | |||
| CHEF / The Chefs' Warehouse, Inc. | 0,03 | -2,18 | 1,53 | 3,46 | 1,5476 | 0,2392 | |||
| ATGE / Adtalem Global Education Inc. | 0,01 | -2,23 | 1,49 | -3,06 | 1,5081 | 0,1470 | |||
| KRYS / Krystal Biotech, Inc. | 0,01 | -2,22 | 1,41 | 3,99 | 1,4287 | 0,2269 | |||
| AZZ / AZZ Inc. | 0,02 | -2,09 | 1,36 | -0,95 | 1,3763 | 0,1604 | |||
| CALM / Cal-Maine Foods, Inc. | 0,01 | -2,21 | 1,35 | -15,42 | 1,3687 | -0,0461 | |||
| CPRX / Catalyst Pharmaceuticals, Inc. | 0,06 | -2,22 | 1,34 | 5,28 | 1,3556 | 0,2292 | |||
| AAMI / Acadian Asset Management Inc. | 0,04 | -2,25 | 1,16 | 5,65 | 1,1759 | 0,2024 | |||
| AX / Axos Financial, Inc. | 0,02 | -2,21 | 1,15 | -11,22 | 1,1637 | 0,0170 | |||
| TMDX / TransMedics Group, Inc. | 0,01 | -1,72 | 1,14 | 34,00 | 1,1509 | 0,3988 | |||
| CASH / Pathward Financial, Inc. | 0,01 | -2,23 | 1,10 | -2,66 | 1,1127 | 0,1126 | |||
| POWL / Powell Industries, Inc. | 0,01 | -2,21 | 1,07 | -25,37 | 1,0868 | -0,1862 | |||
| HCI / HCI Group, Inc. | 0,01 | -2,16 | 1,07 | 17,49 | 1,0830 | 0,2760 | |||
| UFPT / UFP Technologies, Inc. | 0,00 | -2,10 | 1,04 | -25,68 | 1,0568 | -0,1868 | |||
| ENVA / Enova International, Inc. | 0,01 | -2,23 | 1,02 | -20,11 | 1,0356 | -0,0982 | |||
| CVCO / Cavco Industries, Inc. | 0,00 | -2,32 | 1,02 | -5,12 | 1,0335 | 0,0802 | |||
| SKYW / SkyWest, Inc. | 0,01 | -2,24 | 1,01 | -27,96 | 1,0199 | -0,2176 | |||
| FRPT / Freshpet, Inc. | 0,01 | 0,97 | 0,9884 | 0,9884 | |||||
| DORM / Dorman Products, Inc. | 0,01 | -2,26 | 0,94 | -15,64 | 0,9578 | -0,0355 | |||
| LRN / Stride, Inc. | 0,01 | -1,74 | 0,93 | 3,67 | 0,9465 | 0,1474 | |||
| GRBK / Green Brick Partners, Inc. | 0,02 | -2,26 | 0,93 | -4,61 | 0,9452 | 0,0780 | |||
| GBX / The Greenbrier Companies, Inc. | 0,02 | -2,21 | 0,93 | -37,38 | 0,9410 | -0,3739 | |||
| SPXC / SPX Technologies, Inc. | 0,01 | -2,23 | 0,92 | -11,65 | 0,9309 | 0,0088 | |||
| EAT / Brinker International, Inc. | 0,01 | -2,29 | 0,92 | -27,87 | 0,9292 | -0,1980 | |||
| DY / Dycom Industries, Inc. | 0,01 | -2,31 | 0,91 | -13,45 | 0,9272 | -0,0101 | |||
| TRUP / Trupanion, Inc. | 0,02 | -2,17 | 0,90 | -24,54 | 0,9174 | -0,1459 | |||
| ACIW / ACI Worldwide, Inc. | 0,02 | -2,28 | 0,90 | -2,59 | 0,9150 | 0,0930 | |||
| MARA / MARA Holdings, Inc. | 0,07 | -2,18 | 0,90 | -28,74 | 0,9135 | -0,2071 | |||
| KAR / OPENLANE, Inc. | 0,05 | -2,29 | 0,89 | -10,99 | 0,9041 | 0,0159 | |||
| AWI / Armstrong World Industries, Inc. | 0,01 | -2,17 | 0,86 | -6,03 | 0,8693 | 0,0599 | |||
| CSW / CSW Industrials, Inc. | 0,00 | -2,29 | 0,85 | -7,38 | 0,8652 | 0,0476 | |||
| HWKN / Hawkins, Inc. | 0,01 | -1,74 | 0,85 | 12,02 | 0,8600 | 0,1879 | |||
| ICUI / ICU Medical, Inc. | 0,01 | -2,25 | 0,84 | -18,77 | 0,8558 | -0,0657 | |||
| TRN / Trinity Industries, Inc. | 0,03 | -2,23 | 0,82 | -35,18 | 0,8323 | -0,2901 | |||
| MSGS / Madison Square Garden Sports Corp. | 0,00 | -2,23 | 0,82 | -14,44 | 0,8302 | -0,0179 | |||
| ZWS / Zurn Elkay Water Solutions Corporation | 0,02 | -2,32 | 0,82 | -15,84 | 0,8296 | -0,0332 | |||
| SHAK / Shake Shack Inc. | 0,01 | -2,25 | 0,80 | -27,39 | 0,8094 | -0,1658 | |||
| INSP / Inspire Medical Systems, Inc. | 0,00 | -2,30 | 0,79 | -20,06 | 0,7963 | -0,0748 | |||
| HRMY / Harmony Biosciences Holdings, Inc. | 0,03 | -2,32 | 0,78 | -25,78 | 0,7913 | -0,1410 | |||
| DRH / DiamondRock Hospitality Company | 0,11 | -2,28 | 0,78 | -18,32 | 0,7873 | -0,0557 | |||
| YOU / Clear Secure, Inc. | 0,03 | -1,72 | 0,78 | 2,38 | 0,7865 | 0,1151 | |||
| CRVL / CorVel Corporation | 0,01 | -1,74 | 0,77 | -7,79 | 0,7805 | 0,0404 | |||
| DFH / Dream Finders Homes, Inc. | 0,03 | -2,19 | 0,75 | -3,95 | 0,7650 | 0,0684 | |||
| LMAT / LeMaitre Vascular, Inc. | 0,01 | -2,21 | 0,75 | -8,46 | 0,7576 | 0,0337 | |||
| PRSU / Pursuit Attractions and Hospitality, Inc. | 0,03 | -2,30 | 0,74 | -27,51 | 0,7534 | -0,1563 | |||
| TBBK / The Bancorp, Inc. | 0,02 | -2,17 | 0,74 | -22,62 | 0,7495 | -0,0976 | |||
| PI / Impinj, Inc. | 0,01 | -2,24 | 0,74 | -29,05 | 0,7458 | -0,1734 | |||
| WHD / Cactus, Inc. | 0,02 | -2,14 | 0,73 | -37,85 | 0,7449 | -0,3031 | |||
| ASTH / Astrana Health, Inc. | 0,02 | -2,18 | 0,72 | -17,34 | 0,7259 | -0,0419 | |||
| MCY / Mercury General Corporation | 0,01 | -2,11 | 0,72 | 8,83 | 0,7252 | 0,1424 | |||
| PJT / PJT Partners Inc. | 0,00 | -1,72 | 0,71 | -15,57 | 0,7151 | -0,0259 | |||
| BMI / Badger Meter, Inc. | 0,00 | -1,70 | 0,70 | 1,45 | 0,7117 | 0,0982 | |||
| COLL / Collegium Pharmaceutical, Inc. | 0,03 | -2,19 | 0,70 | -17,82 | 0,7117 | -0,0456 | |||
| STRL / Sterling Infrastructure, Inc. | 0,00 | 0,70 | 0,7095 | 0,7095 | |||||
| SABR / Sabre Corporation | 0,29 | -2,06 | 0,70 | -30,75 | 0,7064 | -0,1854 | |||
| CENX / Century Aluminum Company | 0,04 | -2,19 | 0,69 | -12,15 | 0,6968 | 0,0026 | |||
| PFBC / Preferred Bank | 0,01 | -1,72 | 0,67 | -14,08 | 0,6744 | -0,0123 | |||
| GVA / Granite Construction Incorporated | 0,01 | -1,72 | 0,66 | -9,41 | 0,6740 | 0,0235 | |||
| AROC / Archrock, Inc. | 0,03 | -2,19 | 0,66 | -18,15 | 0,6729 | -0,0456 | |||
| HCC / Warrior Met Coal, Inc. | 0,01 | -1,71 | 0,66 | -10,98 | 0,6670 | 0,0119 | |||
| RHP / Ryman Hospitality Properties, Inc. | 0,01 | 0,66 | 0,6649 | 0,6649 | |||||
| GSHD / Goosehead Insurance, Inc | 0,01 | -1,71 | 0,65 | -10,91 | 0,6626 | 0,0125 | |||
| FUN / Six Flags Entertainment Corporation | 0,02 | -2,29 | 0,65 | -23,79 | 0,6568 | -0,0966 | |||
| BOOT / Boot Barn Holdings, Inc. | 0,01 | -2,21 | 0,65 | -36,58 | 0,6542 | -0,2480 | |||
| WETF / Wisdomtree Investments Inc | 0,07 | -1,72 | 0,64 | -12,70 | 0,6485 | -0,0010 | |||
| XHR / Xenia Hotels & Resorts, Inc. | 0,06 | -2,31 | 0,63 | -30,23 | 0,6390 | -0,1625 | |||
| CNR / Core Natural Resources, Inc. | 0,01 | -2,25 | 0,63 | -21,92 | 0,6364 | -0,0761 | |||
| BLFS / BioLife Solutions, Inc. | 0,03 | -1,72 | 0,63 | -13,16 | 0,6360 | -0,0051 | |||
| CLSK / CleanSpark, Inc. | 0,08 | 0,62 | 0,6296 | 0,6296 | |||||
| IBP / Installed Building Products, Inc. | 0,00 | -1,72 | 0,61 | -18,02 | 0,6231 | -0,0419 | |||
| AESI / Atlas Energy Solutions Inc. | 0,05 | -2,18 | 0,61 | -42,35 | 0,6228 | -0,3224 | |||
| SHO / Sunstone Hotel Investors, Inc. | 0,07 | -2,19 | 0,60 | -27,96 | 0,6114 | -0,1314 | |||
| GFF / Griffon Corporation | 0,01 | -1,73 | 0,59 | -11,64 | 0,6004 | 0,0058 | |||
| QNST / QuinStreet, Inc. | 0,03 | -1,72 | 0,59 | -27,25 | 0,5985 | -0,1209 | |||
| SLVM / Sylvamo Corporation | 0,01 | -2,20 | 0,59 | -27,23 | 0,5970 | -0,1204 | |||
| ITGR / Integer Holdings Corporation | 0,00 | -1,71 | 0,58 | -12,78 | 0,5888 | -0,0012 | |||
| MWA / Mueller Water Products, Inc. | 0,02 | 0,58 | 0,5838 | 0,5838 | |||||
| AVAV / AeroVironment, Inc. | 0,00 | -1,74 | 0,57 | -17,32 | 0,5813 | -0,0340 | |||
| OSIS / OSI Systems, Inc. | 0,00 | -1,73 | 0,57 | 2,51 | 0,5792 | 0,0845 | |||
| PAHC / Phibro Animal Health Corporation | 0,03 | -1,72 | 0,55 | -16,19 | 0,5623 | -0,0243 | |||
| VRRM / Verra Mobility Corporation | 0,03 | -1,72 | 0,55 | -18,77 | 0,5621 | -0,0436 | |||
| GEO / The GEO Group, Inc. | 0,02 | -1,72 | 0,55 | -2,30 | 0,5589 | 0,0578 | |||
| ESE / ESCO Technologies Inc. | 0,00 | -1,70 | 0,55 | 15,79 | 0,5584 | 0,1368 | |||
| ANIP / ANI Pharmaceuticals, Inc. | 0,01 | -1,73 | 0,54 | 18,56 | 0,5512 | 0,1449 | |||
| ITRI / Itron, Inc. | 0,00 | -1,71 | 0,54 | 1,88 | 0,5498 | 0,0777 | |||
| NMIH / NMI Holdings, Inc. | 0,01 | -1,72 | 0,54 | -7,92 | 0,5428 | 0,0269 | |||
| TILE / Interface, Inc. | 0,03 | -1,72 | 0,51 | -25,37 | 0,5131 | -0,0884 | |||
| EPAC / Enerpac Tool Group Corp. | 0,01 | -1,71 | 0,51 | -12,17 | 0,5127 | 0,0019 | |||
| NOG / Northern Oil and Gas, Inc. | 0,02 | -2,20 | 0,50 | -33,94 | 0,5114 | -0,1653 | |||
| VIRT / Virtu Financial, Inc. | 0,01 | -1,72 | 0,49 | -3,96 | 0,4926 | 0,0440 | |||
| FSS / Federal Signal Corporation | 0,01 | -1,73 | 0,48 | -18,64 | 0,4873 | -0,0364 | |||
| TDW / Tidewater Inc. | 0,01 | -1,73 | 0,48 | -35,54 | 0,4845 | -0,1723 | |||
| PRG / PROG Holdings, Inc. | 0,02 | -1,72 | 0,45 | -39,37 | 0,4512 | -0,2002 | |||
| EPRT / Essential Properties Realty Trust, Inc. | 0,01 | -1,72 | 0,44 | -1,57 | 0,4446 | 0,0497 | |||
| KDA / Kadant Inc. | 0,00 | 0,44 | 0,4412 | 0,4412 | |||||
| VCEL / Vericel Corporation | 0,01 | -1,73 | 0,43 | -36,21 | 0,4348 | -0,1611 | |||
| PLAY / Dave & Buster's Entertainment, Inc. | 0,02 | -1,72 | 0,42 | -28,98 | 0,4302 | -0,0998 | |||
| SKY / Champion Homes, Inc. | 0,00 | -1,73 | 0,42 | -8,06 | 0,4285 | 0,0214 | |||
| DOCN / DigitalOcean Holdings, Inc. | 0,01 | -1,72 | 0,42 | -26,86 | 0,4285 | -0,0835 | |||
| SFBS / ServisFirst Bancshares, Inc. | 0,01 | -1,07 | 0,42 | -22,37 | 0,4264 | -0,0536 | |||
| FTDR / Frontdoor, Inc. | 0,01 | -1,72 | 0,42 | -32,58 | 0,4222 | -0,1252 | |||
| CCOI / Cogent Communications Holdings, Inc. | 0,01 | -1,72 | 0,42 | -29,06 | 0,4212 | -0,0985 | |||
| CRY / Artivion Inc | 0,02 | -1,73 | 0,41 | -24,91 | 0,4197 | -0,0685 | |||
| AGYS / Agilysys, Inc. | 0,01 | -1,73 | 0,41 | -19,18 | 0,4196 | -0,0336 | |||
| GKOS / Glaukos Corporation | 0,00 | -1,06 | 0,40 | -40,41 | 0,4100 | -0,1917 | |||
| CARG / CarGurus, Inc. | 0,01 | -1,73 | 0,40 | -29,93 | 0,4041 | -0,1002 | |||
| MCRI / Monarch Casino & Resort, Inc. | 0,01 | -1,08 | 0,40 | -9,40 | 0,4011 | 0,0140 | |||
| APOG / Apogee Enterprises, Inc. | 0,01 | -1,73 | 0,39 | -23,52 | 0,3926 | -0,0569 | |||
| MOGA / Moog, Inc. - Class A | 0,00 | -1,72 | 0,37 | -9,51 | 0,3768 | 0,0125 | |||
| BOX / Box, Inc. | 0,01 | -1,07 | 0,37 | -7,48 | 0,3766 | 0,0204 | |||
| RCUS / Arcus Biosciences, Inc. | 0,04 | -1,06 | 0,37 | -32,90 | 0,3708 | -0,1125 | |||
| NXRT / NexPoint Residential Trust, Inc. | 0,01 | -1,06 | 0,36 | -6,54 | 0,3627 | 0,0231 | |||
| OUT / OUTFRONT Media Inc. | 0,02 | -1,04 | 0,35 | -18,56 | 0,3561 | -0,0267 | |||
| CURB / Curbline Properties Corp. | 0,01 | -1,06 | 0,34 | -7,32 | 0,3468 | 0,0190 | |||
| OII / Oceaneering International, Inc. | 0,02 | -1,06 | 0,34 | -29,25 | 0,3459 | -0,0823 | |||
| RDNT / RadNet, Inc. | 0,01 | -1,08 | 0,33 | -20,81 | 0,3360 | -0,0354 | |||
| BANF / BancFirst Corporation | 0,00 | -1,72 | 0,32 | -2,71 | 0,3277 | 0,0329 | |||
| IPAR / Interparfums, Inc. | 0,00 | -1,15 | 0,32 | -23,56 | 0,3230 | -0,0461 | |||
| CHCO / City Holding Company | 0,00 | -1,12 | 0,32 | -3,06 | 0,3221 | 0,0316 | |||
| PAYO / Payoneer Global Inc. | 0,04 | -1,06 | 0,28 | -34,35 | 0,2831 | -0,0943 | |||
| SPSC / SPS Commerce, Inc. | 0,00 | -1,73 | 0,27 | -23,65 | 0,2721 | -0,0396 | |||
| KTB / Kontoor Brands, Inc. | 0,00 | -1,72 | 0,25 | -35,77 | 0,2504 | -0,0900 | |||
| XPEL / XPEL, Inc. | 0,01 | -1,72 | 0,23 | -32,75 | 0,2355 | -0,0714 | |||
| SMTC / Semtech Corporation | 0,01 | -1,71 | 0,20 | -54,21 | 0,1991 | -0,1805 | |||
| US8252528851 / Invesco Government & Agency Portfolio, Institutional Class | 0,04 | -38,72 | 0,04 | -38,98 | 0,0371 | -0,0159 | |||
| ALK / Alaska Air Group, Inc. | 0,00 | -100,00 | 0,00 | -100,00 | -1,0955 | ||||
| US68218J3014 / OmniAb, Inc. | 0,00 | 0,00 | 0,00 | 0,0000 | 0,0000 | ||||
| US68218J2024 / OmniAb, Inc. | 0,00 | 0,00 | 0,00 | 0,0000 | 0,0000 | ||||
| HIMS / Hims & Hers Health, Inc. | 0,00 | -100,00 | 0,00 | -100,00 | -1,7501 | ||||
| NARI / Inari Medical, Inc. | 0,00 | -100,00 | 0,00 | -100,00 | -0,5511 |