Statistiques de base
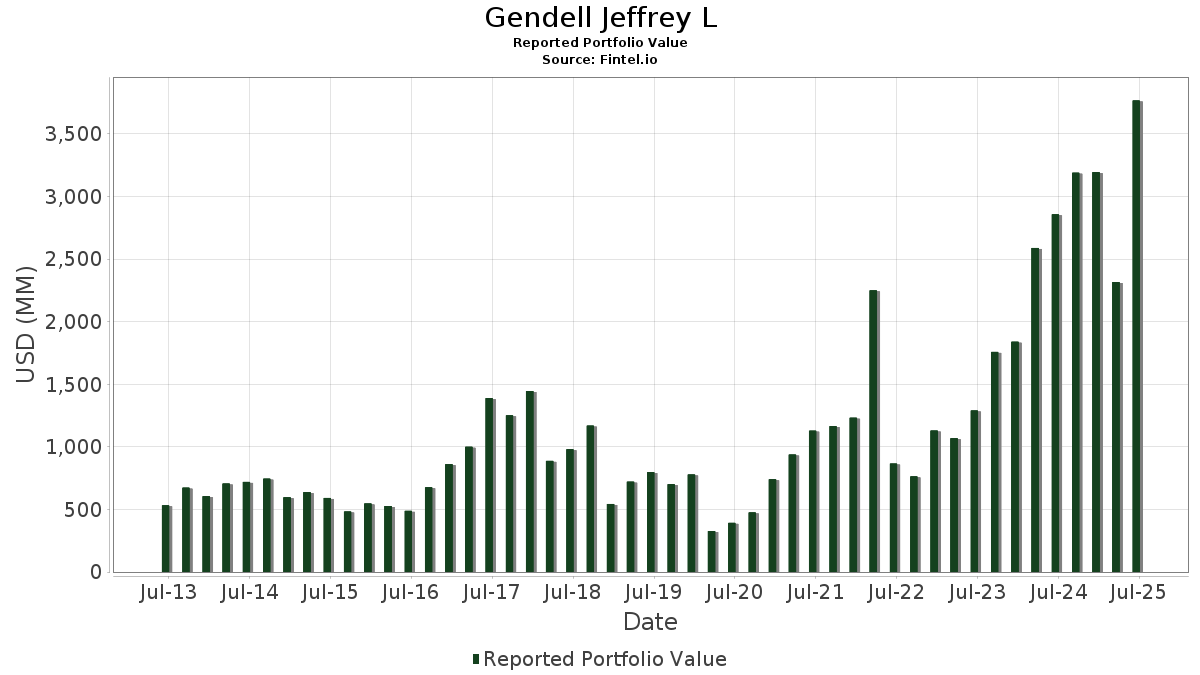
| Valeur du portefeuille | $ 3 766 390 852 |
| Positions actuelles | 77 |
Dernières positions, performances, ASG (à partir des dépôts 13F, 13D)
Gendell Jeffrey L a déclaré un total de 77 positions dans ses derniers dépôts auprès de la SEC. La valeur la plus récente du portefeuille est calculée à 3 766 390 852 USD. Les actifs sous gestion réels (ASG) sont cette valeur plus les liquidités (qui ne sont pas divulguées). Les principales positions de Gendell Jeffrey L sont IES Holdings, Inc. (US:IESC) , Avadel Pharmaceuticals plc (US:AVDL) , BlueLinx Holdings Inc. (US:BXC) , iShares Trust - iShares Russell 2000 ETF (US:IWM) , and Alpha Metallurgical Resources, Inc. (US:AMR) . Les nouvelles positions de Gendell Jeffrey L incluent Apple Inc. (US:AAPL) , Flex Ltd. (US:FLEX) , Innovex International, Inc. (US:INVX) , Tecogen Inc. (US:TGEN) , and . Les principales industries de Gendell Jeffrey L sont "Automotive Dealers And Gasoline Service Stations" (sic 55) , "Miscellaneous Retail " (sic 59) , and "Insurance Carriers" (sic 63) .
Meilleures augmentations ce trimestre
Nous utilisons la variation de l'allocation du portefeuille car il s'agit de l'indicateur le plus significatif. Les changements peuvent être dus à des transactions ou à des variations de prix des actions.
| Titre | Actions (en millions) |
Valeur ($ en millions) |
% du portefeuille | ΔPortefeuille % |
|---|---|---|---|---|
| 10,68 | 3 162,65 | 83,9704 | 7,5675 | |
| 0,15 | 20,45 | 0,5431 | 0,5431 | |
| 0,17 | 36,68 | 0,5404 | 0,5404 | |
| 0,05 | 10,26 | 0,2724 | 0,2724 | |
| 0,17 | 10,67 | 0,1571 | 0,1571 | |
| 0,02 | 7,28 | 0,1073 | 0,1073 | |
| 0,05 | 7,18 | 0,1906 | 0,0993 | |
| 0,07 | 6,46 | 0,0951 | 0,0951 | |
| 0,05 | 2,50 | 0,0663 | 0,0663 | |
| 0,15 | 4,22 | 0,0622 | 0,0622 |
Principales baisses ce trimestre
Nous utilisons la variation de l'allocation du portefeuille car il s'agit de l'indicateur le plus significatif. Les changements peuvent être dus à des transactions ou à des variations de prix des actions.
| Titre | Actions (en millions) |
Valeur ($ en millions) |
% du portefeuille | ΔPortefeuille % |
|---|---|---|---|---|
| 5,18 | 45,81 | 0,6749 | -1,3964 | |
| 0,56 | 41,93 | 0,6177 | -0,9453 | |
| 0,30 | 33,34 | 0,4911 | -0,7334 | |
| 0,35 | 4,64 | 0,0684 | -0,7209 | |
| 0,06 | 4,87 | 0,0717 | -0,6889 | |
| 0,14 | 31,13 | 0,4587 | -0,6766 | |
| 1,40 | 3,63 | 0,0534 | -0,5672 | |
| 0,12 | 12,06 | 0,1776 | -0,5493 | |
| 1,94 | 15,17 | 0,2234 | -0,5456 | |
| 0,29 | 8,26 | 0,1217 | -0,5170 |
Déclarations 13D/G
Il s'agit d'une liste des déclarations 13D et 13G déposées au cours de la dernière année (le cas échéant). Cliquez sur l'icône du lien pour voir l'historique complet des transactions. Les lignes vertes indiquent de nouvelles positions. Les lignes rouges indiquent des positions fermées.
| Date de dépôt | Formulaire | Titre | Actions précédentes |
Actions actuelles |
ΔActions % | % de participation |
% ΔParticipation | |
|---|---|---|---|---|---|---|---|---|
| 2025-08-14 | FRD / Friedman Industries, Incorporated | 453 129 | 354 576 | -21,75 | 5,00 | -23,08 | ||
| 2025-08-14 | KLXE / KLX Energy Services Holdings, Inc. | 1 526 795 | 1 693 219 | 10,90 | 9,50 | 2,04 | ||
| 2025-02-14 | NINE / Nine Energy Service, Inc. | 3 313 322 | 4 184 044 | 26,28 | 9,90 | 5,54 | ||
| 2024-11-13 | ASRV / AmeriServ Financial, Inc. | 1 246 113 | 1 572 987 | 26,23 | 9,52 | 30,95 | ||
| 2024-11-13 | FUSB / First US Bancshares, Inc. | 291 981 | 361 084 | 23,67 | 6,32 | 24,17 | ||
| 2024-11-13 | IROQ / IF Bancorp, Inc. | 272 040 | 326 382 | 19,98 | 9,73 | 19,98 |
Déclarations 13F et dépôts de fonds
Ce formulaire a été déposé le 2025-08-14 pour la période de déclaration 2025-06-30. Cliquez sur l'icône du lien pour voir l'historique complet des transactions.
Mettre à niveau pour débloquer les données premium et exporter vers Excel ![]() .
.
| Titre | Type | Prix moyen de l'action | Actions (en millions) |
ΔActions (%) |
ΔActions (%) |
Valeur ($ en millions) |
Portefeuille (%) |
ΔPortefeuille (%) |
|
|---|---|---|---|---|---|---|---|---|---|
| IESC / IES Holdings, Inc. | 10,68 | -0,39 | 3 162,65 | 78,72 | 83,9704 | 7,5675 | |||
| AVDL / Avadel Pharmaceuticals plc | 5,18 | -15,51 | 45,81 | -4,51 | 0,6749 | -1,3964 | |||
| BXC / BlueLinx Holdings Inc. | 0,56 | 16,76 | 41,93 | 15,82 | 0,6177 | -0,9453 | |||
| IWM / iShares Trust - iShares Russell 2000 ETF | 0,17 | 36,68 | 0,5404 | 0,5404 | |||||
| AMR / Alpha Metallurgical Resources, Inc. | 0,30 | 30,89 | 33,34 | 17,54 | 0,4911 | -0,7334 | |||
| OIH / VanEck ETF Trust - VanEck Oil Services ETF | 0,14 | 34,77 | 31,13 | 18,40 | 0,4587 | -0,6766 | |||
| MU / Micron Technology, Inc. | 0,17 | 116,88 | 20,58 | 207,65 | 0,3032 | 0,0144 | |||
| OC / Owens Corning | 0,15 | 20,45 | 0,5431 | 0,5431 | |||||
| SLB / Schlumberger Limited | 0,45 | 13,73 | 15,21 | -8,04 | 0,2241 | -0,4900 | |||
| LXU / LSB Industries, Inc. | 1,94 | -28,06 | 15,17 | -14,86 | 0,2234 | -0,5456 | |||
| INDV / Indivior PLC | 0,86 | 41,22 | 12,62 | 118,45 | 0,1860 | -0,0635 | |||
| TTI / TETRA Technologies, Inc. | 3,64 | -12,97 | 12,24 | -12,98 | 0,1803 | -0,4269 | |||
| MHK / Mohawk Industries, Inc. | 0,12 | -22,01 | 12,06 | -28,39 | 0,1776 | -0,5493 | |||
| SKY / Champion Homes, Inc. | 0,17 | 10,67 | 0,1571 | 0,1571 | |||||
| ATKR / Atkore Inc. | 0,15 | -24,76 | 10,59 | -11,52 | 0,1560 | -0,3607 | |||
| RBCAA / Republic Bancorp, Inc. | 0,14 | -2,59 | 10,45 | 11,60 | 0,1539 | -0,2503 | |||
| AAPL / Apple Inc. | 0,05 | 10,26 | 0,2724 | 0,2724 | |||||
| PATK / Patrick Industries, Inc. | 0,11 | 0,00 | 9,70 | 9,12 | 0,1428 | -0,2408 | |||
| OIS / Oil States International, Inc. | 1,61 | -4,11 | 8,62 | -0,20 | 0,1270 | -0,2458 | |||
| AMBC / Ambac Financial Group, Inc. | 1,20 | 98,98 | 8,51 | 61,44 | 0,1254 | -0,1022 | |||
| MTRX / Matrix Service Company | 0,61 | 2,90 | 8,30 | 11,83 | 0,1223 | -0,1982 | |||
| NBR / Nabors Industries Ltd. | 0,29 | -16,90 | 8,26 | -44,18 | 0,1217 | -0,5170 | |||
| IROQ / IF Bancorp, Inc. | 0,33 | -0,06 | 7,94 | 1,00 | 0,1170 | -0,2225 | |||
| XBI / SPDR Series Trust - SPDR S&P Biotech ETF | 0,09 | 137,55 | 7,65 | 142,92 | 0,1127 | -0,0233 | |||
| CNR / Core Natural Resources, Inc. | 0,11 | 87,71 | 7,50 | 69,81 | 0,1106 | -0,0803 | |||
| SNDK / Sandisk Corporation | 0,16 | 370,97 | 7,48 | 348,68 | 0,1101 | 0,0382 | |||
| CMI / Cummins Inc. | 0,02 | 7,28 | 0,1073 | 0,1073 | |||||
| AMD / Advanced Micro Devices, Inc. | 0,05 | 145,79 | 7,18 | 239,50 | 0,1906 | 0,0993 | |||
| LBRT / Liberty Energy Inc. | 0,59 | 23,47 | 6,76 | -10,47 | 0,0996 | -0,2263 | |||
| IOSP / Innospec Inc. | 0,08 | 3,28 | 6,71 | -8,35 | 0,0988 | -0,2172 | |||
| ODP / The ODP Corporation | 0,37 | -0,24 | 6,62 | 26,22 | 0,0975 | -0,1289 | |||
| CLB / Core Laboratories Inc. | 0,57 | 24,61 | 6,56 | -4,23 | 0,0966 | -0,1991 | |||
| UFPI / UFP Industries, Inc. | 0,07 | 6,46 | 0,0951 | 0,0951 | |||||
| GLW / Corning Incorporated | 0,12 | 500,00 | 6,31 | 589,62 | 0,0930 | 0,0534 | |||
| PEBK / Peoples Bancorp of North Carolina, Inc. | 0,22 | 0,00 | 6,28 | 5,92 | 0,0926 | -0,1635 | |||
| WDC / Western Digital Corporation | 0,10 | 111,11 | 6,08 | 234,19 | 0,0896 | 0,0110 | |||
| FRD / Friedman Industries, Incorporated | 0,35 | -17,80 | 5,87 | -8,59 | 0,0865 | -0,1908 | |||
| FUNC / First United Corporation | 0,18 | 0,00 | 5,53 | 3,29 | 0,0815 | -0,1497 | |||
| FMBH / First Mid Bancshares, Inc. | 0,14 | 0,00 | 5,15 | 7,42 | 0,0759 | -0,1312 | |||
| ALRS / Alerus Financial Corporation | 0,23 | -40,05 | 5,06 | -29,72 | 0,0745 | -0,2362 | |||
| ASRV / AmeriServ Financial, Inc. | 1,64 | 0,00 | 4,97 | 25,11 | 0,0733 | -0,0983 | |||
| FUSB / First US Bancshares, Inc. | 0,38 | 4,22 | 4,87 | 0,62 | 0,0718 | -0,1373 | |||
| MTRN / Materion Corporation | 0,06 | -58,91 | 4,87 | 5,71 | 0,0717 | -0,6889 | |||
| NOV / NOV Inc. | 0,39 | 49,66 | 4,82 | 22,24 | 0,0710 | -0,0993 | |||
| WTTR / Select Water Solutions, Inc. | 0,55 | -34,27 | 4,72 | -45,91 | 0,0695 | -0,3073 | |||
| BTU / Peabody Energy Corporation | 0,35 | -74,35 | 4,64 | -74,60 | 0,0684 | -0,7209 | |||
| COFS / ChoiceOne Financial Services, Inc. | 0,15 | -35,91 | 4,26 | -36,07 | 0,0628 | -0,2251 | |||
| WGO / Winnebago Industries, Inc. | 0,15 | 4,22 | 0,0622 | 0,0622 | |||||
| SND / Smart Sand, Inc. | 2,04 | 18,11 | 4,10 | -8,34 | 0,0604 | -0,1327 | |||
| TSEM / Tower Semiconductor Ltd. | 0,09 | 27,36 | 4,04 | 54,83 | 0,0595 | -0,0531 | |||
| DTI / Drilling Tools International Corporation | 1,41 | 20,87 | 4,03 | 45,35 | 0,0594 | -0,0603 | |||
| FCG / First Trust Exchange-Traded Fund - First Trust Natural Gas ETF | 0,16 | -57,83 | 3,70 | -60,78 | 0,0545 | -0,3526 | |||
| RIG / Transocean Ltd. | 1,40 | -69,13 | 3,63 | -74,77 | 0,0534 | -0,5672 | |||
| TILE / Interface, Inc. | 0,17 | 0,00 | 3,53 | 5,50 | 0,0520 | -0,0925 | |||
| CZWI / Citizens Community Bancorp, Inc. | 0,25 | -1,04 | 3,43 | -5,04 | 0,0505 | -0,1053 | |||
| NINE / Nine Energy Service, Inc. | 4,18 | -0,13 | 3,22 | -31,84 | 0,0475 | -0,1567 | |||
| KLXE / KLX Energy Services Holdings, Inc. | 1,69 | 1,20 | 3,17 | -45,94 | 0,0841 | -0,1688 | |||
| SLND / Southland Holdings, Inc. | 0,74 | 6,74 | 3,10 | 49,21 | 0,0457 | -0,0440 | |||
| PSCE / Invesco Exchange-Traded Fund Trust II - Invesco S&P SmallCap Energy ETF | 0,07 | -5,07 | 2,91 | -11,96 | 0,0429 | -0,0998 | |||
| COHR / Coherent Corp. | 0,03 | 0,00 | 2,80 | 37,40 | 0,0412 | -0,0467 | |||
| SXC / SunCoke Energy, Inc. | 0,29 | 7,02 | 2,51 | -0,04 | 0,0369 | -0,0714 | |||
| FLEX / Flex Ltd. | 0,05 | 2,50 | 0,0663 | 0,0663 | |||||
| CAC / Camden National Corporation | 0,06 | -49,41 | 2,49 | -49,28 | 0,0366 | -0,1750 | |||
| BW / Babcock & Wilcox Enterprises, Inc. | 2,57 | 49,25 | 2,48 | 113,53 | 0,0365 | -0,0136 | |||
| LUMN / Lumen Technologies, Inc. | 0,55 | 0,00 | 2,41 | 11,73 | 0,0355 | -0,0576 | |||
| BVFL / BV Financial, Inc. | 0,14 | 0,00 | 2,15 | -0,19 | 0,0317 | -0,0614 | |||
| SHBI / Shore Bancshares, Inc. | 0,14 | -51,72 | 2,15 | -43,94 | 0,0317 | -0,1340 | |||
| ORN / Orion Group Holdings, Inc. | 0,19 | -67,10 | 1,74 | -42,96 | 0,0256 | -0,1060 | |||
| FENC / Fennec Pharmaceuticals Inc. | 0,14 | -28,44 | 1,16 | -2,44 | 0,0171 | -0,0342 | |||
| BRBS / Blue Ridge Bankshares, Inc. | 0,31 | 11,12 | 1,12 | 22,40 | 0,0165 | -0,0230 | |||
| SBFG / SB Financial Group, Inc. | 0,05 | 0,00 | 0,88 | -8,20 | 0,0130 | -0,0286 | |||
| FRBA / First Bank | 0,05 | -15,21 | 0,76 | -11,36 | 0,0112 | -0,0257 | |||
| INVX / Innovex International, Inc. | 0,04 | 0,61 | 0,0163 | 0,0163 | |||||
| TGEN / Tecogen Inc. | 0,04 | 0,28 | 0,0075 | 0,0075 | |||||
| CIVB / Civista Bancshares, Inc. | 0,01 | 0,00 | 0,23 | 18,97 | 0,0034 | -0,0050 | |||
| OCC / Optical Cable Corporation | 0,07 | 51,00 | 0,20 | 57,60 | 0,0029 | -0,0025 | |||
| ASTL / Algoma Steel Group Inc. | 0,09 | 0,00 | 0,05 | 38,24 | 0,0007 | -0,0008 | |||
| EQT / EQT Corporation | 0,00 | -100,00 | 0,00 | 0,0000 | |||||
| IWN / iShares Trust - iShares Russell 2000 Value ETF | 0,00 | -100,00 | 0,00 | 0,0000 | |||||
| HP / Helmerich & Payne, Inc. | 0,00 | -100,00 | 0,00 | 0,0000 | |||||
| HBT / HBT Financial, Inc. | 0,00 | -100,00 | 0,00 | 0,0000 | |||||
| CMT / Core Molding Technologies, Inc. | 0,00 | -100,00 | 0,00 | 0,0000 | |||||
| KRE / SPDR Series Trust - SPDR S&P Regional Banking ETF | 0,00 | -100,00 | 0,00 | 0,0000 | |||||
| HWBK / Hawthorn Bancshares, Inc. | 0,00 | -100,00 | 0,00 | 0,0000 | |||||
| C / Citigroup Inc. | 0,00 | -100,00 | 0,00 | 0,0000 | |||||
| SDRL / Seadrill Limited | 0,00 | -100,00 | 0,00 | 0,0000 | |||||
| XLE / The Select Sector SPDR Trust - The Energy Select Sector SPDR Fund | 0,00 | -100,00 | 0,00 | -100,00 | -0,0799 | ||||
| HAL / Halliburton Company | 0,00 | -100,00 | 0,00 | 0,0000 | |||||
| BORR / Borr Drilling Limited | 0,00 | -100,00 | 0,00 | 0,0000 | |||||
| QXO / QXO, Inc. | 0,00 | -100,00 | 0,00 | 0,0000 |