Statistiques de base
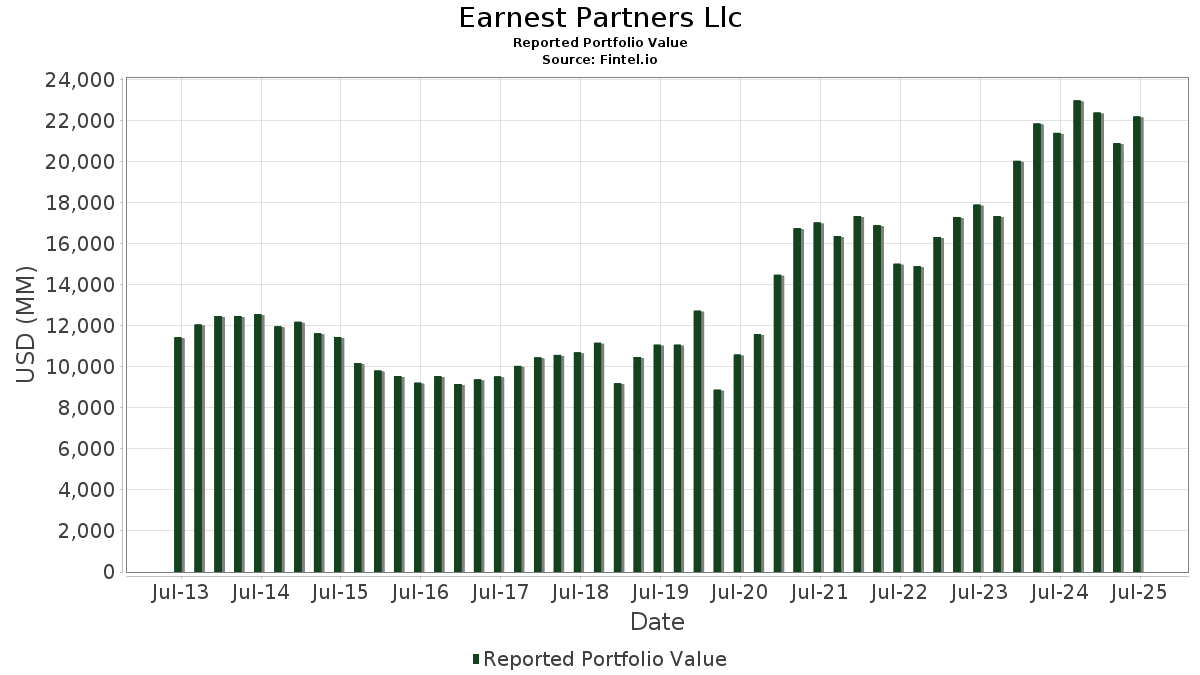
| Valeur du portefeuille | $ 22 184 345 280 |
| Positions actuelles | 292 |
Dernières positions, performances, ASG (à partir des dépôts 13F, 13D)
Earnest Partners Llc a déclaré un total de 292 positions dans ses derniers dépôts auprès de la SEC. La valeur la plus récente du portefeuille est calculée à 22 184 345 280 USD. Les actifs sous gestion réels (ASG) sont cette valeur plus les liquidités (qui ne sont pas divulguées). Les principales positions de Earnest Partners Llc sont CBRE Group, Inc. (US:CBRE) , Reinsurance Group of America, Incorporated (US:RGA) , GATX Corporation (US:GATX) , Houlihan Lokey, Inc. (US:HLI) , and Moog, Inc. - Class A (US:MOGA) . Les nouvelles positions de Earnest Partners Llc incluent Grupo Cibest S.A. - Depositary Receipt (Common Stock) (US:CIB) , Everus Construction Group, Inc. (US:ECG) , MRC Global Inc. (US:MRC) , . Les principales industries de Earnest Partners Llc sont "Agricultural Services" (sic 07) , "Metal Mining" (sic 10) , and "Coal Mining" (sic 12) .
Meilleures augmentations ce trimestre
Nous utilisons la variation de l'allocation du portefeuille car il s'agit de l'indicateur le plus significatif. Les changements peuvent être dus à des transactions ou à des variations de prix des actions.
| Titre | Actions (en millions) |
Valeur ($ en millions) |
% du portefeuille | ΔPortefeuille % |
|---|---|---|---|---|
| 2,49 | 115,24 | 0,5194 | 0,5194 | |
| 2,72 | 85,09 | 0,3835 | 0,3835 | |
| 6,10 | 82,07 | 0,3699 | 0,3699 | |
| 1,40 | 341,96 | 1,5414 | 0,3262 | |
| 1,10 | 70,13 | 0,3161 | 0,3161 | |
| 3,76 | 247,80 | 1,1170 | 0,3102 | |
| 1,62 | 214,90 | 0,9687 | 0,2203 | |
| 4,43 | 92,88 | 0,4187 | 0,2168 | |
| 0,31 | 45,04 | 0,2030 | 0,2030 | |
| 4,68 | 177,62 | 0,8007 | 0,1900 |
Principales baisses ce trimestre
Nous utilisons la variation de l'allocation du portefeuille car il s'agit de l'indicateur le plus significatif. Les changements peuvent être dus à des transactions ou à des variations de prix des actions.
| Titre | Actions (en millions) |
Valeur ($ en millions) |
% du portefeuille | ΔPortefeuille % |
|---|---|---|---|---|
| 2,40 | 476,32 | 2,1471 | -0,2226 | |
| 1,35 | 80,95 | 0,3649 | -0,2208 | |
| 1,10 | 270,08 | 1,2175 | -0,2063 | |
| 0,40 | 105,79 | 0,4768 | -0,2027 | |
| 0,96 | 297,86 | 1,3427 | -0,2000 | |
| 2,25 | 168,31 | 0,7587 | -0,1960 | |
| 3,23 | 242,21 | 1,0918 | -0,1942 | |
| 1,26 | 145,86 | 0,6575 | -0,1897 | |
| 3,24 | 49,17 | 0,2217 | -0,1803 | |
| 11,82 | 293,55 | 1,3232 | -0,1624 |
Déclarations 13D/G
Il s'agit d'une liste des déclarations 13D et 13G déposées au cours de la dernière année (le cas échéant). Cliquez sur l'icône du lien pour voir l'historique complet des transactions. Les lignes vertes indiquent de nouvelles positions. Les lignes rouges indiquent des positions fermées.
| Date de dépôt | Formulaire | Titre | Actions précédentes |
Actions actuelles |
ΔActions % | % de participation |
% ΔParticipation | |
|---|---|---|---|---|---|---|---|---|
| 2025-09-03 | OSUR / OraSure Technologies, Inc. | 4 871 379 | 795 | -99,98 | 0,00 | -100,00 | ||
| 2025-08-15 | CTS / CTS Corporation | 1 720 359 | 1 976 058 | 14,86 | 6,70 | 21,82 | ||
| 2025-08-15 | HXL / Hexcel Corporation | 4 517 986 | 5 140 542 | 13,78 | 6,50 | 20,37 | ||
| 2025-08-15 | CAKE / The Cheesecake Factory Incorporated | 2 815 127 | 2 388 181 | -15,17 | 4,80 | -12,73 | ||
| 2025-08-15 | SMG / The Scotts Miracle-Gro Company | 2 987 887 | 3 756 898 | 25,74 | 6,50 | 22,64 | ||
| 2025-08-15 | TRMK / Trustmark Corporation | 3 410 883 | 2 908 212 | -14,74 | 4,80 | -14,29 | ||
| 2025-08-15 | CBRL / Cracker Barrel Old Country Store, Inc. | 855 402 | 1 219 507 | 42,57 | 5,50 | 41,03 | ||
| 2025-05-15 | OII / Oceaneering International, Inc. | 5 166 012 | 4 217 394 | -18,36 | 4,20 | -17,65 | ||
| 2025-05-15 | PZZA / Papa John's International, Inc. | 2 562 079 | 1 538 853 | -39,94 | 4,70 | -40,51 | ||
| 2025-05-15 | HLI / Houlihan Lokey, Inc. | 3 230 161 | 2 648 908 | -17,99 | 4,90 | -20,97 | ||
| 2025-05-15 | EFSC / Enterprise Financial Services Corp | 1 940 420 | 1 848 381 | -4,74 | 5,00 | -3,85 | ||
| 2025-05-15 | HTLF / Heartland Financial USA, Inc. | 2 640 203 | 0 | -100,00 | 0,00 | -100,00 | ||
| 2025-05-15 | XPRO / Expro Group Holdings N.V. | 7 140 421 | 6,20 | |||||
| 2024-11-13 | BOX / Box, Inc. | 7 734 494 | 5,40 | |||||
| 2024-11-13 | CNMD / CONMED Corporation | 2 345 697 | 2 784 300 | 18,70 | 9,00 | 18,42 | ||
| 2024-11-13 | SABR / Sabre Corporation | 20 288 478 | 32 461 309 | 60,00 | 8,40 | 58,49 | ||
| 2024-11-13 | AROC / Archrock, Inc. | 13 656 564 | 13 027 341 | -4,61 | 7,40 | -15,91 | ||
| 2024-09-10 | DGII / Digi International Inc. | 1 822 883 | 1 890 336 | 3,70 | 5,20 | 4,00 | ||
| 2024-09-10 | UFCS / United Fire Group, Inc. | 1 310 309 | 1 260 893 | -3,77 | 5,00 | -3,85 | ||
| 2024-09-10 | DIOD / Diodes Incorporated | 2 456 093 | 2 147 972 | -12,55 | 4,60 | -13,21 |
Déclarations 13F et dépôts de fonds
Ce formulaire a été déposé le 2025-08-15 pour la période de déclaration 2025-06-30. Cliquez sur l'icône du lien pour voir l'historique complet des transactions.
Mettre à niveau pour débloquer les données premium et exporter vers Excel ![]() .
.
| Titre | Type | Prix moyen de l'action | Actions (en millions) |
ΔActions (%) |
ΔActions (%) |
Valeur ($ en millions) |
Portefeuille (%) |
ΔPortefeuille (%) |
|
|---|---|---|---|---|---|---|---|---|---|
| CBRE / CBRE Group, Inc. | 3,54 | -3,53 | 496,38 | 3,36 | 2,2375 | -0,0621 | |||
| RGA / Reinsurance Group of America, Incorporated | 2,40 | -4,46 | 476,32 | -3,76 | 2,1471 | -0,2226 | |||
| GATX / GATX Corporation | 3,09 | 0,03 | 473,92 | -1,07 | 2,1363 | -0,1575 | |||
| HLI / Houlihan Lokey, Inc. | 2,47 | -6,66 | 444,92 | 4,00 | 2,0056 | -0,0428 | |||
| MOGA / Moog, Inc. - Class A | 2,17 | -3,95 | 393,05 | 0,27 | 1,7717 | -0,1052 | |||
| RJF / Raymond James Financial, Inc. | 2,48 | -0,64 | 380,47 | 9,71 | 1,7150 | 0,0545 | |||
| WWD / Woodward, Inc. | 1,40 | 0,32 | 341,96 | 34,73 | 1,5414 | 0,3262 | |||
| DRI / Darden Restaurants, Inc. | 1,50 | -5,97 | 326,26 | -1,35 | 1,4707 | -0,1129 | |||
| FCFS / FirstCash Holdings, Inc. | 2,33 | -0,08 | 314,36 | 12,23 | 1,4171 | 0,0758 | |||
| SF / Stifel Financial Corp. | 2,92 | 0,17 | 303,16 | 10,29 | 1,3666 | 0,0503 | |||
| SNA / Snap-on Incorporated | 0,96 | 0,12 | 297,86 | -7,55 | 1,3427 | -0,2000 | |||
| R / Ryder System, Inc. | 1,87 | 0,23 | 297,64 | 10,82 | 1,3417 | 0,0556 | |||
| AROC / Archrock, Inc. | 11,82 | -0,01 | 293,55 | -5,39 | 1,3232 | -0,1624 | |||
| HXL / Hexcel Corporation | 5,14 | 8,86 | 290,39 | 12,30 | 1,3090 | 0,0708 | |||
| RSG / Republic Services, Inc. | 1,10 | -10,81 | 270,08 | -9,17 | 1,2175 | -0,2063 | |||
| BOX / Box, Inc. | 7,79 | 0,27 | 266,28 | 11,02 | 1,2003 | 0,0519 | |||
| SMG / The Scotts Miracle-Gro Company | 3,76 | 22,37 | 247,80 | 47,05 | 1,1170 | 0,3102 | |||
| CBT / Cabot Corporation | 3,23 | -0,03 | 242,21 | -9,82 | 1,0918 | -0,1942 | |||
| DHI / D.R. Horton, Inc. | 1,84 | 0,27 | 237,21 | 1,69 | 1,0693 | -0,0477 | |||
| ANSS / ANSYS, Inc. | 0,64 | 0,40 | 226,17 | 11,40 | 1,0195 | 0,0473 | |||
| HII / Huntington Ingalls Industries, Inc. | 0,90 | 0,11 | 216,13 | 18,46 | 0,9742 | 0,1007 | |||
| AEIS / Advanced Energy Industries, Inc. | 1,62 | -1,10 | 214,90 | 37,49 | 0,9687 | 0,2203 | |||
| FORM / FormFactor, Inc. | 6,09 | 0,56 | 209,53 | 22,32 | 0,9445 | 0,1243 | |||
| WEC / WEC Energy Group, Inc. | 1,98 | 0,30 | 206,65 | -4,10 | 0,9315 | -0,1002 | |||
| TDY / Teledyne Technologies Incorporated | 0,40 | -0,34 | 204,89 | 2,58 | 0,9236 | -0,0328 | |||
| CF / CF Industries Holdings, Inc. | 2,22 | 0,33 | 204,33 | 18,11 | 0,9211 | 0,0927 | |||
| QGEN / Qiagen N.V. | 4,20 | 10,39 | 201,96 | 32,14 | 0,9104 | 0,1786 | |||
| MIDD / The Middleby Corporation | 1,32 | 0,01 | 190,07 | -5,24 | 0,8568 | -0,1036 | |||
| SBAC / SBA Communications Corporation | 0,80 | 0,34 | 188,70 | 7,11 | 0,8506 | 0,0070 | |||
| ARW / Arrow Electronics, Inc. | 1,47 | 0,40 | 187,88 | 23,21 | 0,8469 | 0,1168 | |||
| AIN / Albany International Corp. | 2,66 | 0,36 | 186,21 | 1,94 | 0,8394 | -0,0352 | |||
| BXP / Boston Properties, Inc. | 2,66 | 0,52 | 179,58 | 0,94 | 0,8095 | -0,0424 | |||
| WTFC / Wintrust Financial Corporation | 1,43 | 1,64 | 177,78 | 12,06 | 0,8014 | 0,0417 | |||
| DAR / Darling Ingredients Inc. | 4,68 | 14,68 | 177,62 | 39,27 | 0,8007 | 0,1900 | |||
| FLEX / Flex Ltd. | 3,51 | -14,77 | 175,33 | 28,61 | 0,7903 | 0,1376 | |||
| AKAM / Akamai Technologies, Inc. | 2,20 | 0,67 | 175,24 | -0,26 | 0,7899 | -0,0513 | |||
| WBS / Webster Financial Corporation | 3,14 | -0,01 | 171,68 | 5,90 | 0,7739 | -0,0023 | |||
| EWBC / East West Bancorp, Inc. | 1,70 | 10,79 | 171,24 | 24,64 | 0,7719 | 0,1140 | |||
| UBSI / United Bankshares, Inc. | 4,63 | 9,75 | 168,51 | 15,32 | 0,7596 | 0,0599 | |||
| EMN / Eastman Chemical Company | 2,25 | -0,38 | 168,31 | -15,59 | 0,7587 | -0,1960 | |||
| ENTG / Entegris, Inc. | 2,05 | 21,00 | 165,10 | 11,56 | 0,7442 | 0,0356 | |||
| CNC / Centene Corporation | 2,97 | -0,51 | 161,25 | -11,05 | 0,7269 | -0,1412 | |||
| CHKP / Check Point Software Technologies Ltd. | 0,71 | 3,19 | 157,24 | 0,17 | 0,7088 | -0,0428 | |||
| SNPS / Synopsys, Inc. | 0,30 | -0,35 | 154,24 | 19,13 | 0,6953 | 0,0753 | |||
| CRL / Charles River Laboratories International, Inc. | 1,00 | -0,63 | 151,47 | 0,17 | 0,6828 | -0,0413 | |||
| AL / Air Lease Corporation | 2,58 | 0,38 | 150,89 | 21,53 | 0,6802 | 0,0857 | |||
| UMBF / UMB Financial Corporation | 1,43 | 0,07 | 150,25 | 4,09 | 0,6773 | -0,0139 | |||
| CAKE / The Cheesecake Factory Incorporated | 2,39 | -10,76 | 149,64 | 14,92 | 0,6745 | 0,0510 | |||
| MPWR / Monolithic Power Systems, Inc. | 0,20 | 0,01 | 148,57 | 26,12 | 0,6697 | 0,1056 | |||
| MAS / Masco Corporation | 2,31 | 0,13 | 148,53 | -7,32 | 0,6695 | -0,0979 | |||
| CNMD / CONMED Corporation | 2,83 | 1,08 | 147,38 | -12,83 | 0,6644 | -0,1452 | |||
| BIO / Bio-Rad Laboratories, Inc. | 0,61 | 1,04 | 146,21 | 0,12 | 0,6591 | -0,0402 | |||
| SPXC / SPX Technologies, Inc. | 0,87 | -13,54 | 146,00 | 12,58 | 0,6581 | 0,0372 | |||
| CWST / Casella Waste Systems, Inc. | 1,26 | -20,33 | 145,86 | -17,57 | 0,6575 | -0,1897 | |||
| PSN / Parsons Corporation | 2,03 | 0,26 | 145,53 | 21,53 | 0,6560 | 0,0826 | |||
| FLS / Flowserve Corporation | 2,75 | 0,27 | 143,91 | 7,48 | 0,6487 | 0,0076 | |||
| ICE / Intercontinental Exchange, Inc. | 0,77 | 0,51 | 141,96 | 6,90 | 0,6399 | 0,0040 | |||
| ITGR / Integer Holdings Corporation | 1,15 | 0,30 | 140,83 | 4,52 | 0,6348 | -0,0104 | |||
| RNR / RenaissanceRe Holdings Ltd. | 0,58 | 0,15 | 140,73 | 1,36 | 0,6344 | -0,0304 | |||
| CRUS / Cirrus Logic, Inc. | 1,34 | -0,20 | 139,49 | 4,41 | 0,6288 | -0,0109 | |||
| IBN / ICICI Bank Limited - Depositary Receipt (Common Stock) | 4,13 | -1,52 | 139,09 | 5,10 | 0,6270 | -0,0067 | |||
| STAG / STAG Industrial, Inc. | 3,81 | -0,22 | 138,31 | 0,22 | 0,6234 | -0,0373 | |||
| AOS / A. O. Smith Corporation | 2,05 | 0,16 | 134,21 | 0,48 | 0,6050 | -0,0346 | |||
| CCL / Carnival Corporation & plc | 4,77 | 4,19 | 134,13 | 50,02 | 0,6046 | 0,1765 | |||
| BWA / BorgWarner Inc. | 3,95 | 1,08 | 132,30 | 18,12 | 0,5964 | 0,0601 | |||
| WEX / WEX Inc. | 0,90 | 0,26 | 131,87 | -6,20 | 0,5944 | -0,0788 | |||
| CDP / COPT Defense Properties | 4,76 | 0,66 | 131,25 | 1,80 | 0,5916 | -0,0257 | |||
| SSB / SouthState Corporation | 1,41 | 0,22 | 129,91 | -0,63 | 0,5856 | -0,0404 | |||
| VMI / Valmont Industries, Inc. | 0,39 | 0,19 | 128,21 | 14,65 | 0,5779 | 0,0425 | |||
| HOLX / Hologic, Inc. | 1,88 | 0,88 | 122,78 | 6,42 | 0,5535 | 0,0010 | |||
| FELE / Franklin Electric Co., Inc. | 1,29 | -12,29 | 115,77 | -16,16 | 0,5218 | -0,1393 | |||
| SON / Sonoco Products Company | 2,65 | -0,34 | 115,27 | -8,11 | 0,5196 | -0,0810 | |||
| CIB / Grupo Cibest S.A. - Depositary Receipt (Common Stock) | 2,49 | 115,24 | 0,5194 | 0,5194 | |||||
| UCB / United Community Banks, Inc. | 3,85 | 11,63 | 114,82 | 18,22 | 0,5176 | 0,0525 | |||
| ON / ON Semiconductor Corporation | 2,04 | 1,96 | 106,90 | 31,32 | 0,4819 | 0,0921 | |||
| TRMK / Trustmark Corporation | 2,91 | -10,55 | 106,03 | -5,45 | 0,4780 | -0,0590 | |||
| PGR / The Progressive Corporation | 0,40 | -20,95 | 105,79 | -25,46 | 0,4768 | -0,2027 | |||
| MTH / Meritage Homes Corporation | 1,55 | 14,29 | 103,53 | 7,99 | 0,4667 | 0,0076 | |||
| NVS / Novartis AG - Depositary Receipt (Common Stock) | 0,85 | 3,13 | 102,88 | 11,95 | 0,4638 | 0,0237 | |||
| AIR / AAR Corp. | 1,50 | -0,31 | 102,88 | 22,48 | 0,4638 | 0,0615 | |||
| VNO / Vornado Realty Trust | 2,66 | -0,32 | 101,63 | 3,04 | 0,4581 | -0,0141 | |||
| PLXS / Plexus Corp. | 0,75 | 0,30 | 101,05 | 5,92 | 0,4555 | -0,0013 | |||
| SANM / Sanmina Corporation | 1,03 | -0,93 | 100,45 | 27,23 | 0,4528 | 0,0748 | |||
| EQNR / Equinor ASA - Depositary Receipt (Common Stock) | 3,95 | 3,03 | 99,22 | -2,07 | 0,4472 | -0,0379 | |||
| FRME / First Merchants Corporation | 2,57 | 0,38 | 98,50 | -4,93 | 0,4440 | -0,0521 | |||
| LFUS / Littelfuse, Inc. | 0,43 | 2,33 | 96,87 | 17,93 | 0,4366 | 0,0433 | |||
| CMI / Cummins Inc. | 0,30 | -0,12 | 96,75 | 4,36 | 0,4361 | -0,0078 | |||
| OGS / ONE Gas, Inc. | 1,32 | 0,30 | 95,17 | -4,65 | 0,4290 | -0,0489 | |||
| TKR / The Timken Company | 1,30 | 0,04 | 94,31 | 0,99 | 0,4251 | -0,0220 | |||
| ENS / EnerSys | 1,09 | -0,28 | 93,75 | -6,61 | 0,4226 | -0,0581 | |||
| SABR / Sabre Corporation | 29,58 | 0,85 | 93,48 | 13,41 | 0,4214 | 0,0267 | |||
| AMKR / Amkor Technology, Inc. | 4,43 | 89,53 | 92,88 | 120,28 | 0,4187 | 0,2168 | |||
| HDB / HDFC Bank Limited - Depositary Receipt (Common Stock) | 1,21 | -2,08 | 92,72 | 13,00 | 0,4180 | 0,0251 | |||
| EFSC / Enterprise Financial Services Corp | 1,66 | -10,26 | 91,40 | -7,99 | 0,4120 | -0,0636 | |||
| IQV / IQVIA Holdings Inc. | 0,57 | 29,98 | 90,52 | 16,18 | 0,4080 | 0,0350 | |||
| ALB / Albemarle Corporation | 1,42 | 0,55 | 89,16 | -12,50 | 0,4019 | -0,0860 | |||
| BR / Broadridge Financial Solutions, Inc. | 0,37 | 0,48 | 88,86 | 0,71 | 0,4006 | -0,0219 | |||
| WWW / Wolverine World Wide, Inc. | 4,91 | -6,82 | 88,79 | 21,11 | 0,4003 | 0,0492 | |||
| OII / Oceaneering International, Inc. | 4,22 | 0,05 | 87,43 | -4,95 | 0,3941 | -0,0463 | |||
| LH / Labcorp Holdings Inc. | 0,33 | 0,49 | 87,02 | 13,35 | 0,3922 | 0,0247 | |||
| ICLR / ICON Public Limited Company | 0,59 | 3,15 | 86,44 | -14,27 | 0,3896 | -0,0931 | |||
| AUB / Atlantic Union Bankshares Corporation | 2,72 | 85,09 | 0,3835 | 0,3835 | |||||
| CTS / CTS Corporation | 1,98 | 20,52 | 84,20 | 23,60 | 0,3795 | 0,0534 | |||
| RIO / Rio Tinto Group - Depositary Receipt (Common Stock) | 1,41 | 3,03 | 82,49 | 0,03 | 0,3718 | -0,0230 | |||
| AVTR / Avantor, Inc. | 6,10 | 82,07 | 0,3699 | 0,3699 | |||||
| EG / Everest Group, Ltd. | 0,24 | 3,13 | 81,58 | -3,54 | 0,3677 | -0,0372 | |||
| NSP / Insperity, Inc. | 1,35 | -1,77 | 80,95 | -33,82 | 0,3649 | -0,2208 | |||
| AVT / Avnet, Inc. | 1,52 | -0,25 | 80,48 | 10,10 | 0,3628 | 0,0128 | |||
| FCPT / Four Corners Property Trust, Inc. | 2,98 | -2,35 | 80,31 | -8,44 | 0,3620 | -0,0580 | |||
| BPOP / Popular, Inc. | 0,72 | -0,33 | 79,65 | 18,93 | 0,3591 | 0,0384 | |||
| ULTA / Ulta Beauty, Inc. | 0,17 | 17,84 | 79,36 | 50,41 | 0,3577 | 0,1051 | |||
| PZZA / Papa John's International, Inc. | 1,62 | 5,08 | 79,13 | 25,18 | 0,3567 | 0,0540 | |||
| KEYS / Keysight Technologies, Inc. | 0,48 | 0,84 | 78,16 | 10,33 | 0,3523 | 0,0131 | |||
| AYI / Acuity Inc. | 0,26 | -0,43 | 78,01 | 12,80 | 0,3516 | 0,0205 | |||
| CSX / CSX Corporation | 2,36 | 1,07 | 76,98 | 12,06 | 0,3470 | 0,0181 | |||
| SEE / Sealed Air Corporation | 2,47 | 0,66 | 76,61 | 8,08 | 0,3453 | 0,0059 | |||
| PNFP / Pinnacle Financial Partners, Inc. | 0,69 | -0,32 | 76,31 | 3,79 | 0,3440 | -0,0081 | |||
| DOV / Dover Corporation | 0,41 | 0,82 | 75,21 | 5,15 | 0,3390 | -0,0035 | |||
| CBRL / Cracker Barrel Old Country Store, Inc. | 1,22 | 45,52 | 74,49 | 128,97 | 0,3358 | 0,1800 | |||
| COR / Cencora, Inc. | 0,24 | -17,16 | 72,17 | -10,68 | 0,3253 | -0,0615 | |||
| SWKS / Skyworks Solutions, Inc. | 0,96 | 50,06 | 71,52 | 73,02 | 0,3224 | 0,1245 | |||
| NXT / Nextracker Inc. | 1,30 | -0,44 | 70,88 | 28,45 | 0,3195 | 0,0553 | |||
| ECG / Everus Construction Group, Inc. | 1,10 | 70,13 | 0,3161 | 0,3161 | |||||
| TJX / The TJX Companies, Inc. | 0,57 | 0,77 | 69,93 | 2,17 | 0,3152 | -0,0125 | |||
| PFGC / Performance Food Group Company | 0,80 | -0,43 | 69,90 | 10,77 | 0,3151 | 0,0129 | |||
| ATO / Atmos Energy Corporation | 0,45 | -0,36 | 69,26 | -0,66 | 0,3122 | -0,0216 | |||
| SYY / Sysco Corporation | 0,91 | 0,06 | 69,15 | 0,99 | 0,3117 | -0,0161 | |||
| MUR / Murphy Oil Corporation | 3,06 | 0,41 | 68,95 | -20,45 | 0,3108 | -0,1042 | |||
| DGII / Digi International Inc. | 1,95 | -0,91 | 68,14 | 24,13 | 0,3071 | 0,0443 | |||
| BBD / Banco Bradesco S.A. - Depositary Receipt (Common Stock) | 21,56 | -1,41 | 66,61 | 36,62 | 0,3003 | 0,0668 | |||
| ROST / Ross Stores, Inc. | 0,52 | 2,07 | 65,93 | 1,90 | 0,2972 | -0,0126 | |||
| TNET / TriNet Group, Inc. | 0,90 | -0,53 | 65,50 | -8,19 | 0,2953 | -0,0464 | |||
| FANG / Diamondback Energy, Inc. | 0,46 | -0,42 | 63,41 | -14,42 | 0,2858 | -0,0690 | |||
| XPRO / Expro Group Holdings N.V. | 7,20 | 0,87 | 61,87 | -12,83 | 0,2789 | -0,0610 | |||
| TSM / Taiwan Semiconductor Manufacturing Company Limited - Depositary Receipt (Common Stock) | 0,27 | 1,59 | 60,74 | 38,62 | 0,2738 | 0,0640 | |||
| DIOD / Diodes Incorporated | 1,14 | 1,08 | 60,56 | 23,84 | 0,2730 | 0,0388 | |||
| GPN / Global Payments Inc. | 0,74 | -0,31 | 59,20 | -18,51 | 0,2669 | -0,0810 | |||
| EGP / EastGroup Properties, Inc. | 0,35 | -0,95 | 59,20 | -6,03 | 0,2668 | -0,0348 | |||
| WSBC / WesBanco, Inc. | 1,84 | -0,92 | 58,27 | 1,22 | 0,2627 | -0,0130 | |||
| BIDU / Baidu, Inc. - Depositary Receipt (Common Stock) | 0,67 | -0,12 | 57,63 | -6,92 | 0,2598 | -0,0367 | |||
| A / Agilent Technologies, Inc. | 0,49 | 0,86 | 57,50 | 1,75 | 0,2592 | -0,0114 | |||
| AMAT / Applied Materials, Inc. | 0,31 | 0,95 | 56,56 | 27,35 | 0,2550 | 0,0423 | |||
| GD / General Dynamics Corporation | 0,19 | 0,87 | 55,93 | 7,93 | 0,2521 | 0,0040 | |||
| HMN / Horace Mann Educators Corporation | 1,30 | -0,02 | 55,85 | 0,54 | 0,2518 | -0,0142 | |||
| SNDR / Schneider National, Inc. | 2,20 | -0,19 | 53,20 | 5,48 | 0,2398 | -0,0017 | |||
| PENN / PENN Entertainment, Inc. | 2,94 | 0,29 | 52,59 | 9,88 | 0,2371 | 0,0079 | |||
| PKG / Packaging Corporation of America | 0,28 | 0,92 | 51,83 | -3,96 | 0,2336 | -0,0248 | |||
| PEB / Pebblebrook Hotel Trust | 5,17 | 2,32 | 51,69 | 0,91 | 0,2330 | -0,0123 | |||
| NOV / NOV Inc. | 4,03 | -1,76 | 50,09 | -19,77 | 0,2258 | -0,0731 | |||
| HP / Helmerich & Payne, Inc. | 3,24 | 0,93 | 49,17 | -41,42 | 0,2217 | -0,1803 | |||
| CTRA / Coterra Energy Inc. | 1,87 | 0,81 | 47,45 | -11,47 | 0,2139 | -0,0427 | |||
| ST / Sensata Technologies Holding plc | 1,56 | 0,80 | 46,87 | 25,06 | 0,2113 | 0,0318 | |||
| RRX / Regal Rexnord Corporation | 0,31 | 45,04 | 0,2030 | 0,2030 | |||||
| COLD / Americold Realty Trust, Inc. | 2,60 | 0,19 | 43,24 | -22,36 | 0,1949 | -0,0718 | |||
| LKQ / LKQ Corporation | 1,16 | -0,50 | 42,96 | -13,44 | 0,1937 | -0,0440 | |||
| CLB / Core Laboratories Inc. | 3,60 | -0,75 | 41,51 | -23,73 | 0,1871 | -0,0735 | |||
| PBR / Petróleo Brasileiro S.A. - Petrobras - Depositary Receipt (Common Stock) | 3,21 | -1,12 | 40,11 | -13,74 | 0,1808 | -0,0418 | |||
| BBWI / Bath & Body Works, Inc. | 1,29 | -1,07 | 38,77 | -2,25 | 0,1747 | -0,0151 | |||
| RCL / Royal Caribbean Cruises Ltd. | 0,12 | -0,38 | 38,69 | 51,85 | 0,1744 | 0,0524 | |||
| SQM / Sociedad Química y Minera de Chile S.A. - Depositary Receipt (Common Stock) | 1,05 | -4,14 | 37,06 | -14,90 | 0,1670 | -0,0415 | |||
| ASX / ASE Technology Holding Co., Ltd. - Depositary Receipt (Common Stock) | 3,53 | 8,52 | 36,51 | 27,97 | 0,1646 | 0,0280 | |||
| ARE / Alexandria Real Estate Equities, Inc. | 0,49 | -2,20 | 35,92 | -23,22 | 0,1619 | -0,0621 | |||
| CHX / ChampionX Corporation | 1,20 | 0,37 | 29,87 | -16,34 | 0,1346 | -0,0363 | |||
| FDS / FactSet Research Systems Inc. | 0,06 | -2,16 | 28,41 | -3,74 | 0,1281 | -0,0133 | |||
| NICE / NICE Ltd. - Depositary Receipt (Common Stock) | 0,15 | -0,13 | 24,62 | 9,42 | 0,1110 | 0,0032 | |||
| OKE / ONEOK, Inc. | 0,27 | -0,44 | 22,41 | -18,09 | 0,1010 | -0,0300 | |||
| HELE / Helen of Troy Limited | 0,77 | -1,19 | 21,90 | -47,57 | 0,0987 | -0,1013 | |||
| XRAY / DENTSPLY SIRONA Inc. | 1,26 | 1,20 | 20,04 | 7,57 | 0,0903 | 0,0011 | |||
| INTU / Intuit Inc. | 0,02 | -4,51 | 17,08 | 22,50 | 0,0770 | 0,0102 | |||
| FBK / FB Financial Corporation | 0,35 | -2,67 | 15,90 | -4,89 | 0,0717 | -0,0084 | |||
| OZK / Bank OZK | 0,32 | 8,42 | 14,91 | 17,44 | 0,0672 | 0,0064 | |||
| ESS / Essex Property Trust, Inc. | 0,05 | -0,45 | 14,53 | -7,97 | 0,0655 | -0,0101 | |||
| HES / Hess Corporation | 0,10 | -0,93 | 13,64 | -14,08 | 0,0615 | -0,0145 | |||
| KE / Kimball Electronics, Inc. | 0,68 | -1,94 | 13,04 | 14,64 | 0,0588 | 0,0043 | |||
| MS / Morgan Stanley | 0,08 | -6,02 | 11,85 | 13,46 | 0,0534 | 0,0034 | |||
| JPM / JPMorgan Chase & Co. | 0,04 | -3,73 | 11,46 | 13,77 | 0,0516 | 0,0034 | |||
| GS / The Goldman Sachs Group, Inc. | 0,02 | -4,94 | 10,77 | 23,15 | 0,0486 | 0,0067 | |||
| HCKT / The Hackett Group, Inc. | 0,42 | -2,64 | 10,67 | -15,30 | 0,0481 | -0,0122 | |||
| VXF / Vanguard Index Funds - Vanguard Extended Market ETF | 0,05 | -38,68 | 10,53 | -31,40 | 0,0475 | -0,0260 | |||
| SCS / Steelcase Inc. | 1,01 | -2,84 | 10,52 | -7,54 | 0,0474 | -0,0071 | |||
| WSFS / WSFS Financial Corporation | 0,18 | -33,71 | 10,10 | -29,71 | 0,0455 | -0,0233 | |||
| STBA / S&T Bancorp, Inc. | 0,25 | -3,09 | 9,41 | -1,08 | 0,0424 | -0,0031 | |||
| ADSK / Autodesk, Inc. | 0,03 | -4,93 | 8,71 | 12,43 | 0,0393 | 0,0022 | |||
| LXFR / Luxfer Holdings PLC | 0,71 | -3,25 | 8,71 | -0,64 | 0,0392 | -0,0027 | |||
| VIAV / Viavi Solutions Inc. | 0,86 | -0,55 | 8,67 | -10,51 | 0,0391 | -0,0073 | |||
| IWS / iShares Trust - iShares Russell Mid-Cap Value ETF | 0,06 | -8,04 | 8,54 | -3,54 | 0,0385 | -0,0039 | |||
| HUM / Humana Inc. | 0,03 | -3,37 | 8,48 | -10,71 | 0,0382 | -0,0072 | |||
| OXM / Oxford Industries, Inc. | 0,21 | 34,24 | 8,29 | -7,90 | 0,0374 | -0,0057 | |||
| NSC / Norfolk Southern Corporation | 0,03 | -6,27 | 8,19 | 1,31 | 0,0369 | -0,0018 | |||
| XP / XP Inc. | 0,39 | -21,72 | 7,97 | 15,00 | 0,0359 | 0,0027 | |||
| ATRO / Astronics Corporation | 0,24 | -55,25 | 7,92 | -38,02 | 0,0357 | -0,0255 | |||
| UNP / Union Pacific Corporation | 0,03 | -4,55 | 7,64 | -7,04 | 0,0345 | -0,0049 | |||
| CNOB / ConnectOne Bancorp, Inc. | 0,33 | -3,25 | 7,60 | -7,83 | 0,0343 | -0,0052 | |||
| TFIN / Triumph Financial, Inc. | 0,13 | 27,41 | 7,25 | 21,48 | 0,0327 | 0,0041 | |||
| DIS / The Walt Disney Company | 0,05 | -5,49 | 6,60 | 18,76 | 0,0297 | 0,0031 | |||
| DENN / Denny's Corporation | 1,56 | 0,16 | 6,41 | 11,89 | 0,0289 | 0,0015 | |||
| ITUB / Itaú Unibanco Holding S.A. - Depositary Receipt (Common Stock) | 0,88 | -39,24 | 5,98 | -24,99 | 0,0270 | -0,0112 | |||
| TRN / Trinity Industries, Inc. | 0,22 | 5,84 | 0,0263 | 0,0263 | |||||
| UFCS / United Fire Group, Inc. | 0,20 | -3,95 | 5,74 | -6,42 | 0,0259 | -0,0035 | |||
| SLB / Schlumberger Limited | 0,16 | -6,02 | 5,36 | -24,00 | 0,0241 | -0,0096 | |||
| JACK / Jack in the Box Inc. | 0,30 | -15,62 | 5,16 | -45,81 | 0,0233 | -0,0223 | |||
| TTGT / TechTarget, Inc. | 0,66 | -3,69 | 5,14 | -49,48 | 0,0232 | -0,0255 | |||
| XOP / SPDR Series Trust - SPDR S&P Oil & Gas Exploration & Production ETF | 0,04 | 0,00 | 5,04 | -4,49 | 0,0227 | -0,0025 | |||
| QSR / Restaurant Brands International Inc. | 0,07 | -7,13 | 4,96 | -7,60 | 0,0223 | -0,0033 | |||
| UNH / UnitedHealth Group Incorporated | 0,02 | -5,96 | 4,82 | -43,99 | 0,0217 | -0,0195 | |||
| IWN / iShares Trust - iShares Russell 2000 Value ETF | 0,03 | -13,43 | 4,52 | -9,53 | 0,0204 | -0,0036 | |||
| BHP / BHP Group Limited - Depositary Receipt (Common Stock) | 0,09 | 7,38 | 4,38 | 6,38 | 0,0198 | 0,0000 | |||
| EC / Ecopetrol S.A. - Depositary Receipt (Common Stock) | 0,44 | -3,13 | 3,93 | -17,88 | 0,0177 | -0,0052 | |||
| EEM / iShares, Inc. - iShares MSCI Emerging Markets ETF | 0,08 | -3,26 | 3,83 | 6,81 | 0,0172 | 0,0001 | |||
| WDS / Woodside Energy Group Ltd - Depositary Receipt (Common Stock) | 0,24 | 7,91 | 3,72 | 14,89 | 0,0168 | 0,0013 | |||
| RELX / RELX PLC - Depositary Receipt (Common Stock) | 0,06 | -3,80 | 3,23 | 3,70 | 0,0145 | -0,0004 | |||
| MRC / MRC Global Inc. | 0,23 | 3,19 | 0,0144 | 0,0144 | |||||
| MAX / MediaAlpha, Inc. | 0,27 | -1,04 | 2,95 | 17,28 | 0,0133 | 0,0013 | |||
| ERIC / Telefonaktiebolaget LM Ericsson (publ) - Depositary Receipt (Common Stock) | 0,34 | -6,36 | 2,87 | 2,32 | 0,0129 | -0,0005 | |||
| ADP / Automatic Data Processing, Inc. | 0,01 | 3,97 | 2,86 | 4,96 | 0,0129 | -0,0002 | |||
| YUMC / Yum China Holdings, Inc. | 0,06 | 2,68 | 2,85 | -11,80 | 0,0129 | -0,0026 | |||
| ELV / Elevance Health, Inc. | 0,01 | 3,38 | 2,67 | -7,54 | 0,0121 | -0,0018 | |||
| AMT / American Tower Corporation | 0,01 | 3,25 | 2,64 | 4,85 | 0,0119 | -0,0002 | |||
| GLW / Corning Incorporated | 0,05 | 4,34 | 2,61 | 19,86 | 0,0118 | 0,0013 | |||
| IWM / iShares Trust - iShares Russell 2000 ETF | 0,01 | -58,88 | 2,57 | -55,53 | 0,0116 | -0,0161 | |||
| BCS / Barclays PLC - Depositary Receipt (Common Stock) | 0,14 | -3,45 | 2,54 | 16,89 | 0,0115 | 0,0010 | |||
| INFY / Infosys Limited - Depositary Receipt (Common Stock) | 0,13 | 6,75 | 2,49 | 8,42 | 0,0112 | 0,0002 | |||
| ASML / ASML Holding N.V. - Depositary Receipt (Common Stock) | 0,00 | -3,40 | 2,37 | 16,83 | 0,0107 | 0,0010 | |||
| XOM / Exxon Mobil Corporation | 0,02 | 2,76 | 2,33 | -6,84 | 0,0105 | -0,0015 | |||
| SNN / Smith & Nephew plc - Depositary Receipt (Common Stock) | 0,07 | -1,09 | 2,17 | 6,78 | 0,0098 | 0,0001 | |||
| HSBC / HSBC Holdings plc - Depositary Receipt (Common Stock) | 0,03 | -3,45 | 2,11 | 2,17 | 0,0095 | -0,0004 | |||
| SONY / Sony Group Corporation - Depositary Receipt (Common Stock) | 0,08 | -3,78 | 2,09 | -1,37 | 0,0094 | -0,0007 | |||
| SHEL / Shell plc - Depositary Receipt (Common Stock) | 0,03 | -3,45 | 1,99 | -7,27 | 0,0090 | -0,0013 | |||
| UL / Unilever PLC - Depositary Receipt (Common Stock) | 0,03 | -3,45 | 1,97 | -0,86 | 0,0089 | -0,0006 | |||
| IWR / iShares Trust - iShares Russell Mid-Cap ETF | 0,02 | -42,00 | 1,93 | -37,30 | 0,0087 | -0,0060 | |||
| EWY / iShares, Inc. - iShares MSCI South Korea ETF | 0,03 | 0,00 | 1,83 | 32,82 | 0,0082 | 0,0017 | |||
| NVDA / NVIDIA Corporation | 0,01 | 0,00 | 1,79 | 45,77 | 0,0081 | 0,0022 | |||
| DUK / Duke Energy Corporation | 0,02 | 3,96 | 1,79 | 0,56 | 0,0081 | -0,0005 | |||
| MSFT / Microsoft Corporation | 0,00 | 0,00 | 1,78 | 32,56 | 0,0080 | 0,0016 | |||
| BAC / Bank of America Corporation | 0,04 | 4,81 | 1,72 | 18,92 | 0,0077 | 0,0008 | |||
| SO / The Southern Company | 0,02 | 4,29 | 1,70 | 4,16 | 0,0077 | -0,0002 | |||
| ABEV / Ambev S.A. - Depositary Receipt (Common Stock) | 0,68 | -6,80 | 1,65 | -3,62 | 0,0074 | -0,0008 | |||
| PPG / PPG Industries, Inc. | 0,01 | 5,80 | 1,53 | 10,11 | 0,0069 | 0,0002 | |||
| AAPL / Apple Inc. | 0,01 | 0,00 | 1,42 | -7,66 | 0,0064 | -0,0010 | |||
| OIH / VanEck ETF Trust - VanEck Oil Services ETF | 0,01 | 0,00 | 1,37 | -12,17 | 0,0062 | -0,0013 | |||
| CNI / Canadian National Railway Company | 0,01 | -7,19 | 1,28 | -0,93 | 0,0058 | -0,0004 | |||
| VTI / Vanguard Index Funds - Vanguard Total Stock Market ETF | 0,00 | -37,97 | 1,20 | -31,43 | 0,0054 | -0,0030 | |||
| EFA / iShares Trust - iShares MSCI EAFE ETF | 0,01 | 0,00 | 1,13 | 9,46 | 0,0051 | 0,0001 | |||
| AMD / Advanced Micro Devices, Inc. | 0,01 | -0,67 | 1,10 | 37,17 | 0,0049 | 0,0011 | |||
| BDX / Becton, Dickinson and Company | 0,01 | 7,55 | 1,09 | -19,14 | 0,0049 | -0,0015 | |||
| RTX / RTX Corporation | 0,01 | 18,38 | 1,07 | 30,41 | 0,0048 | 0,0009 | |||
| AMZN / Amazon.com, Inc. | 0,00 | 0,00 | 1,02 | 15,32 | 0,0046 | 0,0004 | |||
| HMC / Honda Motor Co., Ltd. - Depositary Receipt (Common Stock) | 0,03 | -3,44 | 1,00 | 2,66 | 0,0045 | -0,0002 | |||
| IHG / InterContinental Hotels Group PLC - Depositary Receipt (Common Stock) | 0,01 | 1,87 | 0,96 | 7,24 | 0,0043 | 0,0000 | |||
| IBM / International Business Machines Corporation | 0,00 | 10,26 | 0,95 | 30,67 | 0,0043 | 0,0008 | |||
| RCI / Rogers Communications Inc. | 0,03 | -2,14 | 0,89 | 8,56 | 0,0040 | 0,0001 | |||
| META / Meta Platforms, Inc. | 0,00 | 0,00 | 0,77 | 27,98 | 0,0035 | 0,0006 | |||
| ING / ING Groep N.V. - Depositary Receipt (Common Stock) | 0,03 | 16,13 | 0,76 | 29,57 | 0,0034 | 0,0006 | |||
| MGA / Magna International Inc. | 0,02 | -3,29 | 0,76 | 9,87 | 0,0034 | 0,0001 | |||
| PUK / Prudential plc - Depositary Receipt (Common Stock) | 0,03 | -3,44 | 0,74 | 12,29 | 0,0033 | 0,0002 | |||
| SAP / SAP SE - Depositary Receipt (Common Stock) | 0,00 | -16,27 | 0,68 | -5,06 | 0,0030 | -0,0004 | |||
| PHG / Koninklijke Philips N.V. - Depositary Receipt (Common Stock) | 0,03 | -9,08 | 0,66 | -14,21 | 0,0030 | -0,0007 | |||
| CEG / Constellation Energy Corporation | 0,00 | 0,00 | 0,64 | 60,05 | 0,0029 | 0,0010 | |||
| AFL / Aflac Incorporated | 0,01 | 15,58 | 0,57 | 9,60 | 0,0026 | 0,0001 | |||
| LHX / L3Harris Technologies, Inc. | 0,00 | 0,00 | 0,54 | 19,96 | 0,0024 | 0,0003 | |||
| KMB / Kimberly-Clark Corporation | 0,00 | 8,64 | 0,54 | -1,47 | 0,0024 | -0,0002 | |||
| STM / STMicroelectronics N.V. - Depositary Receipt (Common Stock) | 0,02 | 8,05 | 0,52 | 49,43 | 0,0024 | 0,0007 | |||
| AVGO / Broadcom Inc. | 0,00 | 0,00 | 0,52 | 64,56 | 0,0023 | 0,0008 | |||
| CB / Chubb Limited | 0,00 | 20,90 | 0,50 | 16,05 | 0,0023 | 0,0002 | |||
| GOOGL / Alphabet Inc. | 0,00 | 0,00 | 0,50 | 14,06 | 0,0022 | 0,0002 | |||
| NR / NPK International Inc. | 0,06 | -26,25 | 0,47 | 7,97 | 0,0021 | 0,0000 | |||
| TSLA / Tesla, Inc. | 0,00 | 0,00 | 0,47 | 22,69 | 0,0021 | 0,0003 | |||
| BA / The Boeing Company | 0,00 | 0,00 | 0,45 | 23,08 | 0,0020 | 0,0003 | |||
| BRK.B / Berkshire Hathaway Inc. | 0,00 | 0,00 | 0,43 | -8,88 | 0,0019 | -0,0003 | |||
| GOOG / Alphabet Inc. | 0,00 | 0,00 | 0,42 | 13,59 | 0,0019 | 0,0001 | |||
| UFPT / UFP Technologies, Inc. | 0,00 | 0,00 | 0,42 | 21,35 | 0,0019 | 0,0002 | |||
| NXPI / NXP Semiconductors N.V. | 0,00 | -3,28 | 0,37 | 11,01 | 0,0017 | 0,0001 | |||
| INTC / Intel Corporation | 0,02 | 15,31 | 0,36 | 13,88 | 0,0016 | 0,0001 | |||
| CMCSA / Comcast Corporation | 0,01 | 15,74 | 0,35 | 12,01 | 0,0016 | 0,0001 | |||
| LLY / Eli Lilly and Company | 0,00 | 0,00 | 0,34 | -5,56 | 0,0015 | -0,0002 | |||
| TRV / The Travelers Companies, Inc. | 0,00 | 0,00 | 0,32 | 1,28 | 0,0014 | -0,0001 | |||
| KR / The Kroger Co. | 0,00 | 40,23 | 0,30 | 48,51 | 0,0014 | 0,0004 | |||
| NSSC / Napco Security Technologies, Inc. | 0,01 | 0,00 | 0,29 | 29,55 | 0,0013 | 0,0002 | |||
| NTRS / Northern Trust Corporation | 0,00 | -75,09 | 0,28 | -68,03 | 0,0013 | -0,0029 | |||
| NFLX / Netflix, Inc. | 0,00 | 0,27 | 0,0012 | 0,0012 | |||||
| AX / Axos Financial, Inc. | 0,00 | 0,00 | 0,27 | 17,67 | 0,0012 | 0,0001 | |||
| V / Visa Inc. | 0,00 | 0,00 | 0,27 | 1,49 | 0,0012 | -0,0001 | |||
| OXY / Occidental Petroleum Corporation | 0,01 | 42,48 | 0,26 | 21,30 | 0,0012 | 0,0001 | |||
| SYF / Synchrony Financial | 0,00 | 0,25 | 0,0011 | 0,0011 | |||||
| COST / Costco Wholesale Corporation | 0,00 | 0,00 | 0,23 | 4,61 | 0,0010 | -0,0000 | |||
| MA / Mastercard Incorporated | 0,00 | 0,00 | 0,23 | 2,73 | 0,0010 | -0,0000 | |||
| TGT / Target Corporation | 0,00 | 0,00 | 0,22 | -5,58 | 0,0010 | -0,0001 | |||
| GJR / Strats Trust For Procter & Gambel Security - Preferred Security | 0,00 | 0,00 | 0,21 | -6,55 | 0,0010 | -0,0001 | |||
| EXC / Exelon Corporation | 0,00 | 0,00 | 0,21 | -5,91 | 0,0009 | -0,0001 | |||
| LYG / Lloyds Banking Group plc - Depositary Receipt (Common Stock) | 0,05 | 10,38 | 0,21 | 22,49 | 0,0009 | 0,0001 | |||
| MCHI / iShares Trust - iShares MSCI China ETF | 0,00 | 0,00 | 0,21 | 0,98 | 0,0009 | -0,0000 | |||
| ZYXI / Zynex, Inc. | 0,01 | 0,00 | 0,03 | 15,38 | 0,0001 | 0,0000 | |||
| VB / Vanguard Index Funds - Vanguard Small-Cap ETF | 0,00 | -100,00 | 0,00 | 0,0000 | |||||
| IJJ / iShares Trust - iShares S&P Mid-Cap 400 Value ETF | 0,00 | -100,00 | 0,00 | 0,0000 | |||||
| VO / Vanguard Index Funds - Vanguard Mid-Cap ETF | 0,00 | -100,00 | 0,00 | 0,0000 | |||||
| CIB / Grupo Cibest S.A. - Depositary Receipt (Common Stock) | 0,00 | -100,00 | 0,00 | 0,0000 | |||||
| MYGN / Myriad Genetics, Inc. | 0,00 | -100,00 | 0,00 | 0,0000 |