Statistiques de base
| Profil de l'initié | DIAMOND HILL CAPITAL MANAGEMENT INC |
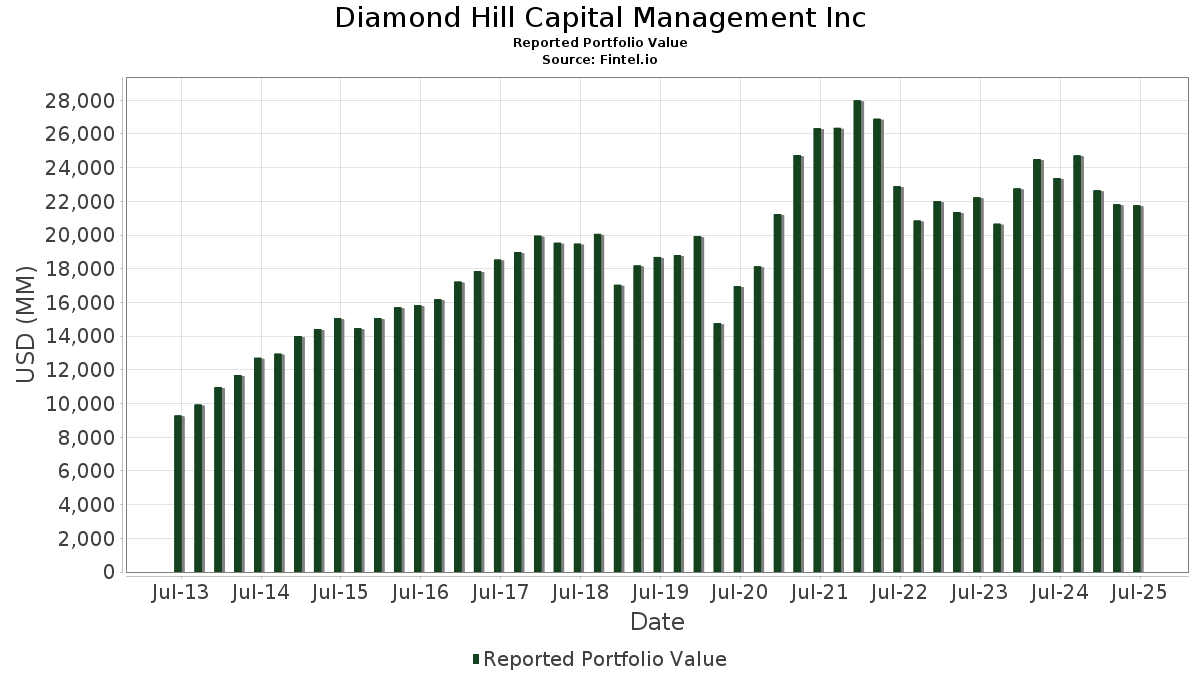
| Valeur du portefeuille | $ 21 756 185 234 |
| Positions actuelles | 180 |
Dernières positions, performances, ASG (à partir des dépôts 13F, 13D)
Diamond Hill Capital Management Inc a déclaré un total de 180 positions dans ses derniers dépôts auprès de la SEC. La valeur la plus récente du portefeuille est calculée à 21 756 185 234 USD. Les actifs sous gestion réels (ASG) sont cette valeur plus les liquidités (qui ne sont pas divulguées). Les principales positions de Diamond Hill Capital Management Inc sont American International Group, Inc. (US:AIG) , Abbott Laboratories (US:ABT) , Berkshire Hathaway Inc. (US:BRK.B) , Texas Instruments Incorporated (US:TXN) , and Capital One Financial Corporation (US:COF) . Les nouvelles positions de Diamond Hill Capital Management Inc incluent Adobe Inc. (US:ADBE) , Antero Resources Corporation (US:AR) , FTI Consulting, Inc. (US:FCN) , Knife River Corporation (US:KNF) , and Utz Brands, Inc. (US:UTZ) . Les principales industries de Diamond Hill Capital Management Inc sont "Motor Freight Transportation And Warehousing" (sic 42) , "Petroleum Refining And Related Industries" (sic 29) , and "Primary Metal Industries" (sic 33) .
Meilleures augmentations ce trimestre
Nous utilisons la variation de l'allocation du portefeuille car il s'agit de l'indicateur le plus significatif. Les changements peuvent être dus à des transactions ou à des variations de prix des actions.
| Titre | Actions (en millions) |
Valeur ($ en millions) |
% du portefeuille | ΔPortefeuille % |
|---|---|---|---|---|
| 0,85 | 328,69 | 1,5108 | 1,5108 | |
| 2,91 | 619,29 | 2,8465 | 1,0962 | |
| 3,56 | 739,60 | 3,3995 | 0,5654 | |
| 2,16 | 470,95 | 2,1647 | 0,5178 | |
| 3,13 | 388,37 | 1,7851 | 0,5108 | |
| 3,02 | 437,60 | 2,0114 | 0,4021 | |
| 1,57 | 561,72 | 2,5819 | 0,3636 | |
| 0,80 | 309,48 | 1,4225 | 0,3631 | |
| 1,62 | 354,56 | 1,6297 | 0,3063 | |
| 1,50 | 408,36 | 1,8770 | 0,2951 |
Principales baisses ce trimestre
Nous utilisons la variation de l'allocation du portefeuille car il s'agit de l'indicateur le plus significatif. Les changements peuvent être dus à des transactions ou à des variations de prix des actions.
| Titre | Actions (en millions) |
Valeur ($ en millions) |
% du portefeuille | ΔPortefeuille % |
|---|---|---|---|---|
| 0,15 | 26,56 | 0,1221 | -1,5603 | |
| 0,73 | 280,43 | 1,2890 | -0,6257 | |
| 5,43 | 487,72 | 2,2418 | -0,5943 | |
| 4,35 | 360,05 | 1,6549 | -0,5637 | |
| 7,31 | 359,94 | 1,6544 | -0,5262 | |
| 2,71 | 371,99 | 1,7098 | -0,4393 | |
| 1,49 | 349,64 | 1,6071 | -0,4067 | |
| 11,61 | 993,88 | 4,5683 | -0,3469 | |
| 10,33 | 488,82 | 2,2468 | -0,3149 | |
| 1,57 | 763,60 | 3,5098 | -0,2386 |
Déclarations 13D/G
Il s'agit d'une liste des déclarations 13D et 13G déposées au cours de la dernière année (le cas échéant). Cliquez sur l'icône du lien pour voir l'historique complet des transactions. Les lignes vertes indiquent de nouvelles positions. Les lignes rouges indiquent des positions fermées.
| Date de dépôt | Formulaire | Titre | Actions précédentes |
Actions actuelles |
ΔActions % | % de participation |
% ΔParticipation | |
|---|---|---|---|---|---|---|---|---|
| 2025-02-06 | ENOV / Enovis Corporation | 2 790 891 | 5,00 |
Déclarations 13F et dépôts de fonds
Ce formulaire a été déposé le 2025-08-12 pour la période de déclaration 2025-06-30. Cliquez sur l'icône du lien pour voir l'historique complet des transactions.
Mettre à niveau pour débloquer les données premium et exporter vers Excel ![]() .
.
| Titre | Type | Prix moyen de l'action | Actions (en millions) |
ΔActions (%) |
ΔActions (%) |
Valeur ($ en millions) |
Portefeuille (%) |
ΔPortefeuille (%) |
|
|---|---|---|---|---|---|---|---|---|---|
| AIG / American International Group, Inc. | 11,61 | -5,85 | 993,88 | -7,31 | 4,5683 | -0,3469 | |||
| ABT / Abbott Laboratories | 5,91 | -2,65 | 804,20 | -0,18 | 3,6964 | 0,0032 | |||
| BRK.B / Berkshire Hathaway Inc. | 1,57 | 2,38 | 763,60 | -6,62 | 3,5098 | -0,2386 | |||
| TXN / Texas Instruments Incorporated | 3,56 | 3,54 | 739,60 | 19,62 | 3,3995 | 0,5654 | |||
| COF / Capital One Financial Corporation | 2,91 | 36,68 | 619,29 | 62,18 | 2,8465 | 1,0962 | |||
| AON / Aon plc | 1,57 | 29,85 | 561,72 | 16,07 | 2,5819 | 0,3636 | |||
| SYY / Sysco Corporation | 7,02 | -4,48 | 532,00 | -3,59 | 2,4453 | -0,0842 | |||
| CL / Colgate-Palmolive Company | 5,50 | -1,05 | 500,38 | -4,00 | 2,3000 | -0,0894 | |||
| BAC / Bank of America Corporation | 10,33 | -22,86 | 488,82 | -12,53 | 2,2468 | -0,3149 | |||
| COP / ConocoPhillips | 5,43 | -7,75 | 487,72 | -21,17 | 2,2418 | -0,5943 | |||
| LH / Labcorp Holdings Inc. | 1,82 | -6,56 | 478,69 | 5,39 | 2,2002 | 0,1182 | |||
| FERG / Ferguson Enterprises Inc. | 2,16 | -3,54 | 470,95 | 31,08 | 2,1647 | 0,5178 | |||
| KMX / CarMax, Inc. | 6,96 | 18,82 | 467,91 | 2,49 | 2,1507 | 0,0580 | |||
| UNP / Union Pacific Corporation | 1,94 | 4,62 | 445,64 | 1,90 | 2,0483 | 0,0436 | |||
| RRX / Regal Rexnord Corporation | 3,02 | -2,10 | 437,60 | 24,65 | 2,0114 | 0,4021 | |||
| PFE / Pfizer Inc. | 17,66 | -5,11 | 428,18 | -9,23 | 1,9681 | -0,1943 | |||
| CRM / Salesforce, Inc. | 1,50 | 16,45 | 408,36 | 18,33 | 1,8770 | 0,2951 | |||
| DIS / The Walt Disney Company | 3,13 | 11,19 | 388,37 | 39,70 | 1,7851 | 0,5108 | |||
| WM / Waste Management, Inc. | 1,69 | -7,73 | 385,99 | -8,80 | 1,7742 | -0,1660 | |||
| FANG / Diamondback Energy, Inc. | 2,71 | -7,68 | 371,99 | -20,66 | 1,7098 | -0,4393 | |||
| SSNC / SS&C Technologies Holdings, Inc. | 4,35 | -24,95 | 360,05 | -25,61 | 1,6549 | -0,5637 | |||
| GM / General Motors Company | 7,31 | -27,69 | 359,94 | -24,34 | 1,6544 | -0,5262 | |||
| AMZN / Amazon.com, Inc. | 1,62 | 6,51 | 354,56 | 22,82 | 1,6297 | 0,3063 | |||
| MLM / Martin Marietta Materials, Inc. | 0,64 | -2,64 | 352,43 | 11,79 | 1,6199 | 0,1748 | |||
| SBAC / SBA Communications Corporation | 1,49 | -25,44 | 349,64 | -20,41 | 1,6071 | -0,4067 | |||
| MET / MetLife, Inc. | 4,10 | -2,33 | 329,63 | -2,18 | 1,5151 | -0,0295 | |||
| ADBE / Adobe Inc. | 0,85 | 328,69 | 1,5108 | 1,5108 | |||||
| GIS / General Mills, Inc. | 6,24 | 33,55 | 323,53 | 15,72 | 1,4871 | 0,2055 | |||
| LHX / L3Harris Technologies, Inc. | 1,24 | -5,64 | 310,86 | 13,09 | 1,4288 | 0,1688 | |||
| CAT / Caterpillar Inc. | 0,80 | 13,77 | 309,48 | 33,91 | 1,4225 | 0,3631 | |||
| NVR / NVR, Inc. | 0,04 | -0,88 | 304,44 | 1,06 | 1,3993 | 0,0184 | |||
| BLDR / Builders FirstSource, Inc. | 2,54 | 11,70 | 295,93 | 4,33 | 1,3602 | 0,0599 | |||
| LULU / lululemon athletica inc. | 1,21 | 6,86 | 286,52 | -10,31 | 1,3170 | -0,1474 | |||
| HCA / HCA Healthcare, Inc. | 0,73 | -39,44 | 280,43 | -32,86 | 1,2890 | -0,6257 | |||
| EXR / Extra Space Storage Inc. | 1,89 | -2,90 | 278,26 | -3,59 | 1,2790 | -0,0440 | |||
| KEY / KeyCorp | 15,95 | -7,63 | 277,92 | 0,63 | 1,2774 | 0,0114 | |||
| SBUX / Starbucks Corporation | 2,95 | 18,77 | 270,73 | 10,95 | 1,2444 | 0,1258 | |||
| MDT / Medtronic plc | 2,93 | -4,82 | 255,80 | -7,67 | 1,1758 | -0,0942 | |||
| IP / International Paper Company | 5,32 | 7,38 | 249,33 | -5,74 | 1,1460 | -0,0665 | |||
| ACN / Accenture plc | 0,82 | 30,66 | 245,17 | 25,16 | 1,1269 | 0,2290 | |||
| HIG / The Hartford Insurance Group, Inc. | 1,87 | -13,83 | 236,62 | -11,64 | 1,0876 | -0,1400 | |||
| V / Visa Inc. | 0,66 | -5,63 | 235,00 | -4,40 | 1,0802 | -0,0466 | |||
| NDAQ / Nasdaq, Inc. | 2,56 | -6,07 | 228,71 | 10,72 | 1,0512 | 0,1044 | |||
| TGT / Target Corporation | 2,27 | 0,33 | 223,83 | -5,16 | 1,0288 | -0,0530 | |||
| DE / Deere & Company | 0,43 | -5,27 | 218,03 | 2,63 | 1,0021 | 0,0283 | |||
| NUE / Nucor Corporation | 1,65 | 1,70 | 213,26 | 9,47 | 0,9802 | 0,0872 | |||
| RRR / Red Rock Resorts, Inc. | 3,33 | -12,65 | 173,11 | 4,79 | 0,7957 | 0,0384 | |||
| COOP / Mr. Cooper Group Inc. | 1,11 | -23,53 | 165,35 | -4,60 | 0,7600 | -0,0345 | |||
| WCC / WESCO International, Inc. | 0,81 | -9,29 | 150,90 | 8,18 | 0,6936 | 0,0542 | |||
| HII / Huntington Ingalls Industries, Inc. | 0,47 | -11,52 | 114,24 | 4,70 | 0,5251 | 0,0249 | |||
| POST / Post Holdings, Inc. | 0,91 | -17,20 | 99,23 | -22,42 | 0,4561 | -0,1302 | |||
| MSFT / Microsoft Corporation | 0,19 | -6,92 | 96,07 | 23,34 | 0,4416 | 0,0845 | |||
| PH / Parker-Hannifin Corporation | 0,13 | -3,74 | 92,45 | 10,61 | 0,4249 | 0,0418 | |||
| META / Meta Platforms, Inc. | 0,12 | -6,87 | 85,98 | 19,26 | 0,3952 | 0,0647 | |||
| WNS / WNS (Holdings) Limited | 1,34 | -5,00 | 84,62 | -2,29 | 0,3890 | -0,0080 | |||
| C / Citigroup Inc. | 0,97 | -18,57 | 82,68 | -2,36 | 0,3800 | -0,0081 | |||
| VRSN / VeriSign, Inc. | 0,28 | -20,87 | 82,27 | -9,98 | 0,3782 | -0,0408 | |||
| ASH / Ashland Inc. | 1,50 | -11,08 | 75,27 | -24,60 | 0,3460 | -0,1116 | |||
| TSM / Taiwan Semiconductor Manufacturing Company Limited - Depositary Receipt (Common Stock) | 0,33 | 4,40 | 74,28 | 42,44 | 0,3414 | 0,1024 | |||
| GOOGL / Alphabet Inc. | 0,42 | 0,00 | 74,26 | 13,96 | 0,3413 | 0,0426 | |||
| CUBE / CubeSmart | 1,74 | -9,16 | 73,86 | -9,61 | 0,3395 | -0,0351 | |||
| CTRA / Coterra Energy Inc. | 2,56 | -7,20 | 64,95 | -18,50 | 0,2986 | -0,0668 | |||
| CIEN / Ciena Corporation | 0,76 | -8,08 | 61,53 | 23,71 | 0,2828 | 0,0548 | |||
| MAA / Mid-America Apartment Communities, Inc. | 0,37 | -13,02 | 54,78 | -23,18 | 0,2518 | -0,0751 | |||
| SOLV / Solventum Corporation | 0,72 | 24,91 | 54,68 | 24,58 | 0,2513 | 0,0501 | |||
| FCX / Freeport-McMoRan Inc. | 1,25 | -3,48 | 54,37 | 10,51 | 0,2499 | 0,0244 | |||
| GTES / Gates Industrial Corporation plc | 2,18 | -15,25 | 50,29 | 6,01 | 0,2311 | 0,0137 | |||
| TFX / Teleflex Incorporated | 0,42 | -27,37 | 50,26 | -37,79 | 0,2310 | -0,1393 | |||
| RHP / Ryman Hospitality Properties, Inc. | 0,50 | -10,64 | 49,33 | -3,58 | 0,2267 | -0,0078 | |||
| WBS / Webster Financial Corporation | 0,86 | -13,18 | 46,70 | -8,04 | 0,2147 | -0,0181 | |||
| LEA / Lear Corporation | 0,47 | -23,12 | 45,10 | -17,22 | 0,2073 | -0,0425 | |||
| PRGO / Perrigo Company plc | 1,66 | -12,63 | 44,23 | -16,75 | 0,2033 | -0,0402 | |||
| CMPR / Cimpress plc | 0,94 | 1,78 | 44,09 | 5,76 | 0,2027 | 0,0116 | |||
| FWONK / Formula One Group | 0,42 | -11,93 | 43,69 | 2,25 | 0,2008 | 0,0050 | |||
| FIS / Fidelity National Information Services, Inc. | 0,50 | -8,97 | 40,90 | -0,76 | 0,1880 | -0,0009 | |||
| UGI / UGI Corporation | 1,09 | -11,64 | 39,54 | -2,69 | 0,1817 | -0,0045 | |||
| ICLR / ICON Public Limited Company | 0,26 | -1,60 | 38,05 | -18,21 | 0,1749 | -0,0384 | |||
| ILMN / Illumina, Inc. | 0,38 | 15,44 | 36,23 | 38,83 | 0,1665 | 0,0469 | |||
| MZTI / The Marzetti Company | 0,21 | -21,35 | 35,61 | -22,36 | 0,1637 | -0,0466 | |||
| BSX / Boston Scientific Corporation | 0,33 | -15,57 | 35,58 | -10,11 | 0,1635 | -0,0179 | |||
| TFC / Truist Financial Corporation | 0,75 | 3,21 | 32,27 | 7,83 | 0,1483 | 0,0111 | |||
| CIVI / Civitas Resources, Inc. | 1,10 | -14,79 | 30,32 | -32,79 | 0,1394 | -0,0674 | |||
| FBIN / Fortune Brands Innovations, Inc. | 0,58 | 27,63 | 29,96 | 7,93 | 0,1377 | 0,0105 | |||
| COHR / Coherent Corp. | 0,32 | 44,05 | 28,61 | 97,90 | 0,1315 | 0,0652 | |||
| TRU / TransUnion | 0,32 | 90,68 | 27,92 | 102,20 | 0,1283 | 0,0650 | |||
| FA / First Advantage Corporation | 1,67 | -29,25 | 27,75 | -16,60 | 0,1275 | -0,0250 | |||
| JCI / Johnson Controls International plc | 0,26 | -20,12 | 27,64 | 5,32 | 0,1271 | 0,0067 | |||
| TDY / Teledyne Technologies Incorporated | 0,05 | -12,29 | 27,52 | -9,72 | 0,1265 | -0,0132 | |||
| LOB / Live Oak Bancshares, Inc. | 0,92 | -13,99 | 27,35 | -3,86 | 0,1257 | -0,0047 | |||
| ULTA / Ulta Beauty, Inc. | 0,06 | -63,99 | 27,15 | -54,04 | 0,1248 | -0,1460 | |||
| GDDY / GoDaddy Inc. | 0,15 | -12,36 | 27,00 | -12,40 | 0,1241 | -0,0172 | |||
| BDX / Becton, Dickinson and Company | 0,15 | -90,38 | 26,56 | -92,76 | 0,1221 | -1,5603 | |||
| MS / Morgan Stanley | 0,18 | 0,00 | 25,56 | 20,74 | 0,1175 | 0,0204 | |||
| OZK / Bank OZK | 0,53 | -11,21 | 25,11 | -3,83 | 0,1154 | -0,0043 | |||
| WTW / Willis Towers Watson Public Limited Company | 0,08 | 11,32 | 25,02 | 0,96 | 0,1150 | 0,0014 | |||
| RNR / RenaissanceRe Holdings Ltd. | 0,10 | -14,44 | 24,97 | -13,40 | 0,1148 | -0,0174 | |||
| ENOV / Enovis Corporation | 0,78 | -58,27 | 24,50 | -65,75 | 0,1126 | -0,2153 | |||
| CVX / Chevron Corporation | 0,17 | -11,43 | 24,19 | -24,19 | 0,1112 | -0,0351 | |||
| UDR / UDR, Inc. | 0,58 | -14,68 | 23,67 | -22,88 | 0,1088 | -0,0319 | |||
| D / Dominion Energy, Inc. | 0,40 | -11,27 | 22,43 | -10,55 | 0,1031 | -0,0119 | |||
| STZ / Constellation Brands, Inc. | 0,12 | -20,21 | 19,97 | -29,27 | 0,0918 | -0,0376 | |||
| HUM / Humana Inc. | 0,08 | -6,57 | 19,04 | -13,67 | 0,0875 | -0,0136 | |||
| ESAB / ESAB Corporation | 0,16 | -33,22 | 18,78 | -30,90 | 0,0863 | -0,0383 | |||
| SF / Stifel Financial Corp. | 0,17 | -13,30 | 17,97 | -4,54 | 0,0826 | -0,0037 | |||
| TGB / Taseko Mines Limited | 5,39 | 210,93 | 16,98 | 337,29 | 0,0780 | 0,0602 | |||
| AR / Antero Resources Corporation | 0,42 | 16,72 | 0,0769 | 0,0769 | |||||
| TJX / The TJX Companies, Inc. | 0,13 | 0,00 | 16,60 | 1,39 | 0,0763 | 0,0012 | |||
| REXR / Rexford Industrial Realty, Inc. | 0,46 | -12,98 | 16,28 | -20,94 | 0,0748 | -0,0196 | |||
| ALK / Alaska Air Group, Inc. | 0,31 | 15,33 | 0,0705 | 0,0705 | |||||
| NVST / Envista Holdings Corporation | 0,78 | -18,28 | 15,17 | -7,49 | 0,0698 | -0,0054 | |||
| SNV / Synovus Financial Corp. | 0,27 | -16,69 | 13,75 | -7,76 | 0,0632 | -0,0051 | |||
| ERII / Energy Recovery, Inc. | 1,05 | -10,98 | 13,48 | -28,41 | 0,0619 | -0,0243 | |||
| LPLA / LPL Financial Holdings Inc. | 0,04 | 2,96 | 13,33 | 18,01 | 0,0612 | 0,0095 | |||
| CMCSA / Comcast Corporation | 0,36 | 0,00 | 12,96 | -3,28 | 0,0596 | -0,0019 | |||
| DCO / Ducommun Incorporated | 0,16 | -9,85 | 12,90 | 28,36 | 0,0593 | 0,0132 | |||
| FCN / FTI Consulting, Inc. | 0,08 | 12,39 | 0,0570 | 0,0570 | |||||
| PRGS / Progress Software Corporation | 0,19 | -15,27 | 12,09 | 5,00 | 0,0556 | 0,0028 | |||
| L / Loews Corporation | 0,13 | -15,22 | 11,83 | -15,45 | 0,0544 | -0,0098 | |||
| KKR / KKR & Co. Inc. | 0,09 | 0,00 | 11,67 | 15,07 | 0,0536 | 0,0071 | |||
| VTR / Ventas, Inc. | 0,17 | -11,71 | 10,80 | -18,92 | 0,0496 | -0,0114 | |||
| HLIO / Helios Technologies, Inc. | 0,32 | 23,01 | 10,56 | 27,91 | 0,0485 | 0,0107 | |||
| FHN / First Horizon Corporation | 0,48 | -25,63 | 10,24 | -18,82 | 0,0471 | -0,0107 | |||
| GHM / Graham Corporation | 0,20 | -3,24 | 9,71 | 66,23 | 0,0446 | 0,0179 | |||
| ESGR / Enstar Group Limited | 0,03 | -50,01 | 9,53 | -49,41 | 0,0438 | -0,0425 | |||
| BRO / Brown & Brown, Inc. | 0,08 | -13,93 | 8,84 | -23,29 | 0,0406 | -0,0122 | |||
| TFIN / Triumph Financial, Inc. | 0,16 | -6,01 | 8,59 | -10,38 | 0,0395 | -0,0045 | |||
| BBWI / Bath & Body Works, Inc. | 0,28 | -13,04 | 8,52 | -14,08 | 0,0392 | -0,0063 | |||
| GNRC / Generac Holdings Inc. | 0,06 | 8,23 | 0,0378 | 0,0378 | |||||
| FIP / FTAI Infrastructure Inc. | 1,32 | 23,50 | 8,15 | 68,20 | 0,0375 | 0,0153 | |||
| ODC / Oil-Dri Corporation of America | 0,13 | -6,71 | 7,65 | 19,84 | 0,0352 | 0,0059 | |||
| KNF / Knife River Corporation | 0,09 | 6,97 | 0,0320 | 0,0320 | |||||
| ALGT / Allegiant Travel Company | 0,13 | 38,89 | 6,92 | 47,78 | 0,0318 | 0,0103 | |||
| ASTH / Astrana Health, Inc. | 0,27 | 28,66 | 6,76 | 3,22 | 0,0311 | 0,0011 | |||
| USLM / United States Lime & Minerals, Inc. | 0,07 | 18,99 | 6,54 | 34,35 | 0,0301 | 0,0077 | |||
| BR / Broadridge Financial Solutions, Inc. | 0,03 | -16,62 | 6,25 | -16,43 | 0,0287 | -0,0056 | |||
| CCS / Century Communities, Inc. | 0,11 | 448,40 | 6,21 | 360,49 | 0,0286 | 0,0224 | |||
| IGIC / International General Insurance Holdings Ltd. | 0,26 | 16,68 | 6,20 | 6,53 | 0,0285 | 0,0018 | |||
| LEU / Centrus Energy Corp. | 0,03 | -56,47 | 6,12 | 28,18 | 0,0281 | 0,0062 | |||
| HDB / HDFC Bank Limited - Depositary Receipt (Common Stock) | 0,08 | 17,42 | 6,06 | 35,52 | 0,0278 | 0,0074 | |||
| ALNT / Allient Inc. | 0,16 | -18,88 | 5,66 | 34,00 | 0,0260 | 0,0067 | |||
| CHKP / Check Point Software Technologies Ltd. | 0,02 | -52,07 | 5,07 | -53,48 | 0,0233 | -0,0266 | |||
| PAL / Proficient Auto Logistics, Inc. | 0,67 | 71,04 | 4,84 | 48,34 | 0,0222 | 0,0073 | |||
| MAMA / Mama's Creations, Inc. | 0,53 | -5,73 | 4,37 | 20,19 | 0,0201 | 0,0034 | |||
| AVNS / Avanos Medical, Inc. | 0,35 | 76,61 | 4,22 | 50,88 | 0,0194 | 0,0066 | |||
| PESI / Perma-Fix Environmental Services, Inc. | 0,39 | -5,34 | 4,15 | 36,98 | 0,0191 | 0,0052 | |||
| NVS / Novartis AG - Depositary Receipt (Common Stock) | 0,03 | 0,00 | 4,15 | 8,53 | 0,0191 | 0,0015 | |||
| BBCP / Concrete Pumping Holdings, Inc. | 0,64 | -8,94 | 3,92 | 2,57 | 0,0180 | 0,0005 | |||
| UFPT / UFP Technologies, Inc. | 0,02 | 12,93 | 3,82 | 36,73 | 0,0175 | 0,0047 | |||
| MLAB / Mesa Laboratories, Inc. | 0,04 | 31,71 | 3,66 | 4,58 | 0,0168 | 0,0008 | |||
| CURB / Curbline Properties Corp. | 0,16 | 3,42 | 3,59 | -2,39 | 0,0165 | -0,0004 | |||
| TTAM / Titan America SA | 0,29 | 95,62 | 3,59 | 80,64 | 0,0165 | 0,0074 | |||
| MYFW / First Western Financial, Inc. | 0,16 | -0,71 | 3,55 | 14,00 | 0,0163 | 0,0020 | |||
| BOKF / BOK Financial Corporation | 0,03 | -9,16 | 3,22 | -14,85 | 0,0148 | -0,0025 | |||
| CMT / Core Molding Technologies, Inc. | 0,18 | -3,82 | 2,91 | 4,98 | 0,0134 | 0,0007 | |||
| UTZ / Utz Brands, Inc. | 0,23 | 2,89 | 0,0133 | 0,0133 | |||||
| CNH / CNH Industrial N.V. | 0,22 | 0,00 | 2,89 | 5,52 | 0,0133 | 0,0007 | |||
| OEC / Orion S.A. | 0,27 | -7,64 | 2,81 | -25,09 | 0,0129 | -0,0043 | |||
| THR / Thermon Group Holdings, Inc. | 0,10 | 7,96 | 2,79 | 8,86 | 0,0128 | 0,0011 | |||
| AZZ / AZZ Inc. | 0,03 | 2,73 | 0,0126 | 0,0126 | |||||
| SAMG / Silvercrest Asset Management Group Inc. | 0,17 | 35,36 | 2,73 | 31,25 | 0,0125 | 0,0030 | |||
| MGY / Magnolia Oil & Gas Corporation | 0,12 | -6,47 | 2,71 | -16,76 | 0,0124 | -0,0025 | |||
| IWD / iShares Trust - iShares Russell 1000 Value ETF | 0,01 | -12,39 | 2,63 | -9,57 | 0,0121 | -0,0012 | |||
| SPOT / Spotify Technology S.A. | 0,00 | 0,00 | 2,61 | 39,53 | 0,0120 | 0,0034 | |||
| MLR / Miller Industries, Inc. | 0,05 | -5,41 | 2,40 | -0,74 | 0,0110 | -0,0001 | |||
| RCKY / Rocky Brands, Inc. | 0,10 | -30,36 | 2,11 | -11,01 | 0,0097 | -0,0012 | |||
| ASUR / Asure Software, Inc. | 0,19 | 1,82 | 0,0084 | 0,0084 | |||||
| STRW / Strawberry Fields REIT, Inc. | 0,17 | 1,77 | 0,0082 | 0,0082 | |||||
| ALOT / AstroNova, Inc. | 0,13 | 32,98 | 1,48 | 67,80 | 0,0068 | 0,0028 | |||
| JOUT / Johnson Outdoors Inc. | 0,05 | -13,50 | 1,44 | 5,41 | 0,0066 | 0,0004 | |||
| AEO / American Eagle Outfitters, Inc. | 0,14 | 1,38 | 0,0064 | 0,0064 | |||||
| ONDS / Ondas Holdings Inc. | 0,66 | 2,70 | 1,27 | 84,35 | 0,0059 | 0,0027 | |||
| QURE / uniQure N.V. | 0,08 | 0,00 | 1,15 | 31,51 | 0,0053 | 0,0013 | |||
| RMNI / Rimini Street, Inc. | 0,29 | -3,46 | 1,11 | 4,64 | 0,0051 | 0,0002 | |||
| AUPH / Aurinia Pharmaceuticals Inc. | 0,12 | 65,77 | 0,98 | 74,78 | 0,0045 | 0,0019 | |||
| GRBK / Green Brick Partners, Inc. | 0,02 | -18,48 | 0,97 | -12,10 | 0,0044 | -0,0006 | |||
| ACU / Acme United Corporation | 0,02 | 2,65 | 0,83 | 7,35 | 0,0038 | 0,0003 | |||
| PCYO / Pure Cycle Corporation | 0,07 | 3,18 | 0,74 | 5,69 | 0,0034 | 0,0002 | |||
| NTIC / Northern Technologies International Corporation | 0,08 | 4,46 | 0,58 | -25,64 | 0,0027 | -0,0009 | |||
| TRNS / Transcat, Inc. | 0,01 | 2,00 | 0,56 | 18,01 | 0,0026 | 0,0004 | |||
| CRWS / Crown Crafts, Inc. | 0,12 | 4,72 | 0,34 | -17,40 | 0,0016 | -0,0003 | |||
| MTN / Vail Resorts, Inc. | 0,00 | -100,00 | 0,00 | 0,0000 | |||||
| PLOW / Douglas Dynamics, Inc. | 0,00 | -100,00 | 0,00 | 0,0000 | |||||
| ARCO / Arcos Dorados Holdings Inc. | 0,00 | -100,00 | 0,00 | 0,0000 | |||||
| NSP / Insperity, Inc. | 0,00 | -100,00 | 0,00 | 0,0000 | |||||
| VZ / Verizon Communications Inc. | 0,00 | -100,00 | 0,00 | 0,0000 |