Statistiques de base
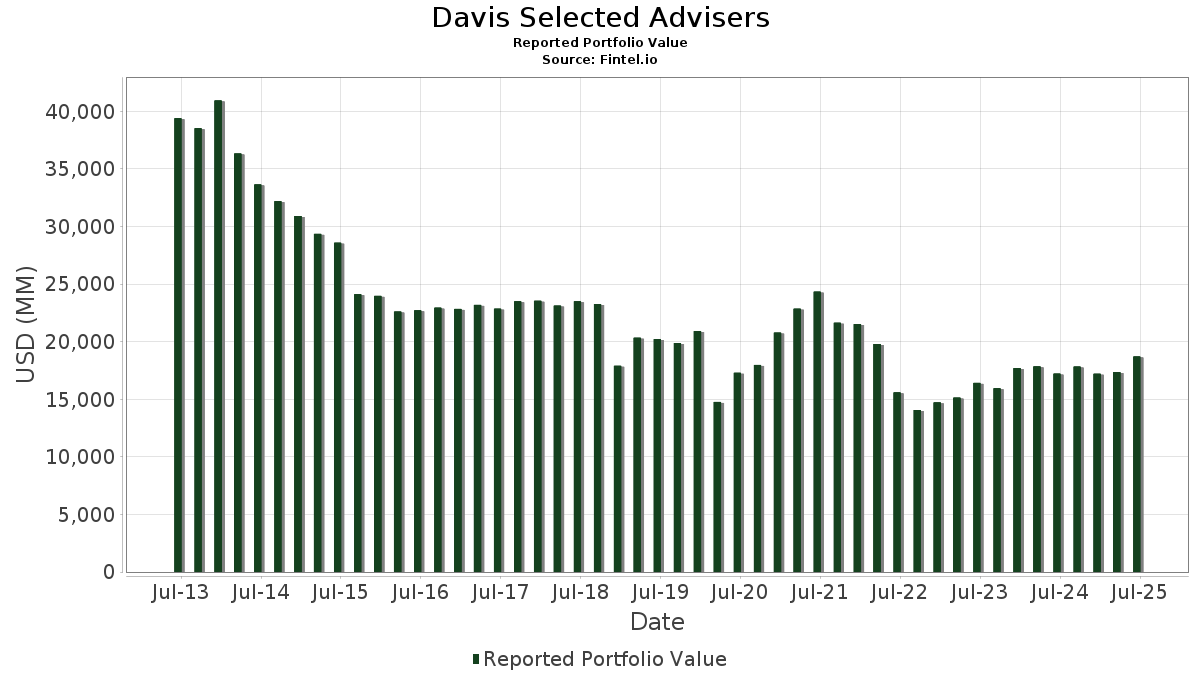
| Valeur du portefeuille | $ 18 702 346 980 |
| Positions actuelles | 107 |
Dernières positions, performances, ASG (à partir des dépôts 13F, 13D)
Davis Selected Advisers a déclaré un total de 107 positions dans ses derniers dépôts auprès de la SEC. La valeur la plus récente du portefeuille est calculée à 18 702 346 980 USD. Les actifs sous gestion réels (ASG) sont cette valeur plus les liquidités (qui ne sont pas divulguées). Les principales positions de Davis Selected Advisers sont Capital One Financial Corporation (US:COF) , Meta Platforms, Inc. (US:META) , Applied Materials, Inc. (US:AMAT) , U.S. Bancorp (US:USB) , and MGM Resorts International (US:MGM) . Les nouvelles positions de Davis Selected Advisers incluent NVIDIA Corporation (US:NVDA) , Realty Income Corporation (US:O) , Taiwan Semiconductor Manufacturing Company Limited - Depositary Receipt (Common Stock) (US:TSM) , . Les principales industries de Davis Selected Advisers sont "Wholesale Trade-durable Goods" (sic 50) , "Electric, Gas, And Sanitary Services " (sic 49) , and "Health Services" (sic 80) .
Meilleures augmentations ce trimestre
Nous utilisons la variation de l'allocation du portefeuille car il s'agit de l'indicateur le plus significatif. Les changements peuvent être dus à des transactions ou à des variations de prix des actions.
| Titre | Actions (en millions) |
Valeur ($ en millions) |
% du portefeuille | ΔPortefeuille % |
|---|---|---|---|---|
| 1,13 | 353,43 | 1,8897 | 1,7433 | |
| 9,34 | 237,00 | 1,2672 | 1,2672 | |
| 19,33 | 874,76 | 4,6773 | 1,0541 | |
| 2,11 | 1 555,76 | 8,3185 | 0,9760 | |
| 8,96 | 501,02 | 2,6789 | 0,9578 | |
| 8,96 | 1 905,42 | 10,1882 | 0,8877 | |
| 23,82 | 819,21 | 4,3802 | 0,8242 | |
| 4,96 | 907,59 | 4,8528 | 0,6763 | |
| 5,75 | 172,42 | 0,9219 | 0,1786 | |
| 11,64 | 137,42 | 0,7348 | 0,1592 |
Principales baisses ce trimestre
Nous utilisons la variation de l'allocation du portefeuille car il s'agit de l'indicateur le plus significatif. Les changements peuvent être dus à des transactions ou à des variations de prix des actions.
| Titre | Actions (en millions) |
Valeur ($ en millions) |
% du portefeuille | ΔPortefeuille % |
|---|---|---|---|---|
| 0,00 | 776,17 | 4,1501 | -3,0199 | |
| 0,66 | 216,82 | 1,1593 | -1,5585 | |
| 1,65 | 404,06 | 2,1605 | -1,3951 | |
| 1,35 | 243,29 | 1,3009 | -1,0283 | |
| 0,55 | 269,04 | 1,4385 | -0,6441 | |
| 2,28 | 85,16 | 0,4554 | -0,2484 | |
| 11,59 | 799,26 | 4,2736 | -0,2363 | |
| 1,07 | 310,53 | 1,6604 | -0,2306 | |
| 4,95 | 290,24 | 1,5519 | -0,2302 | |
| 1,77 | 243,29 | 1,3008 | -0,1704 |
Déclarations 13D/G
Il s'agit d'une liste des déclarations 13D et 13G déposées au cours de la dernière année (le cas échéant). Cliquez sur l'icône du lien pour voir l'historique complet des transactions. Les lignes vertes indiquent de nouvelles positions. Les lignes rouges indiquent des positions fermées.
| Date de dépôt | Formulaire | Titre | Actions précédentes |
Actions actuelles |
ΔActions % | % de participation |
% ΔParticipation | |
|---|---|---|---|---|---|---|---|---|
| 2025-08-07 | MGM / MGM Resorts International | 20 815 057 | 23 821 109 | 14,44 | 9,50 | 17,28 | ||
| 2025-08-07 | VTRS / Viatris Inc. | 64 948 236 | 66 375 520 | 2,20 | 6,20 | 3,33 | ||
| 2024-11-12 | HOLI / Hollysys Automation Technologies Ltd. | 5 248 240 | 0 | -100,00 | 0,00 | -100,00 |
Déclarations 13F et dépôts de fonds
Ce formulaire a été déposé le 2025-08-08 pour la période de déclaration 2025-06-30. Cliquez sur l'icône du lien pour voir l'historique complet des transactions.
Mettre à niveau pour débloquer les données premium et exporter vers Excel ![]() .
.
| Titre | Type | Prix moyen de l'action | Actions (en millions) |
ΔActions (%) |
ΔActions (%) |
Valeur ($ en millions) |
Portefeuille (%) |
ΔPortefeuille (%) |
|
|---|---|---|---|---|---|---|---|---|---|
| COF / Capital One Financial Corporation | 8,96 | -0,49 | 1 905,42 | 18,09 | 10,1882 | 0,8877 | |||
| META / Meta Platforms, Inc. | 2,11 | -4,63 | 1 555,76 | 22,13 | 8,3185 | 0,9760 | |||
| AMAT / Applied Materials, Inc. | 4,96 | -0,71 | 907,59 | 25,25 | 4,8528 | 0,6763 | |||
| USB / U.S. Bancorp | 19,33 | 29,84 | 874,76 | 39,16 | 4,6773 | 1,0541 | |||
| MGM / MGM Resorts International | 23,82 | 14,44 | 819,21 | 32,78 | 4,3802 | 0,8242 | |||
| CVS / CVS Health Corporation | 11,59 | 0,33 | 799,26 | 2,15 | 4,2736 | -0,2363 | |||
| BRK.A / Berkshire Hathaway Inc. | 0,00 | -31,64 | 776,17 | -37,61 | 4,1501 | -3,0199 | |||
| MKL / Markel Group Inc. | 0,37 | -0,09 | 741,28 | 6,74 | 3,9636 | -0,0394 | |||
| AMZN / Amazon.com, Inc. | 3,27 | -7,12 | 717,22 | 7,09 | 3,8349 | -0,0251 | |||
| WFC / Wells Fargo & Company | 8,18 | -3,45 | 655,10 | 7,75 | 3,5027 | -0,0014 | |||
| VTRS / Viatris Inc. | 66,38 | 2,20 | 592,73 | 4,78 | 3,1693 | -0,0913 | |||
| GOOGL / Alphabet Inc. | 2,85 | -6,09 | 503,03 | 7,02 | 2,6897 | -0,0195 | |||
| TSN / Tyson Foods, Inc. | 8,96 | 91,39 | 501,02 | 67,79 | 2,6789 | 0,9578 | |||
| TXN / Texas Instruments Incorporated | 2,38 | -2,09 | 494,18 | 13,12 | 2,6423 | 0,1244 | |||
| TECK / Teck Resources Limited | 11,03 | -1,39 | 445,59 | 9,30 | 2,3826 | 0,0328 | |||
| SOLV / Solventum Corporation | 5,49 | 3,87 | 416,56 | 3,59 | 2,2273 | -0,0903 | |||
| HUM / Humana Inc. | 1,65 | -29,11 | 404,06 | -34,50 | 2,1605 | -1,3951 | |||
| UNH / UnitedHealth Group Incorporated | 1,13 | 2 234,93 | 353,43 | 1 290,84 | 1,8897 | 1,7433 | |||
| CB / Chubb Limited | 1,07 | -1,34 | 310,53 | -5,35 | 1,6604 | -0,2306 | |||
| TCOM / Trip.com Group Limited - Depositary Receipt (Common Stock) | 4,95 | 1,78 | 290,24 | -6,13 | 1,5519 | -0,2302 | |||
| BRK.B / Berkshire Hathaway Inc. | 0,55 | -18,37 | 269,04 | -25,54 | 1,4385 | -0,6441 | |||
| DGX / Quest Diagnostics Incorporated | 1,35 | -43,29 | 243,29 | -39,79 | 1,3009 | -1,0283 | |||
| OC / Owens Corning | 1,77 | -1,02 | 243,29 | -4,69 | 1,3008 | -0,1704 | |||
| CTRA / Coterra Energy Inc. | 9,34 | 237,00 | 1,2672 | 1,2672 | |||||
| QSR / Restaurant Brands International Inc. | 3,42 | 1,40 | 226,69 | 0,87 | 1,2121 | -0,0833 | |||
| CI / The Cigna Group | 0,66 | -54,24 | 216,82 | -54,02 | 1,1593 | -1,5585 | |||
| AGCO / AGCO Corporation | 1,80 | -10,99 | 186,16 | -0,80 | 0,9954 | -0,0863 | |||
| JPM / JPMorgan Chase & Co. | 0,64 | -0,60 | 184,39 | 17,48 | 0,9859 | 0,0813 | |||
| BK / The Bank of New York Mellon Corporation | 1,90 | -0,64 | 172,97 | 7,94 | 0,9248 | 0,0012 | |||
| CPNG / Coupang, Inc. | 5,75 | -2,14 | 172,42 | 33,69 | 0,9219 | 0,1786 | |||
| DUSA / Davis Fundamental ETF Trust - Davis Select U.S. Equity ETF | 3,38 | 0,00 | 156,58 | 9,36 | 0,8372 | 0,0119 | |||
| COP / ConocoPhillips | 1,59 | 13,09 | 142,29 | -3,37 | 0,7608 | -0,0879 | |||
| YMM / Full Truck Alliance Co. Ltd. - Depositary Receipt (Common Stock) | 11,64 | 48,81 | 137,42 | 37,62 | 0,7348 | 0,1592 | |||
| MSFT / Microsoft Corporation | 0,25 | -3,34 | 123,34 | 28,08 | 0,6595 | 0,1044 | |||
| GOOGL / Alphabet Inc. | 0,65 | 0,57 | 115,37 | 14,19 | 0,6169 | 0,0346 | |||
| FITB / Fifth Third Bancorp | 2,51 | 2,10 | 103,35 | 7,13 | 0,5526 | -0,0034 | |||
| DINT / Davis Fundamental ETF Trust - Davis Select International ETF | 3,89 | 0,00 | 100,60 | 11,90 | 0,5379 | 0,0197 | |||
| PNC / The PNC Financial Services Group, Inc. | 0,50 | 1,32 | 93,65 | 7,46 | 0,5007 | -0,0016 | |||
| DAR / Darling Ingredients Inc. | 2,44 | -1,33 | 92,71 | 19,83 | 0,4957 | 0,0498 | |||
| DFNL / Davis Fundamental ETF Trust - Davis Select Financial ETF | 2,13 | 0,00 | 91,46 | 9,32 | 0,4890 | 0,0068 | |||
| AXP / American Express Company | 0,27 | -0,34 | 86,28 | 18,15 | 0,4614 | 0,0404 | |||
| IAC / IAC Inc. | 2,28 | -14,19 | 85,16 | -30,25 | 0,4554 | -0,2484 | |||
| NTES / NetEase, Inc. - Depositary Receipt (Common Stock) | 0,59 | -0,46 | 79,85 | 30,15 | 0,4270 | 0,0733 | |||
| DWLD / Davis Fundamental ETF Trust - Davis Select Worldwide ETF | 1,92 | 0,00 | 79,41 | 9,95 | 0,4246 | 0,0083 | |||
| APP / AppLovin Corporation | 0,22 | 31,94 | 75,29 | 74,32 | 0,4026 | 0,1536 | |||
| SE / Sea Limited - Depositary Receipt (Common Stock) | 0,45 | -12,89 | 71,70 | 6,77 | 0,3834 | -0,0037 | |||
| L / Loews Corporation | 0,60 | -0,29 | 54,75 | -0,56 | 0,2928 | -0,0246 | |||
| BAC / Bank of America Corporation | 1,15 | -0,24 | 54,58 | 13,12 | 0,2918 | 0,0137 | |||
| WCC / WESCO International, Inc. | 0,29 | 12,47 | 53,85 | 34,13 | 0,2879 | 0,0565 | |||
| NTB / The Bank of N.T. Butterfield & Son Limited | 1,06 | -0,58 | 47,04 | 13,12 | 0,2515 | 0,0118 | |||
| RKT / Rocket Companies, Inc. | 3,13 | -0,21 | 44,42 | 17,23 | 0,2375 | 0,0191 | |||
| RNR / RenaissanceRe Holdings Ltd. | 0,14 | -0,51 | 34,75 | 0,69 | 0,1858 | -0,0131 | |||
| BEKE / KE Holdings Inc. - Depositary Receipt (Common Stock) | 1,85 | -0,41 | 32,87 | -12,07 | 0,1757 | -0,0397 | |||
| ORCL / Oracle Corporation | 0,13 | -3,52 | 28,77 | 50,87 | 0,1538 | 0,0439 | |||
| VALE / Vale S.A. - Depositary Receipt (Common Stock) | 2,95 | 7,87 | 28,63 | 4,95 | 0,1531 | -0,0042 | |||
| SCHW / The Charles Schwab Corporation | 0,30 | -0,39 | 27,05 | 16,10 | 0,1446 | 0,0103 | |||
| JCI / Johnson Controls International plc | 0,25 | -39,30 | 25,91 | -19,97 | 0,1385 | -0,0481 | |||
| AMT / American Tower Corporation | 0,09 | 3,05 | 20,26 | 4,67 | 0,1083 | -0,0032 | |||
| ANGI / Angi Inc. | 1,18 | -71,60 | 18,04 | -65,23 | 0,0964 | -0,1243 | |||
| SAP / SAP SE - Depositary Receipt (Common Stock) | 0,05 | -38,56 | 14,22 | -30,40 | 0,0760 | -0,0417 | |||
| BXP / Boston Properties, Inc. | 0,21 | 3,04 | 14,14 | 3,47 | 0,0756 | -0,0032 | |||
| NVDA / NVIDIA Corporation | 0,09 | 14,08 | 0,0753 | 0,0753 | |||||
| CUZ / Cousins Properties Incorporated | 0,46 | 2,98 | 13,82 | 4,82 | 0,0739 | -0,0021 | |||
| PLD / Prologis, Inc. | 0,13 | -24,76 | 13,58 | -29,25 | 0,0726 | -0,0380 | |||
| EG / Everest Group, Ltd. | 0,04 | -0,41 | 13,42 | -6,84 | 0,0718 | -0,0113 | |||
| REXR / Rexford Industrial Realty, Inc. | 0,38 | 3,13 | 13,34 | -6,29 | 0,0713 | -0,0107 | |||
| BRX / Brixmor Property Group Inc. | 0,50 | 2,90 | 12,98 | 0,93 | 0,0694 | -0,0047 | |||
| VTR / Ventas, Inc. | 0,20 | -18,72 | 12,84 | -25,36 | 0,0687 | -0,0305 | |||
| EQIX / Equinix, Inc. | 0,02 | 1,89 | 12,46 | -0,60 | 0,0666 | -0,0056 | |||
| NOAH / Noah Holdings Limited - Depositary Receipt (Common Stock) | 1,02 | -38,27 | 12,20 | -22,00 | 0,0652 | -0,0249 | |||
| DLR / Digital Realty Trust, Inc. | 0,07 | 1,98 | 11,93 | 24,07 | 0,0638 | 0,0084 | |||
| PSA / Public Storage | 0,04 | -18,81 | 11,85 | -20,40 | 0,0634 | -0,0225 | |||
| AVB / AvalonBay Communities, Inc. | 0,06 | 2,07 | 11,77 | -3,22 | 0,0629 | -0,0072 | |||
| ARE / Alexandria Real Estate Equities, Inc. | 0,16 | 3,22 | 11,34 | -18,97 | 0,0607 | -0,0200 | |||
| JD / JD.com, Inc. - Depositary Receipt (Common Stock) | 0,34 | -0,57 | 11,21 | -21,08 | 0,0599 | -0,0219 | |||
| SHO / Sunstone Hotel Investors, Inc. | 1,16 | 45,94 | 10,03 | 34,62 | 0,0536 | 0,0107 | |||
| MTB / M&T Bank Corporation | 0,05 | -0,46 | 9,88 | 8,02 | 0,0528 | 0,0001 | |||
| SPG / Simon Property Group, Inc. | 0,06 | -13,68 | 9,44 | -16,45 | 0,0505 | -0,0146 | |||
| AMH / American Homes 4 Rent | 0,25 | 2,98 | 9,03 | -1,76 | 0,0483 | -0,0047 | |||
| CPT / Camden Property Trust | 0,08 | 2,80 | 8,86 | -5,28 | 0,0474 | -0,0065 | |||
| REG / Regency Centers Corporation | 0,12 | 3,12 | 8,68 | -0,42 | 0,0464 | -0,0038 | |||
| EXR / Extra Space Storage Inc. | 0,06 | -0,04 | 8,37 | -0,75 | 0,0448 | -0,0038 | |||
| ESS / Essex Property Trust, Inc. | 0,03 | 2,92 | 8,09 | -4,86 | 0,0432 | -0,0058 | |||
| MAA / Mid-America Apartment Communities, Inc. | 0,05 | 3,11 | 7,85 | -8,93 | 0,0420 | -0,0077 | |||
| EGP / EastGroup Properties, Inc. | 0,05 | 3,08 | 7,71 | -2,19 | 0,0412 | -0,0042 | |||
| STT / State Street Corporation | 0,07 | -0,62 | 7,68 | 18,04 | 0,0411 | 0,0036 | |||
| EQR / Equity Residential | 0,10 | 1,87 | 6,87 | -3,95 | 0,0367 | -0,0045 | |||
| DOC / Healthpeak Properties, Inc. | 0,39 | 57,69 | 6,81 | 36,55 | 0,0364 | 0,0077 | |||
| TFC / Truist Financial Corporation | 0,16 | -0,37 | 6,70 | 4,07 | 0,0358 | -0,0013 | |||
| UDR / UDR, Inc. | 0,16 | 2,13 | 6,61 | -7,68 | 0,0354 | -0,0059 | |||
| HPP / Hudson Pacific Properties, Inc. | 2,30 | -0,04 | 6,29 | -7,17 | 0,0336 | -0,0054 | |||
| TRNO / Terreno Realty Corporation | 0,10 | 3,34 | 5,84 | -8,35 | 0,0312 | -0,0055 | |||
| VICI / VICI Properties Inc. | 0,17 | 18,34 | 5,53 | 18,25 | 0,0296 | 0,0026 | |||
| CHCT / Community Healthcare Trust Incorporated | 0,33 | 10,12 | 5,53 | 0,84 | 0,0295 | -0,0020 | |||
| SUI / Sun Communities, Inc. | 0,04 | 53,23 | 4,85 | 50,67 | 0,0260 | 0,0074 | |||
| CCI / Crown Castle Inc. | 0,04 | 3,17 | 4,35 | 1,68 | 0,0232 | -0,0014 | |||
| DEI / Douglas Emmett, Inc. | 0,28 | 2,95 | 4,16 | -3,23 | 0,0223 | -0,0025 | |||
| CDP / COPT Defense Properties | 0,15 | 4,07 | 0,0218 | 0,0218 | |||||
| NTST / NETSTREIT Corp. | 0,22 | 91,81 | 3,73 | 104,88 | 0,0200 | 0,0095 | |||
| O / Realty Income Corporation | 0,05 | 2,82 | 0,0151 | 0,0151 | |||||
| IVE / iShares Trust - iShares S&P 500 Value ETF | 0,01 | -44,31 | 2,15 | -42,89 | 0,0115 | -0,0102 | |||
| TSM / Taiwan Semiconductor Manufacturing Company Limited - Depositary Receipt (Common Stock) | 0,01 | 1,63 | 0,0087 | 0,0087 | |||||
| LRCX / Lam Research Corporation | 0,01 | 0,00 | 1,20 | 33,97 | 0,0064 | 0,0012 | |||
| CCK / Crown Holdings, Inc. | 0,01 | 0,00 | 0,88 | 15,45 | 0,0047 | 0,0003 | |||
| RH / RH | 0,00 | 0,00 | 0,42 | -19,43 | 0,0023 | -0,0008 | |||
| AAPL / Apple Inc. | 0,00 | 0,26 | 0,0014 | 0,0014 | |||||
| XOM / Exxon Mobil Corporation | 0,00 | -99,01 | 0,22 | -98,82 | 0,0012 | -0,0465 | |||
| INTC / Intel Corporation | 0,00 | -100,00 | 0,00 | 0,0000 | |||||
| SKX / Skechers U.S.A., Inc. | 0,00 | -100,00 | 0,00 | 0,0000 | |||||
| HIW / Highwoods Properties, Inc. | 0,00 | -100,00 | 0,00 | 0,0000 | |||||
| FRT / Federal Realty Investment Trust | 0,00 | -100,00 | 0,00 | 0,0000 | |||||
| YOU / Clear Secure, Inc. | 0,00 | -100,00 | 0,00 | 0,0000 |