Statistiques de base
| Profil de l'initié | APG Asset Management US Inc. |
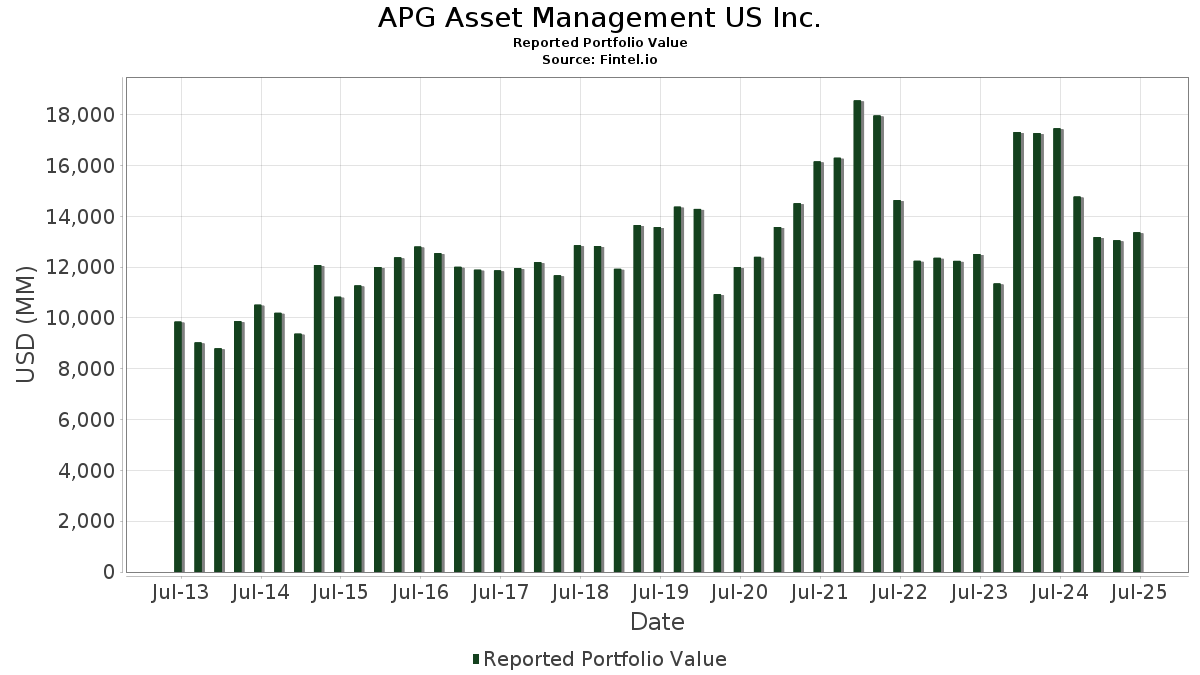
| Valeur du portefeuille | $ 13 369 301 432 |
| Positions actuelles | 189 |
Dernières positions, performances, ASG (à partir des dépôts 13F, 13D)
APG Asset Management US Inc. a déclaré un total de 189 positions dans ses derniers dépôts auprès de la SEC. La valeur la plus récente du portefeuille est calculée à 13 369 301 432 USD. Les actifs sous gestion réels (ASG) sont cette valeur plus les liquidités (qui ne sont pas divulguées). Les principales positions de APG Asset Management US Inc. sont Prologis, Inc. (US:PLD) , Digital Realty Trust, Inc. (US:DLR) , Equinix, Inc. (US:EQIX) , Equity Residential (US:EQR) , and Ventas, Inc. (US:VTR) . Les principales industries de APG Asset Management US Inc. sont "Oil And Gas Extraction" (sic 13) , "Real Estate" (sic 65) , and "Electronic And Other Electrical Equipment And Components, Except Computer Equipment" (sic 36) .
Meilleures augmentations ce trimestre
Nous utilisons la variation de l'allocation du portefeuille car il s'agit de l'indicateur le plus significatif. Les changements peuvent être dus à des transactions ou à des variations de prix des actions.
| Titre | Actions (en millions) |
Valeur ($ en millions) |
% du portefeuille | ΔPortefeuille % |
|---|---|---|---|---|
| 4,43 | 484,16 | 3,6214 | 2,7848 | |
| 8,62 | 1 475,38 | 11,0356 | 1,3964 | |
| 5,41 | 433,60 | 3,2432 | 0,4187 | |
| 0,27 | 45,07 | 0,3371 | 0,2160 | |
| 0,21 | 60,38 | 0,4517 | 0,1773 | |
| 2,99 | 54,76 | 0,4096 | 0,1137 | |
| 8,64 | 499,31 | 3,7347 | 0,1091 | |
| 0,24 | 36,09 | 0,2699 | 0,1022 | |
| 11,86 | 187,43 | 1,4019 | 0,0857 | |
| 0,97 | 37,11 | 0,2776 | 0,0654 |
Principales baisses ce trimestre
Nous utilisons la variation de l'allocation du portefeuille car il s'agit de l'indicateur le plus significatif. Les changements peuvent être dus à des transactions ou à des variations de prix des actions.
| Titre | Actions (en millions) |
Valeur ($ en millions) |
% du portefeuille | ΔPortefeuille % |
|---|---|---|---|---|
| 19,63 | 2 092,16 | 15,6489 | -1,0795 | |
| 6,69 | 498,57 | 3,7292 | -1,0417 | |
| 11,76 | 739,26 | 5,5295 | -0,6455 | |
| 11,43 | 768,82 | 5,7507 | -0,5408 | |
| 13,51 | 224,92 | 1,6824 | -0,5033 | |
| 3,08 | 459,25 | 3,4351 | -0,5031 | |
| 1,21 | 959,43 | 7,1763 | -0,3027 | |
| 17,22 | 564,56 | 4,2228 | -0,1706 | |
| 0,14 | 4,94 | 0,0370 | -0,1454 | |
| 2,17 | 647,04 | 4,8397 | -0,1079 |
Déclarations 13D/G
Il s'agit d'une liste des déclarations 13D et 13G déposées au cours de la dernière année (le cas échéant). Cliquez sur l'icône du lien pour voir l'historique complet des transactions. Les lignes vertes indiquent de nouvelles positions. Les lignes rouges indiquent des positions fermées.
| Date de dépôt | Formulaire | Titre | Actions précédentes |
Actions actuelles |
ΔActions % | % de participation |
% ΔParticipation | |
|---|---|---|---|---|---|---|---|---|
| 2025-05-14 | COLD / Americold Realty Trust, Inc. | 17 081 401 | 13 508 710 | -20,92 | 4,80 | -20,00 | ||
| 2025-05-14 | BCPC / Balchem Corporation | 1 993 527 | 1 201 674 | -39,72 | 3,70 | -39,34 | ||
| 2025-05-14 | WDFC / WD-40 Company | 1 020 273 | 324 004 | -68,24 | 2,40 | -68,00 | ||
| 2025-02-13 | JKHY / Jack Henry & Associates, Inc. | 4 053 278 | 2 421 623 | -40,26 | 3,30 | -40,00 | ||
| 2025-02-13 | CUZ / Cousins Properties Incorporated | 8 064 093 | 7 853 306 | -2,61 | 4,70 | -11,32 | ||
| 2025-01-07 | MSA / MSA Safety Incorporated | 4 513 317 | 1 883 612 | -58,27 | 4,80 | -57,89 | ||
| 2024-11-14 | MTN / Vail Resorts, Inc. | 1 946 860 | 1 377 990 | -29,22 | 3,60 | -29,41 | ||
| 2024-11-14 | ALLE / Allegion plc | 5 788 143 | 3 643 126 | -37,06 | 4,10 | -36,92 |
Déclarations 13F et dépôts de fonds
Ce formulaire a été déposé le 2025-08-12 pour la période de déclaration 2025-06-30. Cliquez sur l'icône du lien pour voir l'historique complet des transactions.
Mettre à niveau pour débloquer les données premium et exporter vers Excel ![]() .
.
| Titre | Type | Prix moyen de l'action | Actions (en millions) |
ΔActions (%) |
ΔActions (%) |
Valeur ($ en millions) |
Portefeuille (%) |
ΔPortefeuille (%) |
|
|---|---|---|---|---|---|---|---|---|---|
| PLD / Prologis, Inc. | 19,63 | 0,19 | 2 092,16 | -4,19 | 15,6489 | -1,0795 | |||
| DLR / Digital Realty Trust, Inc. | 8,62 | 0,00 | 1 475,38 | 17,25 | 11,0356 | 1,3964 | |||
| EQIX / Equinix, Inc. | 1,21 | 0,94 | 959,43 | -1,73 | 7,1763 | -0,3027 | |||
| EQR / Equity Residential | 11,43 | -0,79 | 768,82 | -6,39 | 5,7507 | -0,5408 | |||
| VTR / Ventas, Inc. | 11,76 | 1,05 | 739,26 | -8,29 | 5,5295 | -0,6455 | |||
| PSA / Public Storage | 2,17 | 0,44 | 647,04 | 0,18 | 4,8397 | -0,1079 | |||
| INVH / Invitation Homes Inc. | 17,22 | 3,76 | 564,56 | -1,56 | 4,2228 | -0,1706 | |||
| O / Realty Income Corporation | 8,64 | 4,31 | 499,31 | 5,50 | 3,7347 | 0,1091 | |||
| ARE / Alexandria Real Estate Equities, Inc. | 6,69 | -2,04 | 498,57 | -19,94 | 3,7292 | -1,0417 | |||
| BXP / Boston Properties, Inc. | 7,17 | -0,65 | 488,35 | 1,07 | 3,6527 | -0,0488 | |||
| LQD / iShares Trust - iShares iBoxx $ Investment Grade Corporate Bond ETF | 4,43 | 340,60 | 484,16 | 343,36 | 3,6214 | 2,7848 | |||
| MAA / Mid-America Apartment Communities, Inc. | 3,08 | 0,48 | 459,25 | -10,67 | 3,4351 | -0,5031 | |||
| HYG / iShares Trust - iShares iBoxx $ High Yield Corporate Bond ETF | 5,41 | 15,43 | 433,60 | 17,60 | 3,2432 | 0,4187 | |||
| EXR / Extra Space Storage Inc. | 2,53 | 0,00 | 381,30 | 1,80 | 2,8521 | -0,0173 | |||
| KIM / Kimco Realty Corporation | 12,65 | 0,00 | 267,89 | 0,19 | 2,0037 | -0,0446 | |||
| CUZ / Cousins Properties Incorporated | 7,86 | 1,59 | 234,41 | 3,04 | 1,7533 | 0,0106 | |||
| WELL / Welltower Inc. | 1,52 | 7,10 | 230,69 | 5,33 | 1,7255 | 0,0477 | |||
| COLD / Americold Realty Trust, Inc. | 13,51 | 0,00 | 224,92 | -21,16 | 1,6824 | -0,5033 | |||
| HR / Healthcare Realty Trust Incorporated | 11,86 | 16,81 | 187,43 | 9,08 | 1,4019 | 0,0857 | |||
| KRC / Kilroy Realty Corporation | 4,29 | -7,02 | 148,18 | -2,20 | 1,1084 | -0,0524 | |||
| REG / Regency Centers Corporation | 2,02 | 0,00 | 143,93 | -3,34 | 1,0765 | -0,0642 | |||
| VICI / VICI Properties Inc. | 3,45 | 0,00 | 113,81 | 1,66 | 0,8513 | -0,0063 | |||
| SPG / Simon Property Group, Inc. | 0,54 | -3,88 | 88,77 | -5,15 | 0,6640 | -0,0530 | |||
| UDR / UDR, Inc. | 1,65 | 0,00 | 67,23 | -9,54 | 0,5029 | -0,0665 | |||
| ESS / Essex Property Trust, Inc. | 0,21 | 80,85 | 60,38 | 68,57 | 0,4517 | 0,1773 | |||
| IRM / Iron Mountain Incorporated | 0,58 | 0,00 | 58,18 | 15,01 | 0,4352 | 0,0476 | |||
| SBRA / Sabra Health Care REIT, Inc. | 2,99 | 35,60 | 54,76 | 41,80 | 0,4096 | 0,1137 | |||
| SUI / Sun Communities, Inc. | 0,41 | 0,00 | 52,64 | -0,59 | 0,3938 | -0,0119 | |||
| WPC / W. P. Carey Inc. | 0,81 | 6,87 | 51,16 | 6,81 | 0,3827 | 0,0157 | |||
| EGP / EastGroup Properties, Inc. | 0,27 | 198,89 | 45,07 | 185,09 | 0,3371 | 0,2160 | |||
| DOC / Healthpeak Properties, Inc. | 2,27 | -14,58 | 40,65 | -23,71 | 0,3040 | -0,1041 | |||
| VNO / Vornado Realty Trust | 0,97 | 32,40 | 37,11 | 33,98 | 0,2776 | 0,0654 | |||
| NVDD / Direxion Shares ETF Trust - Direxion Daily NVDA Bear 1X Shares | 0,24 | 18,45 | 36,09 | 64,85 | 0,2699 | 0,1022 | |||
| AVGO / Broadcom Inc. | 0,12 | -16,04 | 32,67 | 31,91 | 0,2444 | 0,0546 | |||
| ADC / Agree Realty Corporation | 0,44 | 20,81 | 31,70 | 14,49 | 0,2371 | 0,0250 | |||
| BKLN / Invesco Exchange-Traded Fund Trust II - Invesco Senior Loan ETF | 1,48 | 0,00 | 30,98 | 0,96 | 0,2317 | -0,0033 | |||
| BRX / Brixmor Property Group Inc. | 1,14 | 0,00 | 29,79 | -1,85 | 0,2228 | -0,0097 | |||
| FRT / Federal Realty Investment Trust | 0,31 | -17,71 | 29,63 | -20,06 | 0,2216 | -0,0623 | |||
| MSFT / Microsoft Corporation | 0,06 | -3,60 | 29,45 | 24,11 | 0,2203 | 0,0385 | |||
| EPRT / Essential Properties Realty Trust, Inc. | 0,88 | -2,99 | 28,19 | -4,30 | 0,2108 | -0,0148 | |||
| SKT / Tanger Inc. | 0,89 | 44,48 | 27,46 | 31,49 | 0,2054 | 0,0454 | |||
| AVB / AvalonBay Communities, Inc. | 0,13 | -12,39 | 25,90 | -16,97 | 0,1937 | -0,0453 | |||
| RHP / Ryman Hospitality Properties, Inc. | 0,23 | 12,60 | 23,00 | 23,47 | 0,1721 | 0,0293 | |||
| AKR / Acadia Realty Trust | 1,05 | 0,00 | 19,61 | -10,18 | 0,1467 | -0,0206 | |||
| MAC / The Macerich Company | 1,04 | -28,63 | 17,12 | -31,23 | 0,1281 | -0,0627 | |||
| UE / Urban Edge Properties | 0,89 | 0,00 | 16,83 | -0,84 | 0,1259 | -0,0041 | |||
| EPR / EPR Properties | 0,29 | 88,10 | 16,79 | 110,07 | 0,1256 | 0,0644 | |||
| NTST / NETSTREIT Corp. | 0,88 | 0,00 | 15,00 | 7,98 | 0,1122 | 0,0058 | |||
| GRPU / Granite Real Estate Investment Trust | 0,25 | 0,00 | 12,67 | 9,15 | 0,0947 | 0,0058 | |||
| CURB / Curbline Properties Corp. | 0,55 | 0,00 | 12,53 | -7,65 | 0,0937 | -0,0102 | |||
| LLY / Eli Lilly and Company | 0,01 | 0,00 | 11,57 | -3,64 | 0,0866 | -0,0054 | |||
| ORCL / Oracle Corporation | 0,05 | 0,00 | 11,46 | 54,28 | 0,0857 | 0,0288 | |||
| NSA / National Storage Affiliates Trust | 0,34 | 0,00 | 11,27 | -16,21 | 0,0843 | -0,0187 | |||
| AHR / American Healthcare REIT, Inc. | 0,29 | 0,00 | 10,61 | 17,67 | 0,0794 | 0,0103 | |||
| LINE / Lineage, Inc. | 0,22 | 80,57 | 9,30 | 37,23 | 0,0696 | 0,0176 | |||
| CRM / Salesforce, Inc. | 0,03 | 6,27 | 9,28 | 6,94 | 0,0694 | 0,0029 | |||
| SITC / SITE Centers Corp. | 0,80 | 0,00 | 9,21 | -9,75 | 0,0689 | -0,0093 | |||
| ANET / Arista Networks Inc | 0,09 | 61,92 | 8,76 | 104,05 | 0,0655 | 0,0326 | |||
| HST / Host Hotels & Resorts, Inc. | 0,53 | -50,03 | 8,34 | -45,08 | 0,0624 | -0,0540 | |||
| UMH / UMH Properties, Inc. | 0,48 | 0,00 | 8,19 | -9,26 | 0,0613 | -0,0079 | |||
| CTO / CTO Realty Growth, Inc. | 0,46 | 0,00 | 8,05 | -9,56 | 0,0602 | -0,0080 | |||
| APH / Amphenol Corporation | 0,08 | 127,04 | 8,05 | 234,72 | 0,0602 | 0,0418 | |||
| INTU / Intuit Inc. | 0,01 | 0,00 | 7,66 | 27,02 | 0,0573 | 0,0111 | |||
| ABBV / AbbVie Inc. | 0,04 | 0,75 | 6,99 | -7,20 | 0,0523 | -0,0054 | |||
| NOW / ServiceNow, Inc. | 0,01 | 0,00 | 6,46 | 24,68 | 0,0483 | 0,0086 | |||
| UNH / UnitedHealth Group Incorporated | 0,02 | 0,00 | 6,22 | -37,66 | 0,0466 | -0,0299 | |||
| PLTR / Palantir Technologies Inc. | 0,04 | -13,34 | 5,86 | 33,74 | 0,0438 | 0,0103 | |||
| AMD / Advanced Micro Devices, Inc. | 0,04 | -8,49 | 5,76 | 21,19 | 0,0431 | 0,0067 | |||
| ACN / Accenture plc | 0,02 | 5,36 | 0,0401 | 0,0401 | |||||
| VRE / Veris Residential, Inc. | 0,34 | 0,00 | 4,96 | -13,18 | 0,0371 | -0,0067 | |||
| REXR / Rexford Industrial Realty, Inc. | 0,14 | -77,53 | 4,94 | -79,24 | 0,0370 | -0,1454 | |||
| LRCX / Lam Research Corporation | 0,05 | 24,94 | 4,83 | 66,08 | 0,0362 | 0,0139 | |||
| SNPS / Synopsys, Inc. | 0,01 | 51,42 | 4,70 | 81,23 | 0,0352 | 0,0153 | |||
| PANW / Palo Alto Networks, Inc. | 0,02 | 0,00 | 4,64 | 15,35 | 0,0347 | 0,0039 | |||
| ADBE / Adobe Inc. | 0,01 | 0,00 | 4,48 | 2,33 | 0,0335 | -0,0000 | |||
| QCOM / QUALCOMM Incorporated | 0,03 | -12,12 | 4,47 | -8,47 | 0,0334 | -0,0040 | |||
| SHOP / Shopify Inc. | 0,04 | 0,00 | 4,39 | 17,95 | 0,0328 | 0,0043 | |||
| MRK / Merck & Co., Inc. | 0,05 | 0,00 | 4,29 | -6,09 | 0,0321 | -0,0029 | |||
| CRWD / CrowdStrike Holdings, Inc. | 0,01 | 0,00 | 4,28 | 35,80 | 0,0320 | 0,0079 | |||
| MU / Micron Technology, Inc. | 0,03 | 0,00 | 4,22 | 36,27 | 0,0316 | 0,0078 | |||
| ISRG / Intuitive Surgical, Inc. | 0,01 | 1,43 | 4,01 | 9,93 | 0,0300 | 0,0020 | |||
| TMO / Thermo Fisher Scientific Inc. | 0,01 | 0,00 | 3,33 | -12,72 | 0,0249 | -0,0043 | |||
| AMGN / Amgen Inc. | 0,01 | 0,00 | 3,23 | -5,37 | 0,0241 | -0,0020 | |||
| BSX / Boston Scientific Corporation | 0,03 | 0,00 | 3,19 | 3,51 | 0,0239 | 0,0002 | |||
| TXN / Texas Instruments Incorporated | 0,02 | -32,92 | 3,18 | -20,68 | 0,0238 | -0,0069 | |||
| PFE / Pfizer Inc. | 0,12 | 0,00 | 2,93 | 2,05 | 0,0219 | -0,0001 | |||
| GILD / Gilead Sciences, Inc. | 0,03 | 0,00 | 2,87 | 0,38 | 0,0215 | -0,0004 | |||
| SYK / Stryker Corporation | 0,01 | 0,00 | 2,81 | 6,28 | 0,0210 | 0,0008 | |||
| DHR / Danaher Corporation | 0,01 | 0,00 | 2,70 | 0,37 | 0,0202 | -0,0004 | |||
| KLAC / KLA Corporation | 0,00 | -28,93 | 2,64 | -6,42 | 0,0198 | -0,0019 | |||
| CDNS / Cadence Design Systems, Inc. | 0,01 | 0,00 | 2,55 | 19,59 | 0,0191 | 0,0027 | |||
| VRTX / Vertex Pharmaceuticals Incorporated | 0,01 | 0,00 | 2,41 | -6,73 | 0,0180 | -0,0018 | |||
| MDT / Medtronic plc | 0,03 | 2,37 | 0,0177 | 0,0177 | |||||
| CSCO / Cisco Systems, Inc. | 0,03 | -68,21 | 2,18 | -64,46 | 0,0163 | -0,0307 | |||
| DDOG / Datadog, Inc. | 0,02 | 84,58 | 2,16 | 141,82 | 0,0161 | 0,0093 | |||
| MSTR / Strategy Inc | 0,01 | 0,00 | 2,15 | 22,02 | 0,0161 | 0,0026 | |||
| ADSK / Autodesk, Inc. | 0,01 | 0,00 | 2,11 | 17,82 | 0,0158 | 0,0021 | |||
| FTNT / Fortinet, Inc. | 0,02 | 0,00 | 2,10 | 5,97 | 0,0157 | 0,0005 | |||
| INTC / Intel Corporation | 0,09 | -23,07 | 2,09 | -20,30 | 0,0156 | -0,0044 | |||
| MRVL / Marvell Technology, Inc. | 0,03 | 0,00 | 2,03 | 21,66 | 0,0152 | 0,0024 | |||
| BMY / Bristol-Myers Squibb Company | 0,04 | 0,00 | 1,99 | -20,21 | 0,0149 | -0,0042 | |||
| AMAT / Applied Materials, Inc. | 0,01 | -51,22 | 1,98 | -38,48 | 0,0148 | -0,0098 | |||
| SNOW / Snowflake Inc. | 0,01 | 0,00 | 1,97 | 44,38 | 0,0147 | 0,0043 | |||
| ROP / Roper Technologies, Inc. | 0,00 | 0,00 | 1,93 | -3,06 | 0,0145 | -0,0008 | |||
| NTNX / Nutanix, Inc. | 0,03 | 0,00 | 1,90 | 7,72 | 0,0142 | 0,0007 | |||
| ELV / Elevance Health, Inc. | 0,00 | 0,00 | 1,90 | -8,54 | 0,0142 | -0,0017 | |||
| MCK / McKesson Corporation | 0,00 | -2,80 | 1,90 | 4,99 | 0,0142 | 0,0003 | |||
| CI / The Cigna Group | 0,01 | -2,44 | 1,88 | -1,46 | 0,0141 | -0,0006 | |||
| CVS / CVS Health Corporation | 0,03 | 0,00 | 1,81 | 2,32 | 0,0135 | -0,0000 | |||
| NXPI / NXP Semiconductors N.V. | 0,01 | 0,00 | 1,74 | 16,43 | 0,0130 | 0,0016 | |||
| WDAY / Workday, Inc. | 0,01 | 0,00 | 1,60 | 2,04 | 0,0120 | -0,0000 | |||
| TEL / TE Connectivity plc | 0,01 | 0,00 | 1,60 | 21,00 | 0,0120 | 0,0018 | |||
| HCA / HCA Healthcare, Inc. | 0,00 | -4,03 | 1,50 | 8,18 | 0,0112 | 0,0006 | |||
| ZTS / Zoetis Inc. | 0,01 | 0,00 | 1,49 | -1,65 | 0,0111 | -0,0005 | |||
| FICO / Fair Isaac Corporation | 0,00 | 0,00 | 1,39 | -1,35 | 0,0104 | -0,0004 | |||
| GLW / Corning Incorporated | 0,03 | 0,00 | 1,35 | 15,45 | 0,0101 | 0,0011 | |||
| CHKP / Check Point Software Technologies Ltd. | 0,01 | 112,11 | 1,28 | 103,33 | 0,0096 | 0,0048 | |||
| CTSH / Cognizant Technology Solutions Corporation | 0,02 | 0,00 | 1,26 | 5,29 | 0,0094 | 0,0002 | |||
| DELL / Dell Technologies Inc. | 0,01 | 0,00 | 1,22 | 32,35 | 0,0091 | 0,0021 | |||
| REGN / Regeneron Pharmaceuticals, Inc. | 0,00 | 0,00 | 1,20 | -13,31 | 0,0090 | -0,0016 | |||
| MPWR / Monolithic Power Systems, Inc. | 0,00 | 0,00 | 1,10 | 28,50 | 0,0082 | 0,0017 | |||
| DT / Dynatrace, Inc. | 0,02 | 0,00 | 1,08 | 13,76 | 0,0080 | 0,0008 | |||
| BDX / Becton, Dickinson and Company | 0,01 | 0,00 | 1,06 | -21,41 | 0,0079 | -0,0024 | |||
| TEAM / Atlassian Corporation | 0,01 | 0,00 | 1,05 | -4,04 | 0,0078 | -0,0005 | |||
| IT / Gartner, Inc. | 0,00 | 0,00 | 0,99 | -1,69 | 0,0074 | -0,0003 | |||
| ANSS / ANSYS, Inc. | 0,00 | 0,00 | 0,97 | 10,09 | 0,0073 | 0,0005 | |||
| STX / Seagate Technology Holdings plc | 0,01 | 0,00 | 0,96 | 71,61 | 0,0072 | 0,0029 | |||
| EW / Edwards Lifesciences Corporation | 0,01 | 0,00 | 0,96 | 7,38 | 0,0072 | 0,0003 | |||
| OKTA / Okta, Inc. | 0,01 | 0,00 | 0,96 | -5,91 | 0,0072 | -0,0006 | |||
| ALC / Alcon Inc. | 0,01 | 0,00 | 0,92 | -4,36 | 0,0069 | -0,0005 | |||
| VEEV / Veeva Systems Inc. | 0,00 | 0,00 | 0,90 | 24,17 | 0,0067 | 0,0012 | |||
| HUBS / HubSpot, Inc. | 0,00 | 0,00 | 0,86 | -4,14 | 0,0064 | -0,0004 | |||
| NET / Cloudflare, Inc. | 0,00 | 0,00 | 0,85 | 60,19 | 0,0064 | 0,0023 | |||
| ZS / Zscaler, Inc. | 0,00 | 0,00 | 0,84 | 52,83 | 0,0063 | 0,0021 | |||
| CAH / Cardinal Health, Inc. | 0,01 | 0,00 | 0,82 | 20,00 | 0,0061 | 0,0009 | |||
| JBL / Jabil Inc. | 0,00 | 0,00 | 0,81 | 58,43 | 0,0060 | 0,0021 | |||
| VRSN / VeriSign, Inc. | 0,00 | 0,00 | 0,80 | 13,33 | 0,0060 | 0,0006 | |||
| HPE / Hewlett Packard Enterprise Company | 0,04 | 0,00 | 0,80 | 31,03 | 0,0060 | 0,0013 | |||
| TYL / Tyler Technologies, Inc. | 0,00 | 0,00 | 0,79 | 0,89 | 0,0059 | -0,0001 | |||
| GDDY / GoDaddy Inc. | 0,00 | 0,00 | 0,79 | -1,37 | 0,0059 | -0,0002 | |||
| RMD / ResMed Inc. | 0,00 | 0,00 | 0,78 | 15,28 | 0,0058 | 0,0006 | |||
| CDW / CDW Corporation | 0,00 | 0,00 | 0,76 | 11,75 | 0,0057 | 0,0005 | |||
| TDY / Teledyne Technologies Incorporated | 0,00 | 0,00 | 0,75 | 2,59 | 0,0056 | 0,0000 | |||
| GEHC / GE HealthCare Technologies Inc. | 0,01 | 0,00 | 0,72 | -4,53 | 0,0054 | -0,0004 | |||
| A / Agilent Technologies, Inc. | 0,01 | 0,00 | 0,72 | 5,61 | 0,0053 | 0,0002 | |||
| ON / ON Semiconductor Corporation | 0,01 | 0,00 | 0,70 | 33,52 | 0,0052 | 0,0012 | |||
| WDC / Western Digital Corporation | 0,01 | 0,00 | 0,69 | 56,31 | 0,0052 | 0,0018 | |||
| DXCM / DexCom, Inc. | 0,01 | 0,00 | 0,69 | 24,24 | 0,0052 | 0,0009 | |||
| NTAP / NetApp, Inc. | 0,01 | 0,00 | 0,69 | 19,27 | 0,0051 | 0,0007 | |||
| GIB / CGI Inc. | 0,01 | 0,00 | 0,67 | 4,03 | 0,0050 | 0,0001 | |||
| PTC / PTC Inc. | 0,00 | 0,00 | 0,65 | 10,85 | 0,0049 | 0,0004 | |||
| HUM / Humana Inc. | 0,00 | 0,00 | 0,63 | -4,56 | 0,0047 | -0,0003 | |||
| CNC / Centene Corporation | 0,01 | 0,00 | 0,62 | -6,39 | 0,0046 | -0,0004 | |||
| IQV / IQVIA Holdings Inc. | 0,00 | 0,00 | 0,61 | -5,12 | 0,0046 | -0,0004 | |||
| ZM / Zoom Communications Inc. | 0,01 | 0,00 | 0,61 | 4,83 | 0,0045 | 0,0001 | |||
| TWLO / Twilio Inc. | 0,00 | 0,00 | 0,56 | 19,53 | 0,0042 | 0,0006 | |||
| MTD / Mettler-Toledo International Inc. | 0,00 | 0,00 | 0,53 | 4,32 | 0,0040 | 0,0001 | |||
| GEN / Gen Digital Inc. | 0,02 | 0,00 | 0,52 | 11,37 | 0,0039 | 0,0003 | |||
| PSTG / Pure Storage, Inc. | 0,01 | 0,00 | 0,52 | 21,75 | 0,0039 | 0,0006 | |||
| ZBRA / Zebra Technologies Corporation | 0,00 | 0,00 | 0,51 | 11,55 | 0,0038 | 0,0003 | |||
| CYBR / CyberArk Software Ltd. | 0,00 | 0,00 | 0,50 | 12,53 | 0,0038 | 0,0003 | |||
| STE / STERIS plc | 0,00 | 0,00 | 0,49 | 7,39 | 0,0037 | 0,0002 | |||
| DOCU / DocuSign, Inc. | 0,01 | 0,00 | 0,49 | -6,44 | 0,0037 | -0,0004 | |||
| MDB / MongoDB, Inc. | 0,00 | 0,00 | 0,45 | 16,75 | 0,0034 | 0,0004 | |||
| WAT / Waters Corporation | 0,00 | 0,00 | 0,44 | 0,46 | 0,0033 | -0,0001 | |||
| PODD / Insulet Corporation | 0,00 | 0,00 | 0,43 | 13,91 | 0,0033 | 0,0003 | |||
| DGX / Quest Diagnostics Incorporated | 0,00 | 0,00 | 0,41 | 5,91 | 0,0031 | 0,0001 | |||
| ZBH / Zimmer Biomet Holdings, Inc. | 0,00 | 0,00 | 0,40 | -16,31 | 0,0030 | -0,0007 | |||
| BIIB / Biogen Inc. | 0,00 | 0,00 | 0,39 | -1,51 | 0,0029 | -0,0001 | |||
| TEVA / Teva Pharmaceutical Industries Limited - Depositary Receipt (Common Stock) | 0,02 | 0,00 | 0,39 | 8,96 | 0,0029 | 0,0002 | |||
| MOH / Molina Healthcare, Inc. | 0,00 | 0,00 | 0,37 | -6,57 | 0,0028 | -0,0003 | |||
| MNDY / monday.com Ltd. | 0,00 | 0,00 | 0,36 | 15,86 | 0,0027 | 0,0003 | |||
| WST / West Pharmaceutical Services, Inc. | 0,00 | 0,00 | 0,33 | 0,91 | 0,0025 | -0,0000 | |||
| BAX / Baxter International Inc. | 0,01 | 0,00 | 0,33 | -8,10 | 0,0025 | -0,0003 | |||
| ILMN / Illumina, Inc. | 0,00 | 0,00 | 0,32 | 25,29 | 0,0024 | 0,0004 | |||
| HOLX / Hologic, Inc. | 0,00 | 0,00 | 0,31 | 6,46 | 0,0023 | 0,0001 | |||
| MCHP / Microchip Technology Incorporated | 0,00 | -74,00 | 0,31 | -61,60 | 0,0023 | -0,0038 | |||
| ALGN / Align Technology, Inc. | 0,00 | 0,00 | 0,28 | 22,94 | 0,0021 | 0,0004 | |||
| RPRX / Royalty Pharma plc | 0,01 | 0,00 | 0,28 | 15,10 | 0,0021 | 0,0002 | |||
| DSGX / The Descartes Systems Group Inc. | 0,00 | 0,00 | 0,27 | -0,37 | 0,0020 | -0,0001 | |||
| IOT / Samsara Inc. | 0,01 | 0,00 | 0,27 | 1,13 | 0,0020 | -0,0000 | |||
| WIX / Wix.com Ltd. | 0,00 | 0,00 | 0,27 | -1,84 | 0,0020 | -0,0001 | |||
| NBIX / Neurocrine Biosciences, Inc. | 0,00 | 0,00 | 0,27 | 19,73 | 0,0020 | 0,0003 | |||
| UTHR / United Therapeutics Corporation | 0,00 | 0,00 | 0,25 | -5,24 | 0,0019 | -0,0002 | |||
| RVTY / Revvity, Inc. | 0,00 | 0,00 | 0,25 | -4,91 | 0,0019 | -0,0001 | |||
| SOLV / Solventum Corporation | 0,00 | 0,00 | 0,24 | 2,16 | 0,0018 | -0,0000 | |||
| INCY / Incyte Corporation | 0,00 | 0,00 | 0,23 | 12,62 | 0,0017 | 0,0002 | |||
| BMRN / BioMarin Pharmaceutical Inc. | 0,00 | 0,00 | 0,22 | -17,23 | 0,0017 | -0,0004 | |||
| AVTR / Avantor, Inc. | 0,01 | 0,00 | 0,20 | -11,76 | 0,0015 | -0,0002 | |||
| EPAM / EPAM Systems, Inc. | 0,00 | -100,00 | 0,00 | 0,0000 | |||||
| SMCI / Super Micro Computer, Inc. | 0,00 | -100,00 | 0,00 | 0,0000 | |||||
| TER / Teradyne, Inc. | 0,00 | -100,00 | 0,00 | 0,0000 | |||||
| BSY / Bentley Systems, Incorporated | 0,00 | -100,00 | 0,00 | 0,0000 | |||||
| SWKS / Skyworks Solutions, Inc. | 0,00 | -100,00 | 0,00 | 0,0000 | |||||
| IRT / Independence Realty Trust, Inc. | 0,00 | -100,00 | 0,00 | 0,0000 | |||||
| AKAM / Akamai Technologies, Inc. | 0,00 | -100,00 | 0,00 | 0,0000 | |||||
| SHO / Sunstone Hotel Investors, Inc. | 0,00 | -100,00 | 0,00 | 0,0000 | |||||
| TRMB / Trimble Inc. | 0,00 | -100,00 | 0,00 | 0,0000 | |||||
| VTRS / Viatris Inc. | 0,00 | -100,00 | 0,00 | 0,0000 | |||||
| MSI / Motorola Solutions, Inc. | 0,00 | -100,00 | 0,00 | 0,0000 | |||||
| KEYS / Keysight Technologies, Inc. | 0,00 | -100,00 | 0,00 | 0,0000 | |||||
| CUBE / CubeSmart | 0,00 | -100,00 | 0,00 | 0,0000 | |||||
| MANH / Manhattan Associates, Inc. | 0,00 | -100,00 | 0,00 | 0,0000 | |||||
| APP / AppLovin Corporation | 0,00 | -100,00 | 0,00 | 0,0000 | |||||
| OTEX / Open Text Corporation | 0,00 | -100,00 | 0,00 | 0,0000 |