Statistiques de base
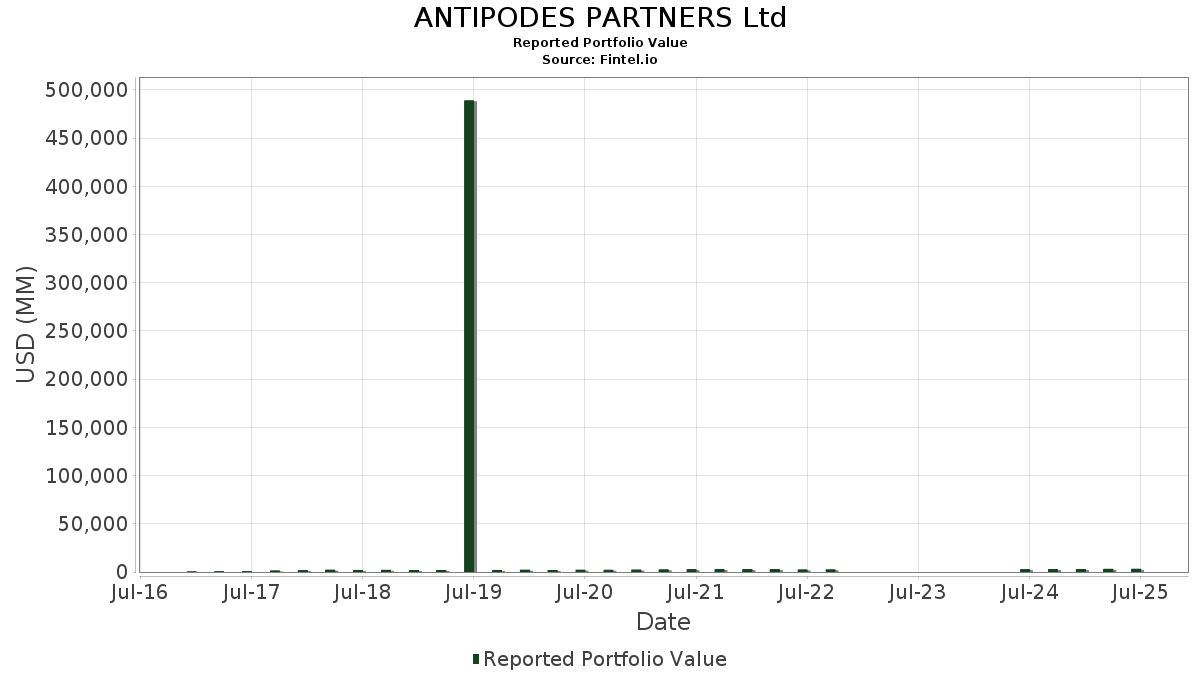
| Valeur du portefeuille | $ 3 224 241 286 |
| Positions actuelles | 105 |
Dernières positions, performances, ASG (à partir des dépôts 13F, 13D)
ANTIPODES PARTNERS Ltd a déclaré un total de 105 positions dans ses derniers dépôts auprès de la SEC. La valeur la plus récente du portefeuille est calculée à 3 224 241 286 USD. Les actifs sous gestion réels (ASG) sont cette valeur plus les liquidités (qui ne sont pas divulguées). Les principales positions de ANTIPODES PARTNERS Ltd sont Microsoft Corporation (US:MSFT) , Alphabet Inc. (US:GOOGL) , Capital One Financial Corporation (US:COF) , Amazon.com, Inc. (US:AMZN) , and Barrick Mining Corporation (US:B) . Les nouvelles positions de ANTIPODES PARTNERS Ltd incluent Barrick Mining Corporation (US:B) , Advanced Micro Devices, Inc. (US:AMD) , Brinker International, Inc. (US:EAT) , Johnson & Johnson (US:JNJ) , and PulteGroup, Inc. (US:PHM) . Les principales industries de ANTIPODES PARTNERS Ltd sont "Electric, Gas, And Sanitary Services " (sic 49) , "Security And Commodity Brokers, Dealers, Exchanges, And Services" (sic 62) , and "Depository Institutions" (sic 60) .
Meilleures augmentations ce trimestre
Nous utilisons la variation de l'allocation du portefeuille car il s'agit de l'indicateur le plus significatif. Les changements peuvent être dus à des transactions ou à des variations de prix des actions.
| Titre | Actions (en millions) |
Valeur ($ en millions) |
% du portefeuille | ΔPortefeuille % |
|---|---|---|---|---|
| 8,13 | 169,30 | 5,2509 | 5,2509 | |
| 0,70 | 99,74 | 3,0934 | 3,0934 | |
| 0,33 | 78,02 | 2,4198 | 2,4198 | |
| 0,82 | 62,51 | 1,9387 | 1,9387 | |
| 0,31 | 55,72 | 1,7283 | 1,7283 | |
| 0,48 | 238,75 | 7,4049 | 1,4290 | |
| 1,27 | 134,33 | 4,1664 | 1,3219 | |
| 2,53 | 34,78 | 1,0787 | 1,0681 | |
| 0,15 | 23,22 | 0,7203 | 0,7203 | |
| 0,16 | 43,88 | 1,3610 | 0,6461 |
Principales baisses ce trimestre
Nous utilisons la variation de l'allocation du portefeuille car il s'agit de l'indicateur le plus significatif. Les changements peuvent être dus à des transactions ou à des variations de prix des actions.
| Titre | Actions (en millions) |
Valeur ($ en millions) |
% du portefeuille | ΔPortefeuille % |
|---|---|---|---|---|
| 0,61 | 14,58 | 0,4521 | -1,1574 | |
| 1,81 | 143,63 | 4,4546 | -1,0779 | |
| 6,02 | 41,71 | 1,2938 | -1,0271 | |
| 0,06 | 3,95 | 0,1226 | -0,9670 | |
| 0,01 | 1,61 | 0,0498 | -0,9372 | |
| 1,13 | 117,41 | 3,6415 | -0,7845 | |
| 0,73 | 119,29 | 3,6997 | -0,6885 | |
| 0,95 | 55,53 | 1,7224 | -0,6538 | |
| 1,13 | 99,58 | 3,0886 | -0,4340 | |
| 0,46 | 26,81 | 0,8315 | -0,4253 |
Déclarations 13D/G
Il s'agit d'une liste des déclarations 13D et 13G déposées au cours de la dernière année (le cas échéant). Cliquez sur l'icône du lien pour voir l'historique complet des transactions. Les lignes vertes indiquent de nouvelles positions. Les lignes rouges indiquent des positions fermées.
| Date de dépôt | Formulaire | Titre | Actions précédentes |
Actions actuelles |
ΔActions % | % de participation |
% ΔParticipation | |
|---|---|---|---|---|---|---|---|---|
| 2025-05-12 | BKD / Brookdale Senior Living Inc. | 13 684 500 | 6,80 |
Déclarations 13F et dépôts de fonds
Ce formulaire a été déposé le 2025-08-05 pour la période de déclaration 2025-06-30. Cliquez sur l'icône du lien pour voir l'historique complet des transactions.
Mettre à niveau pour débloquer les données premium et exporter vers Excel ![]() .
.
| Titre | Type | Prix moyen de l'action | Actions (en millions) |
ΔActions (%) |
ΔActions (%) |
Valeur ($ en millions) |
Portefeuille (%) |
ΔPortefeuille (%) |
|
|---|---|---|---|---|---|---|---|---|---|
| MSFT / Microsoft Corporation | 0,48 | -5,57 | 238,75 | 25,12 | 7,4049 | 1,4290 | |||
| GOOGL / Alphabet Inc. | 1,15 | -1,60 | 202,36 | 12,13 | 6,2762 | 0,6245 | |||
| COF / Capital One Financial Corporation | 0,94 | -13,23 | 200,25 | 2,96 | 6,2106 | 0,1197 | |||
| AMZN / Amazon.com, Inc. | 0,78 | -2,27 | 172,09 | 12,69 | 5,3373 | 0,5548 | |||
| B / Barrick Mining Corporation | 8,13 | 169,30 | 5,2509 | 5,2509 | |||||
| HCA / HCA Healthcare, Inc. | 0,39 | -10,10 | 149,98 | -0,33 | 4,6516 | -0,0608 | |||
| MRK / Merck & Co., Inc. | 1,81 | -7,81 | 143,63 | -18,70 | 4,4546 | -1,0779 | |||
| ALLY / Ally Financial Inc. | 3,50 | 7,67 | 136,36 | 14,99 | 4,2292 | 0,5155 | |||
| JCI / Johnson Controls International plc | 1,27 | 12,18 | 134,33 | 47,90 | 4,1664 | 1,3219 | |||
| KEYS / Keysight Technologies, Inc. | 0,73 | -22,19 | 119,29 | -14,87 | 3,6997 | -0,6885 | |||
| AEP / American Electric Power Company, Inc. | 1,13 | -12,51 | 117,41 | -16,92 | 3,6415 | -0,7845 | |||
| AMD / Advanced Micro Devices, Inc. | 0,70 | 99,74 | 3,0934 | 3,0934 | |||||
| ALC / Alcon Inc. | 1,13 | -5,57 | 99,58 | -11,46 | 3,0886 | -0,4340 | |||
| BKD / Brookdale Senior Living Inc. | 14,15 | 3,41 | 98,50 | 14,98 | 3,0551 | 0,3721 | |||
| VTR / Ventas, Inc. | 1,54 | 4,74 | 97,01 | -3,80 | 3,0087 | -0,1494 | |||
| FMX / Fomento Económico Mexicano, S.A.B. de C.V. - Depositary Receipt (Common Stock) | 0,92 | 0,34 | 95,04 | 5,89 | 2,9476 | 0,1368 | |||
| UBS / UBS Group AG | 2,43 | -9,39 | 82,05 | 0,64 | 2,5447 | -0,0086 | |||
| WDAY / Workday, Inc. | 0,33 | 78,02 | 2,4198 | 2,4198 | |||||
| WLK / Westlake Corporation | 0,82 | 62,51 | 1,9387 | 1,9387 | |||||
| EGO / Eldorado Gold Corporation | 2,97 | -21,97 | 60,36 | -5,64 | 1,8721 | -0,1312 | |||
| EAT / Brinker International, Inc. | 0,31 | 55,72 | 1,7283 | 1,7283 | |||||
| EQT / EQT Corporation | 0,95 | -32,95 | 55,53 | -26,81 | 1,7224 | -0,6538 | |||
| MU / Micron Technology, Inc. | 0,40 | 8,05 | 49,74 | 53,26 | 1,5427 | 0,5263 | |||
| CRM / Salesforce, Inc. | 0,16 | 89,19 | 43,88 | 92,25 | 1,3610 | 0,6461 | |||
| CX / CEMEX, S.A.B. de C.V. - Depositary Receipt (Common Stock) | 6,02 | -54,43 | 41,71 | -43,71 | 1,2938 | -1,0271 | |||
| ALNY / Alnylam Pharmaceuticals, Inc. | 0,12 | -23,03 | 40,05 | -7,05 | 1,2421 | -0,1073 | |||
| LEN / Lennar Corporation | 0,34 | -6,60 | 37,61 | -10,00 | 1,1665 | -0,1422 | |||
| NU / Nu Holdings Ltd. | 2,53 | 7 571,80 | 34,78 | 10 189,35 | 1,0787 | 1,0681 | |||
| FLUT / Flutter Entertainment plc | 0,12 | -21,29 | 33,45 | 1,76 | 1,0374 | 0,0080 | |||
| NTR / Nutrien Ltd. | 0,46 | -43,03 | 26,81 | -33,19 | 0,8315 | -0,4253 | |||
| JNJ / Johnson & Johnson | 0,15 | 23,22 | 0,7203 | 0,7203 | |||||
| NEM / Newmont Corporation | 0,40 | -17,26 | 23,11 | -0,16 | 0,7167 | -0,0082 | |||
| GEV / GE Vernova Inc. | 0,03 | 43 111,39 | 18,06 | 75 166,67 | 0,5603 | 0,5595 | |||
| TSM / Taiwan Semiconductor Manufacturing Company Limited - Depositary Receipt (Common Stock) | 0,08 | -41,63 | 17,59 | -20,36 | 0,5454 | -0,1461 | |||
| PHM / PulteGroup, Inc. | 0,15 | 15,99 | 0,4959 | 0,4959 | |||||
| OXY / Occidental Petroleum Corporation | 0,36 | 1,68 | 15,10 | -13,46 | 0,4684 | -0,0782 | |||
| CRTO / Criteo S.A. - Depositary Receipt (Common Stock) | 0,61 | -58,08 | 14,58 | -71,64 | 0,4521 | -1,1574 | |||
| PCOR / Procore Technologies, Inc. | 0,20 | 99,91 | 13,53 | 107,18 | 0,4197 | 0,2152 | |||
| LSPD / Lightspeed Commerce Inc. | 1,15 | 3 784,72 | 13,47 | 5 101,16 | 0,4178 | 0,4097 | |||
| PDD / PDD Holdings Inc. - Depositary Receipt (Common Stock) | 0,12 | -14,57 | 12,23 | -24,45 | 0,3792 | -0,1276 | |||
| LYB / LyondellBasell Industries N.V. | 0,21 | 91,71 | 12,13 | 57,56 | 0,3762 | 0,1351 | |||
| KO / The Coca-Cola Company | 0,16 | 0,18 | 11,52 | -1,04 | 0,3572 | -0,0073 | |||
| HDB / HDFC Bank Limited - Depositary Receipt (Common Stock) | 0,13 | 152,71 | 10,15 | 191,64 | 0,3149 | 0,2059 | |||
| T / AT&T Inc. | 0,32 | 0,15 | 9,40 | 2,49 | 0,2916 | 0,0043 | |||
| OTIS / Otis Worldwide Corporation | 0,07 | 0,21 | 7,08 | -3,86 | 0,2196 | -0,0110 | |||
| BABA / Alibaba Group Holding Limited - Depositary Receipt (Common Stock) | 0,04 | 0,00 | 4,95 | -14,23 | 0,1534 | -0,0272 | |||
| GDXJ / VanEck ETF Trust - VanEck Junior Gold Miners ETF | 0,06 | -90,39 | 3,95 | -88,64 | 0,1226 | -0,9670 | |||
| SEMR / Semrush Holdings, Inc. | 0,43 | 898,49 | 3,86 | 869,10 | 0,1196 | 0,1072 | |||
| GDX / VanEck ETF Trust - VanEck Gold Miners ETF | 0,06 | 3,37 | 0,1045 | 0,1045 | |||||
| CENX / Century Aluminum Company | 0,15 | 2,76 | 0,0856 | 0,0856 | |||||
| SUZ / Suzano S.A. - Depositary Receipt (Common Stock) | 0,21 | -45,33 | 1,93 | -44,64 | 0,0599 | -0,0493 | |||
| BAH / Booz Allen Hamilton Holding Corporation | 0,02 | 1,71 | 0,0530 | 0,0530 | |||||
| QCOM / QUALCOMM Incorporated | 0,01 | -95,08 | 1,61 | -94,90 | 0,0498 | -0,9372 | |||
| AZO / AutoZone, Inc. | 0,00 | 0,83 | 0,0258 | 0,0258 | |||||
| YMM / Full Truck Alliance Co. Ltd. - Depositary Receipt (Common Stock) | 0,07 | -46,36 | 0,80 | -50,40 | 0,0249 | -0,0258 | |||
| ROKU / Roku, Inc. | 0,01 | 44,54 | 0,63 | 80,52 | 0,0195 | 0,0086 | |||
| LX / LexinFintech Holdings Ltd. - Depositary Receipt (Common Stock) | 0,06 | 97,18 | 0,46 | 40,74 | 0,0142 | 0,0040 | |||
| VAL / Valaris Limited | 0,01 | -9,86 | 0,30 | -3,23 | 0,0093 | -0,0004 | |||
| BRKR / Bruker Corporation | 0,01 | 33,57 | 0,28 | 31,60 | 0,0087 | 0,0020 | |||
| SABR / Sabre Corporation | 0,09 | 0,28 | 0,0086 | 0,0086 | |||||
| ACIC / American Coastal Insurance Corporation | 0,02 | -18,43 | 0,24 | -21,79 | 0,0076 | -0,0022 | |||
| MGNI / Magnite, Inc. | 0,01 | -58,99 | 0,22 | -12,99 | 0,0069 | -0,0011 | |||
| GBTG / Global Business Travel Group, Inc. | 0,03 | 107,78 | 0,20 | 80,36 | 0,0063 | 0,0028 | |||
| ARGX / argenx SE - Depositary Receipt (Common Stock) | 0,00 | 1,53 | 0,18 | -5,18 | 0,0057 | -0,0004 | |||
| DGX / Quest Diagnostics Incorporated | 0,00 | 24,69 | 0,18 | 32,59 | 0,0056 | 0,0013 | |||
| CHYM / Chime Financial, Inc. | 0,01 | 0,17 | 0,0054 | 0,0054 | |||||
| SMWB / Similarweb Ltd. | 0,02 | 8,31 | 0,14 | 3,01 | 0,0043 | 0,0001 | |||
| MYRG / MYR Group Inc. | 0,00 | -2,09 | 0,13 | 56,79 | 0,0040 | 0,0014 | |||
| AEE / Ameren Corporation | 0,00 | 0,00 | 0,13 | -4,58 | 0,0039 | -0,0002 | |||
| QGEN / Qiagen N.V. | 0,00 | 9,42 | 0,12 | 30,85 | 0,0038 | 0,0009 | |||
| D / Dominion Energy, Inc. | 0,00 | 239,57 | 0,12 | 248,48 | 0,0036 | 0,0025 | |||
| EXC / Exelon Corporation | 0,00 | 255,45 | 0,11 | 235,29 | 0,0036 | 0,0025 | |||
| VRTX / Vertex Pharmaceuticals Incorporated | 0,00 | -5,49 | 0,11 | -13,01 | 0,0033 | -0,0005 | |||
| GMED / Globus Medical, Inc. | 0,00 | 3,84 | 0,11 | -15,75 | 0,0033 | -0,0007 | |||
| ABT / Abbott Laboratories | 0,00 | -41,65 | 0,10 | -40,48 | 0,0031 | -0,0022 | |||
| IMNM / Immunome, Inc. | 0,01 | -27,56 | 0,10 | 0,00 | 0,0030 | -0,0000 | |||
| ESTA / Establishment Labs Holdings Inc. | 0,00 | 3,70 | 0,09 | 8,75 | 0,0027 | 0,0002 | |||
| CERT / Certara, Inc. | 0,01 | 22,47 | 0,08 | 45,28 | 0,0024 | 0,0007 | |||
| DXCM / DexCom, Inc. | 0,00 | -56,98 | 0,07 | -45,11 | 0,0023 | -0,0019 | |||
| STE / STERIS plc | 0,00 | -51,22 | 0,06 | -48,33 | 0,0019 | -0,0018 | |||
| COR / Cencora, Inc. | 0,00 | 0,06 | 0,0019 | 0,0019 | |||||
| GPCR / Structure Therapeutics Inc. - Depositary Receipt (Common Stock) | 0,00 | -30,96 | 0,06 | -17,81 | 0,0019 | -0,0004 | |||
| GE / General Electric Company | 0,00 | 13,79 | 0,06 | 47,50 | 0,0018 | 0,0006 | |||
| ADSK / Autodesk, Inc. | 0,00 | 13,91 | 0,05 | 35,90 | 0,0017 | 0,0004 | |||
| NTRA / Natera, Inc. | 0,00 | 10,60 | 0,05 | 30,00 | 0,0016 | 0,0004 | |||
| ORIC / ORIC Pharmaceuticals, Inc. | 0,01 | 35,90 | 0,05 | 147,62 | 0,0016 | 0,0010 | |||
| LUMN / Lumen Technologies, Inc. | 0,01 | 0,00 | 0,05 | -27,94 | 0,0016 | -0,0006 | |||
| MASS / 908 Devices Inc. | 0,01 | 49,66 | 0,05 | 142,11 | 0,0015 | 0,0008 | |||
| HSIC / Henry Schein, Inc. | 0,00 | 0,04 | 0,0013 | 0,0013 | |||||
| SGMT / Sagimet Biosciences Inc. | 0,01 | 0,04 | 0,0013 | 0,0013 | |||||
| IRTC / iRhythm Technologies, Inc. | 0,00 | 0,04 | 0,0012 | 0,0012 | |||||
| SPRY / ARS Pharmaceuticals, Inc. | 0,00 | -25,21 | 0,04 | 2,70 | 0,0012 | 0,0000 | |||
| NUVL / Nuvalent, Inc. | 0,00 | -11,30 | 0,04 | -5,26 | 0,0011 | -0,0001 | |||
| IR / Ingersoll Rand Inc. | 0,00 | 13,82 | 0,03 | 18,18 | 0,0008 | 0,0001 | |||
| APGE / Apogee Therapeutics, Inc. | 0,00 | 10,15 | 0,03 | 25,00 | 0,0008 | 0,0002 | |||
| SDGR / Schrödinger, Inc. | 0,00 | -33,33 | 0,03 | -32,43 | 0,0008 | -0,0004 | |||
| JANX / Janux Therapeutics, Inc. | 0,00 | 65,82 | 0,02 | 41,18 | 0,0008 | 0,0002 | |||
| CORZ / Core Scientific, Inc. | 0,00 | 0,02 | 0,0007 | 0,0007 | |||||
| NVCR / NovoCure Limited | 0,00 | 0,02 | 0,0006 | 0,0006 | |||||
| DAWN / Day One Biopharmaceuticals, Inc. | 0,00 | 47,14 | 0,02 | 18,75 | 0,0006 | 0,0001 | |||
| WAY / Waystar Holding Corp. | 0,00 | 0,02 | 0,0005 | 0,0005 | |||||
| HUMA / Humacyte, Inc. | 0,01 | 0,01 | 0,0005 | 0,0005 | |||||
| FLNC / Fluence Energy, Inc. | 0,00 | -18,14 | 0,01 | 10,00 | 0,0004 | 0,0000 | |||
| SQM / Sociedad Química y Minera de Chile S.A. - Depositary Receipt (Common Stock) | 0,00 | 0,01 | 0,0003 | 0,0003 | |||||
| ARRY / Array Technologies, Inc. | 0,00 | -31,67 | 0,01 | -12,50 | 0,0002 | -0,0001 | |||
| GOLD / Barrick Mining Corporation | 0,00 | -100,00 | 0,00 | 0,0000 | |||||
| ORCL / Oracle Corporation | 0,00 | -100,00 | 0,00 | 0,0000 | |||||
| AA / Alcoa Corporation | 0,00 | -100,00 | 0,00 | 0,0000 | |||||
| MDT / Medtronic plc | 0,00 | -100,00 | 0,00 | 0,0000 | |||||
| JD / JD.com, Inc. - Depositary Receipt (Common Stock) | 0,00 | -100,00 | 0,00 | 0,0000 | |||||
| VIPS / Vipshop Holdings Limited - Depositary Receipt (Common Stock) | 0,00 | -100,00 | 0,00 | 0,0000 | |||||
| MDB / MongoDB, Inc. | 0,00 | -100,00 | 0,00 | 0,0000 | |||||
| SIBN / SI-BONE, Inc. | 0,00 | -100,00 | 0,00 | 0,0000 | |||||
| BDX / Becton, Dickinson and Company | 0,00 | -100,00 | 0,00 | 0,0000 | |||||
| BASE / Couchbase, Inc. | 0,00 | -100,00 | 0,00 | 0,0000 | |||||
| MOS / The Mosaic Company | 0,00 | -100,00 | 0,00 | 0,0000 | |||||
| PRCT / PROCEPT BioRobotics Corporation | 0,00 | -100,00 | 0,00 | 0,0000 | |||||
| BEKE / KE Holdings Inc. - Depositary Receipt (Common Stock) | 0,00 | -100,00 | 0,00 | 0,0000 | |||||
| GRAB / Grab Holdings Limited | 0,00 | -100,00 | 0,00 | -100,00 | -0,0323 | ||||
| HUYA / HUYA Inc. - Depositary Receipt (Common Stock) | 0,00 | -100,00 | 0,00 | 0,0000 | |||||
| ASHR / DBX ETF Trust - Xtrackers Harvest CSI 300 China A-Shares ETF | 0,00 | -100,00 | 0,00 | 0,0000 | |||||
| RARE / Ultragenyx Pharmaceutical Inc. | 0,00 | -100,00 | 0,00 | 0,0000 | |||||
| SHLS / Shoals Technologies Group, Inc. | 0,00 | -100,00 | 0,00 | 0,0000 | |||||
| GILD / Gilead Sciences, Inc. | 0,00 | -100,00 | 0,00 | 0,0000 |