Statistiques de base
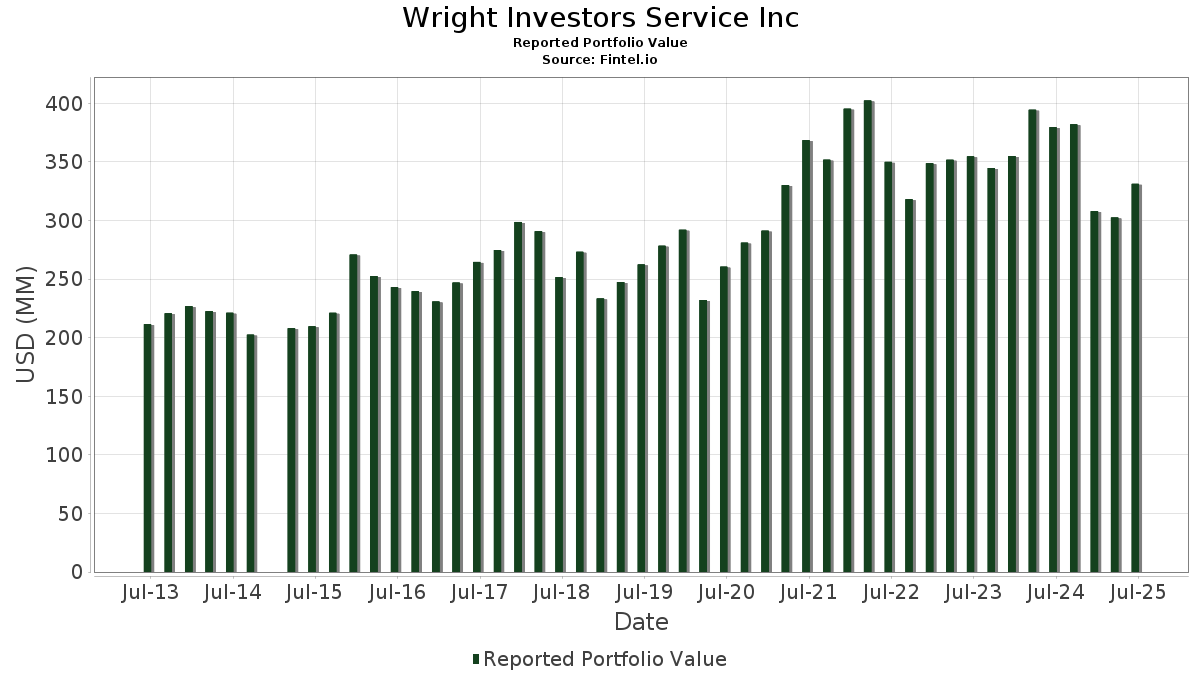
| Valeur du portefeuille | $ 331 291 813 |
| Positions actuelles | 141 |
Dernières positions, performances, ASG (à partir des dépôts 13F, 13D)
Wright Investors Service Inc a déclaré un total de 141 positions dans ses derniers dépôts auprès de la SEC. La valeur la plus récente du portefeuille est calculée à 331 291 813 USD. Les actifs sous gestion réels (ASG) sont cette valeur plus les liquidités (qui ne sont pas divulguées). Les principales positions de Wright Investors Service Inc sont Microsoft Corporation (US:MSFT) , NVIDIA Corporation (US:NVDA) , Meta Platforms, Inc. (US:META) , Apple Inc. (US:AAPL) , and Amazon.com, Inc. (US:AMZN) . Les nouvelles positions de Wright Investors Service Inc incluent BJ's Wholesale Club Holdings, Inc. (US:BJ) , Palantir Technologies Inc. (US:PLTR) , MasTec, Inc. (US:MTZ) , Aptiv PLC (US:APTV) , and Maplebear Inc. (US:CART) .
Meilleures augmentations ce trimestre
Nous utilisons la variation de l'allocation du portefeuille car il s'agit de l'indicateur le plus significatif. Les changements peuvent être dus à des transactions ou à des variations de prix des actions.
| Titre | Actions (en millions) |
Valeur ($ en millions) |
% du portefeuille | ΔPortefeuille % |
|---|---|---|---|---|
| 0,04 | 19,70 | 5,9467 | 0,9030 | |
| 0,04 | 7,28 | 2,1979 | 0,6606 | |
| 0,01 | 1,83 | 0,5528 | 0,5528 | |
| 0,12 | 3,56 | 1,0732 | 0,5525 | |
| 0,03 | 3,18 | 0,7206 | 0,4612 | |
| 0,00 | 1,40 | 0,4225 | 0,4225 | |
| 0,00 | 1,65 | 0,3740 | 0,3740 | |
| 0,02 | 1,62 | 0,3674 | 0,3674 | |
| 0,00 | 4,16 | 1,2543 | 0,2580 | |
| 0,01 | 0,83 | 0,2517 | 0,2517 |
Principales baisses ce trimestre
Nous utilisons la variation de l'allocation du portefeuille car il s'agit de l'indicateur le plus significatif. Les changements peuvent être dus à des transactions ou à des variations de prix des actions.
| Titre | Actions (en millions) |
Valeur ($ en millions) |
% du portefeuille | ΔPortefeuille % |
|---|---|---|---|---|
| 0,02 | 3,67 | 0,8325 | -1,8204 | |
| 0,07 | 13,50 | 4,0756 | -1,2957 | |
| 0,02 | 3,65 | 0,8282 | -1,2782 | |
| 0,00 | 1,17 | 0,3532 | -0,9588 | |
| 0,09 | 6,70 | 1,5204 | -0,6126 | |
| 0,02 | 14,69 | 3,3328 | -0,5914 | |
| 0,01 | 3,97 | 0,9005 | -0,5623 | |
| 0,09 | 4,16 | 1,2550 | -0,5476 | |
| 0,02 | 3,78 | 0,8572 | -0,5386 | |
| 0,02 | 6,71 | 2,0264 | -0,3789 |
Déclarations 13F et dépôts de fonds
Ce formulaire a été déposé le 2025-07-11 pour la période de déclaration 2025-06-30. Cliquez sur l'icône du lien pour voir l'historique complet des transactions.
Mettre à niveau pour débloquer les données premium et exporter vers Excel ![]() .
.
| Titre | Type | Prix moyen de l'action | Actions (en millions) |
ΔActions (%) |
ΔActions (%) |
Valeur ($ en millions) |
Portefeuille (%) |
ΔPortefeuille (%) |
|
|---|---|---|---|---|---|---|---|---|---|
| MSFT / Microsoft Corporation | 0,04 | -2,56 | 19,70 | 29,11 | 5,9467 | 0,9030 | |||
| NVDA / NVIDIA Corporation | 0,11 | 3,05 | 17,76 | 50,24 | 4,0297 | 0,1223 | |||
| META / Meta Platforms, Inc. | 0,02 | -3,39 | 14,69 | 23,72 | 3,3328 | -0,5914 | |||
| AAPL / Apple Inc. | 0,07 | -10,04 | 13,50 | -16,91 | 4,0756 | -1,2957 | |||
| AMZN / Amazon.com, Inc. | 0,06 | -2,72 | 12,17 | 12,18 | 3,6736 | 0,0874 | |||
| AVGO / Broadcom Inc. | 0,04 | -3,45 | 11,02 | 58,95 | 2,5008 | 0,2091 | |||
| PGR / The Progressive Corporation | 0,03 | 10,21 | 9,04 | 3,92 | 2,7298 | -0,1467 | |||
| JPM / JPMorgan Chase & Co. | 0,03 | 0,17 | 8,33 | 18,39 | 2,5151 | 0,1886 | |||
| GOOGL / Alphabet Inc. | 0,04 | 37,38 | 7,28 | 56,58 | 2,1979 | 0,6606 | |||
| AXP / American Express Company | 0,02 | -0,86 | 7,21 | 17,55 | 2,1776 | 0,1488 | |||
| V / Visa Inc. | 0,02 | -8,93 | 6,71 | -7,74 | 2,0264 | -0,3789 | |||
| KO / The Coca-Cola Company | 0,09 | 5,11 | 6,70 | 3,84 | 1,5204 | -0,6126 | |||
| GILD / Gilead Sciences, Inc. | 0,05 | 0,56 | 5,65 | -0,51 | 1,7050 | -0,1715 | |||
| CAT / Caterpillar Inc. | 0,01 | -12,76 | 5,43 | 2,69 | 1,6388 | -0,1088 | |||
| XOM / Exxon Mobil Corporation | 0,05 | 7,70 | 5,28 | -2,37 | 1,5941 | -0,1941 | |||
| HD / The Home Depot, Inc. | 0,01 | -8,58 | 4,92 | -8,55 | 1,4861 | -0,2933 | |||
| BAC / Bank of America Corporation | 0,10 | 0,17 | 4,59 | 13,60 | 1,0408 | -0,2939 | |||
| NRG / NRG Energy, Inc. | 0,03 | -14,20 | 4,45 | 44,33 | 1,0108 | -0,0093 | |||
| TSLA / Tesla, Inc. | 0,01 | 8,51 | 4,39 | 33,04 | 1,3248 | 0,2341 | |||
| CI / The Cigna Group | 0,01 | 19,04 | 4,22 | 19,61 | 1,2741 | 0,1076 | |||
| BMY / Bristol-Myers Squibb Company | 0,09 | 0,46 | 4,16 | -23,77 | 1,2550 | -0,5476 | |||
| NFLX / Netflix, Inc. | 0,00 | -3,99 | 4,16 | 37,90 | 1,2543 | 0,2580 | |||
| UNH / UnitedHealth Group Incorporated | 0,01 | 50,55 | 3,97 | -10,33 | 0,9005 | -0,5623 | |||
| ORCL / Oracle Corporation | 0,02 | -42,79 | 3,78 | -10,54 | 0,8572 | -0,5386 | |||
| CMCSA / Comcast Corporation | 0,10 | 12,37 | 3,69 | 8,69 | 1,1137 | -0,0085 | |||
| ABBV / AbbVie Inc. | 0,02 | -48,40 | 3,67 | -54,29 | 0,8325 | -1,8204 | |||
| GOOGL / Alphabet Inc. | 0,02 | -49,56 | 3,65 | -42,73 | 0,8282 | -1,2782 | |||
| T / AT&T Inc. | 0,12 | 120,55 | 3,56 | 125,71 | 1,0732 | 0,5525 | |||
| GSCE / GS Connect S&P GSCI Enhanced Commodity Total Return ETN | 0,00 | 0,49 | 3,35 | 30,21 | 0,7600 | -0,0904 | |||
| HWM / Howmet Aerospace Inc. | 0,02 | -1,99 | 3,31 | 40,60 | 1,0006 | 0,2214 | |||
| AMAT / Applied Materials, Inc. | 0,02 | -32,59 | 3,23 | -14,97 | 0,9742 | -0,2803 | |||
| CSCO / Cisco Systems, Inc. | 0,05 | 0,45 | 3,20 | 12,95 | 0,9666 | 0,0293 | |||
| ANET / Arista Networks Inc | 0,03 | 206,54 | 3,18 | 304,97 | 0,7206 | 0,4612 | |||
| COST / Costco Wholesale Corporation | 0,00 | 33,80 | 3,13 | 40,10 | 0,7096 | -0,0285 | |||
| NEE / NextEra Energy, Inc. | 0,04 | 8,84 | 2,77 | 6,58 | 0,6290 | -0,2307 | |||
| SYF / Synchrony Financial | 0,04 | 8,09 | 2,74 | 36,32 | 0,6209 | -0,0428 | |||
| IBM / International Business Machines Corporation | 0,01 | 1,67 | 2,67 | 20,53 | 0,6061 | -0,1264 | |||
| CB / Chubb Limited | 0,01 | 0,28 | 2,46 | -3,79 | 0,7429 | -0,1027 | |||
| VICI / VICI Properties Inc. | 0,07 | 0,44 | 2,43 | 0,41 | 0,5512 | -0,2487 | |||
| WFC / Wells Fargo & Company | 0,03 | 41,30 | 2,21 | 57,73 | 0,6657 | 0,2034 | |||
| TJX / The TJX Companies, Inc. | 0,02 | -1,94 | 2,06 | -0,58 | 0,6228 | -0,0632 | |||
| BLK / BlackRock, Inc. | 0,00 | 1,35 | 2,04 | 12,33 | 0,4633 | -0,1374 | |||
| LLY / Eli Lilly and Company | 0,00 | -4,03 | 2,01 | -9,39 | 0,6059 | -0,1266 | |||
| OHI / Omega Healthcare Investors, Inc. | 0,05 | 53,85 | 1,90 | 48,05 | 0,5741 | 0,1495 | |||
| GEHC / GE HealthCare Technologies Inc. | 0,03 | 105,33 | 1,88 | 88,40 | 0,4277 | 0,0971 | |||
| BA / The Boeing Company | 0,01 | 1,83 | 0,5528 | 0,5528 | |||||
| AMGN / Amgen Inc. | 0,01 | -1,98 | 1,80 | -12,16 | 0,5431 | -0,1339 | |||
| PHM / PulteGroup, Inc. | 0,02 | -0,21 | 1,80 | 2,34 | 0,5421 | -0,0378 | |||
| ADBE / Adobe Inc. | 0,00 | -2,49 | 1,79 | -1,65 | 0,5402 | -0,0612 | |||
| CBRE / CBRE Group, Inc. | 0,01 | -0,17 | 1,79 | 6,95 | 0,4052 | -0,1467 | |||
| KR / The Kroger Co. | 0,02 | 0,47 | 1,78 | 6,51 | 0,4046 | -0,1490 | |||
| EBAY / eBay Inc. | 0,02 | 0,14 | 1,76 | 10,09 | 0,3986 | -0,1288 | |||
| BRK.B / Berkshire Hathaway Inc. | 0,00 | 14,22 | 1,72 | 4,19 | 0,3897 | -0,1552 | |||
| ULTA / Ulta Beauty, Inc. | 0,00 | 1,65 | 0,3740 | 0,3740 | |||||
| PM / Philip Morris International Inc. | 0,01 | 3,09 | 1,64 | 18,25 | 0,3720 | -0,0861 | |||
| SCHW / The Charles Schwab Corporation | 0,02 | 1,62 | 0,3674 | 0,3674 | |||||
| C / Citigroup Inc. | 0,02 | -19,72 | 1,57 | -3,74 | 0,4745 | -0,0653 | |||
| UBER / Uber Technologies, Inc. | 0,02 | 38,55 | 1,53 | 77,34 | 0,4633 | 0,1773 | |||
| JBL / Jabil Inc. | 0,01 | 126,43 | 1,50 | 263,29 | 0,3413 | 0,2043 | |||
| RTX / RTX Corporation | 0,01 | 0,47 | 1,46 | 10,69 | 0,4410 | 0,0050 | |||
| DAL / Delta Air Lines, Inc. | 0,03 | -35,46 | 1,40 | -27,18 | 0,4238 | -0,2137 | |||
| ACN / Accenture plc | 0,00 | 1,40 | 0,4225 | 0,4225 | |||||
| UGI / UGI Corporation | 0,04 | -2,29 | 1,32 | 7,61 | 0,3971 | -0,0070 | |||
| HHH / Howard Hughes Holdings Inc. | 0,02 | 0,48 | 1,28 | -8,42 | 0,2914 | -0,1722 | |||
| ZM / Zoom Communications Inc. | 0,02 | 0,48 | 1,23 | 6,21 | 0,3717 | -0,0115 | |||
| EOG / EOG Resources, Inc. | 0,01 | 15,82 | 1,22 | 8,05 | 0,2772 | -0,0966 | |||
| QCOM / QUALCOMM Incorporated | 0,01 | -45,09 | 1,22 | -43,07 | 0,3672 | -0,3391 | |||
| CL / Colgate-Palmolive Company | 0,01 | -40,86 | 1,20 | -42,66 | 0,3621 | -0,3291 | |||
| AMP / Ameriprise Financial, Inc. | 0,00 | -26,94 | 1,18 | -19,49 | 0,3556 | -0,1279 | |||
| AMT / American Tower Corporation | 0,01 | -4,14 | 1,18 | -2,65 | 0,2669 | -0,1324 | |||
| CRM / Salesforce, Inc. | 0,00 | -70,99 | 1,17 | -70,52 | 0,3532 | -0,9588 | |||
| NOW / ServiceNow, Inc. | 0,00 | -3,95 | 1,15 | 24,08 | 0,3469 | 0,0406 | |||
| MRK / Merck & Co., Inc. | 0,01 | 43,97 | 1,13 | 27,06 | 0,3402 | 0,0468 | |||
| APP / AppLovin Corporation | 0,00 | -4,11 | 1,12 | 26,76 | 0,2538 | -0,0380 | |||
| USFD / US Foods Holding Corp. | 0,01 | -1,85 | 1,10 | 15,51 | 0,3327 | 0,0172 | |||
| CVX / Chevron Corporation | 0,01 | 1,57 | 1,04 | -13,05 | 0,3137 | -0,0815 | |||
| GEV / GE Vernova Inc. | 0,00 | 0,47 | 1,02 | 74,14 | 0,3071 | 0,1140 | |||
| FCX / Freeport-McMoRan Inc. | 0,02 | 56,47 | 1,01 | 79,22 | 0,3047 | 0,1185 | |||
| CHTR / Charter Communications, Inc. | 0,00 | 86,52 | 0,98 | 107,16 | 0,2971 | 0,1399 | |||
| EXPE / Expedia Group, Inc. | 0,01 | -4,01 | 0,97 | -3,67 | 0,2207 | -0,1131 | |||
| ABT / Abbott Laboratories | 0,01 | 0,47 | 0,96 | 2,99 | 0,2190 | -0,0907 | |||
| MGM / MGM Resorts International | 0,03 | 0,48 | 0,92 | 16,58 | 0,2780 | 0,0169 | |||
| VZ / Verizon Communications Inc. | 0,02 | 1,16 | 0,92 | -3,57 | 0,2776 | -0,0374 | |||
| HON / Honeywell International Inc. | 0,00 | -0,15 | 0,92 | 9,82 | 0,2768 | 0,0008 | |||
| ACGL / Arch Capital Group Ltd. | 0,01 | 0,47 | 0,90 | -4,95 | 0,2725 | -0,0413 | |||
| VRT / Vertiv Holdings Co | 0,01 | -4,01 | 0,90 | 70,86 | 0,2710 | 0,0972 | |||
| COP / ConocoPhillips | 0,01 | -0,28 | 0,85 | -14,73 | 0,2569 | -0,0733 | |||
| MET / MetLife, Inc. | 0,01 | -36,77 | 0,85 | -36,67 | 0,2560 | -0,1867 | |||
| DIS / The Walt Disney Company | 0,01 | -21,61 | 0,84 | -1,42 | 0,2524 | -0,0282 | |||
| BJ / BJ's Wholesale Club Holdings, Inc. | 0,01 | 0,83 | 0,2517 | 0,2517 | |||||
| PLTR / Palantir Technologies Inc. | 0,01 | 0,82 | 0,2481 | 0,2481 | |||||
| PYPL / PayPal Holdings, Inc. | 0,01 | 0,47 | 0,80 | 14,57 | 0,1820 | -0,0497 | |||
| UPS / United Parcel Service, Inc. | 0,01 | 1,34 | 0,79 | -7,03 | 0,1801 | -0,1020 | |||
| ADT / ADT Inc. | 0,09 | 25,76 | 0,76 | 31,02 | 0,1716 | -0,0194 | |||
| CACI / CACI International Inc | 0,00 | 0,74 | 0,1670 | 0,1670 | |||||
| MTZ / MasTec, Inc. | 0,00 | 0,71 | 0,2152 | 0,2152 | |||||
| STLD / Steel Dynamics, Inc. | 0,01 | -0,09 | 0,69 | 2,22 | 0,2090 | -0,0148 | |||
| NXPI / NXP Semiconductors N.V. | 0,00 | 0,85 | 0,67 | 15,89 | 0,2027 | 0,0112 | |||
| TKO / TKO Group Holdings, Inc. | 0,00 | -49,52 | 0,66 | -39,96 | 0,1488 | -0,2118 | |||
| MCHP / Microchip Technology Incorporated | 0,01 | 0,46 | 0,61 | 46,30 | 0,1851 | 0,0463 | |||
| PFE / Pfizer Inc. | 0,02 | 0,49 | 0,59 | -3,89 | 0,1346 | -0,0694 | |||
| VLO / Valero Energy Corporation | 0,00 | 1,15 | 0,59 | 2,96 | 0,1790 | -0,0114 | |||
| HST / Host Hotels & Resorts, Inc. | 0,04 | 0,48 | 0,58 | 8,60 | 0,1319 | -0,0450 | |||
| FOXA / Fox Corporation | 0,01 | 0,50 | 0,57 | -0,53 | 0,1707 | -0,0172 | |||
| CRH / CRH plc | 0,01 | -43,57 | 0,56 | -41,13 | 0,1281 | -0,1888 | |||
| EME / EMCOR Group, Inc. | 0,00 | 1,06 | 0,56 | 46,46 | 0,1267 | 0,0005 | |||
| PNC / The PNC Financial Services Group, Inc. | 0,00 | 2,96 | 0,56 | 9,20 | 0,1267 | -0,0423 | |||
| APTV / Aptiv PLC | 0,01 | 0,55 | 0,1653 | 0,1653 | |||||
| OXY / Occidental Petroleum Corporation | 0,01 | 0,48 | 0,55 | -14,53 | 0,1242 | -0,0874 | |||
| GEN / Gen Digital Inc. | 0,02 | 0,48 | 0,54 | 11,39 | 0,1624 | 0,0026 | |||
| MS / Morgan Stanley | 0,00 | 4,27 | 0,54 | 25,82 | 0,1621 | 0,0211 | |||
| CSX / CSX Corporation | 0,02 | 0,37 | 0,53 | 11,30 | 0,1208 | -0,0373 | |||
| HPE / Hewlett Packard Enterprise Company | 0,03 | 0,47 | 0,53 | 33,00 | 0,1200 | -0,0113 | |||
| OKE / ONEOK, Inc. | 0,01 | 2,88 | 0,52 | -15,40 | 0,1577 | -0,0464 | |||
| CNC / Centene Corporation | 0,01 | 0,47 | 0,52 | -10,21 | 0,1567 | -0,0343 | |||
| BEN / Franklin Resources, Inc. | 0,02 | 3,48 | 0,50 | 28,21 | 0,1510 | 0,0220 | |||
| FTNT / Fortinet, Inc. | 0,00 | 0,49 | 0,1489 | 0,1489 | |||||
| TMUS / T-Mobile US, Inc. | 0,00 | 0,49 | 0,49 | -10,28 | 0,1112 | -0,0692 | |||
| CART / Maplebear Inc. | 0,01 | 0,49 | 0,1466 | 0,1466 | |||||
| SLGN / Silgan Holdings Inc. | 0,01 | -4,10 | 0,48 | 1,69 | 0,1090 | -0,0472 | |||
| DUK / Duke Energy Corporation | 0,00 | 3,10 | 0,47 | -0,21 | 0,1424 | -0,0139 | |||
| TFC / Truist Financial Corporation | 0,01 | 3,40 | 0,47 | 8,03 | 0,1423 | -0,0020 | |||
| EMR / Emerson Electric Co. | 0,00 | -50,41 | 0,47 | -39,74 | 0,1421 | -0,1160 | |||
| 0HQW / C.H. Robinson Worldwide, Inc. | 0,00 | 0,47 | 0,1410 | 0,1410 | |||||
| BP / BP p.l.c. - Depositary Receipt (Common Stock) | 0,02 | 2,67 | 0,47 | -8,97 | 0,1410 | -0,0288 | |||
| G / Genpact Limited | 0,01 | 0,46 | 0,1380 | 0,1380 | |||||
| TD / The Toronto-Dominion Bank | 0,01 | 3,06 | 0,43 | 26,33 | 0,0971 | -0,0149 | |||
| CAG / Conagra Brands, Inc. | 0,02 | 0,42 | 0,1266 | 0,1266 | |||||
| ETN / Eaton Corporation plc | 0,00 | -4,00 | 0,39 | 25,96 | 0,0894 | -0,0139 | |||
| BKR / Baker Hughes Company | 0,01 | 0,48 | 0,38 | -12,41 | 0,0866 | -0,0573 | |||
| VST / Vistra Corp. | 0,00 | 0,36 | 0,0815 | 0,0815 | |||||
| BLDR / Builders FirstSource, Inc. | 0,00 | -54,38 | 0,35 | -57,39 | 0,0793 | -0,1917 | |||
| COKE / Coca-Cola Consolidated, Inc. | 0,00 | 812,57 | 0,35 | -24,51 | 0,1052 | -0,0474 | |||
| IP / International Paper Company | 0,01 | 2,86 | 0,34 | -9,63 | 0,1021 | -0,0217 | |||
| LMT / Lockheed Martin Corporation | 0,00 | 2,53 | 0,30 | 6,38 | 0,0907 | -0,0027 | |||
| KMB / Kimberly-Clark Corporation | 0,00 | 2,13 | 0,29 | -7,35 | 0,0876 | -0,0160 | |||
| TNL / Travel + Leisure Co. | 0,00 | -8,43 | 0,25 | 2,02 | 0,0576 | -0,0246 | |||
| USB / U.S. Bancorp | 0,01 | 3,24 | 0,25 | 10,53 | 0,0573 | -0,0181 | |||
| PAYX / Paychex, Inc. | 0,00 | 2,40 | 0,24 | -3,60 | 0,0729 | -0,0098 | |||
| TGT / Target Corporation | 0,00 | 3,93 | 0,22 | -1,75 | 0,0677 | -0,0078 | |||
| DLR / Digital Realty Trust, Inc. | 0,00 | -66,92 | 0,21 | -59,77 | 0,0486 | -0,1273 | |||
| LEN / Lennar Corporation | 0,00 | -100,00 | 0,00 | 0,0000 | |||||
| PPC / Pilgrim's Pride Corporation | 0,00 | -100,00 | 0,00 | 0,0000 | |||||
| VRTX / Vertex Pharmaceuticals Incorporated | 0,00 | -100,00 | 0,00 | 0,0000 | |||||
| SLB / Schlumberger Limited | 0,00 | -100,00 | 0,00 | 0,0000 | |||||
| WMS / Advanced Drainage Systems, Inc. | 0,00 | -100,00 | 0,00 | 0,0000 | |||||
| RIO / Rio Tinto Group - Depositary Receipt (Common Stock) | 0,00 | -100,00 | 0,00 | 0,0000 | |||||
| FDX / FedEx Corporation | 0,00 | -100,00 | 0,00 | 0,0000 | |||||
| AMD / Advanced Micro Devices, Inc. | 0,00 | -100,00 | 0,00 | 0,0000 | |||||
| AMH / American Homes 4 Rent | 0,00 | -100,00 | 0,00 | 0,0000 | |||||
| HLN / Haleon plc - Depositary Receipt (Common Stock) | 0,00 | -100,00 | 0,00 | 0,0000 | |||||
| PH / Parker-Hannifin Corporation | 0,00 | -100,00 | 0,00 | 0,0000 | |||||
| COR / Cencora, Inc. | 0,00 | -100,00 | 0,00 | 0,0000 | |||||
| SGI / Somnigroup International Inc. | 0,00 | -100,00 | 0,00 | 0,0000 | |||||
| LKQ / LKQ Corporation | 0,00 | -100,00 | 0,00 | 0,0000 | |||||
| XPRO / Expro Group Holdings N.V. | 0,00 | -100,00 | 0,00 | 0,0000 |