Statistiques de base
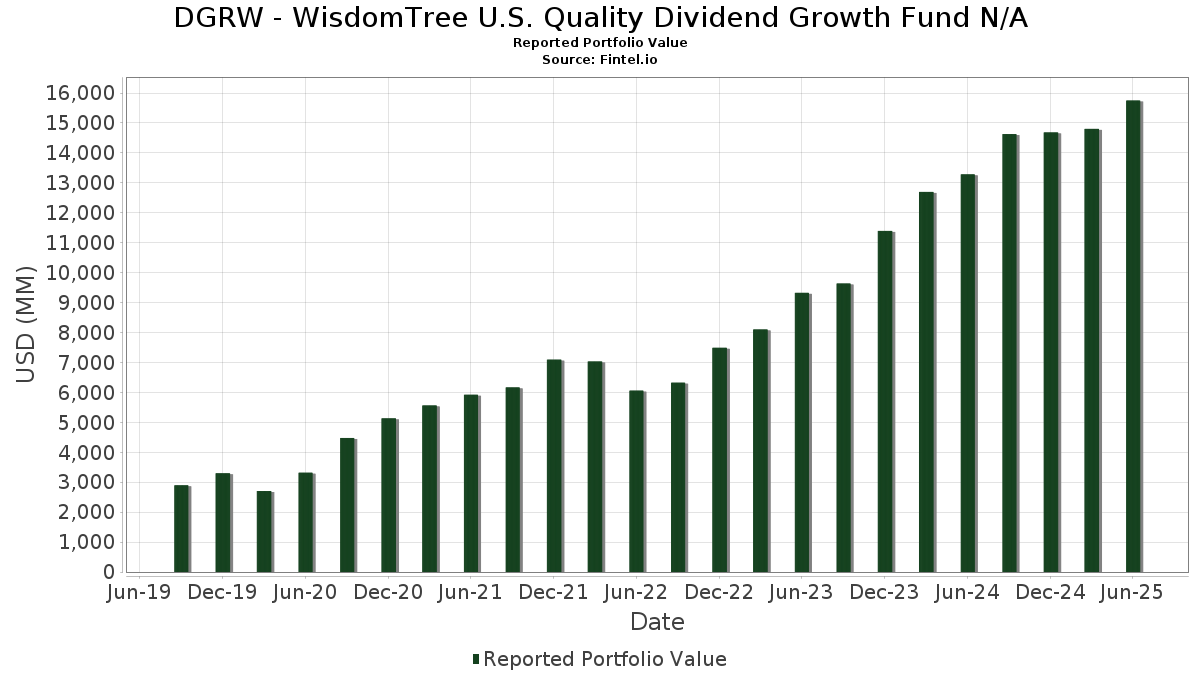
| Valeur du portefeuille | $ 15 747 162 114 |
| Positions actuelles | 307 |
Dernières positions, performances, ASG (à partir des dépôts 13F, 13D)
DGRW - WisdomTree U.S. Quality Dividend Growth Fund N/A a déclaré un total de 307 positions dans ses derniers dépôts auprès de la SEC. La valeur la plus récente du portefeuille est calculée à 15 747 162 114 USD. Les actifs sous gestion réels (ASG) sont cette valeur plus les liquidités (qui ne sont pas divulguées). Les principales positions de DGRW - WisdomTree U.S. Quality Dividend Growth Fund N/A sont Microsoft Corporation (US:MSFT) , Exxon Mobil Corporation (US:XOM) , Apple Inc. (US:AAPL) , NVIDIA Corporation (US:NVDA) , and Philip Morris International Inc. (US:PM) .
Meilleures augmentations ce trimestre
Nous utilisons la variation de l'allocation du portefeuille car il s'agit de l'indicateur le plus significatif. Les changements peuvent être dus à des transactions ou à des variations de prix des actions.
| Titre | Actions (en millions) |
Valeur ($ en millions) |
% du portefeuille | ΔPortefeuille % |
|---|---|---|---|---|
| 2,89 | 1 436,49 | 9,1230 | 1,9094 | |
| 4,02 | 635,65 | 4,0369 | 1,1383 | |
| 1,25 | 272,76 | 1,7323 | 0,5857 | |
| 0,38 | 278,91 | 1,7713 | 0,3362 | |
| 2,57 | 467,98 | 2,9720 | 0,2587 | |
| 3,17 | 269,92 | 1,7142 | 0,2132 | |
| 3,74 | 366,09 | 2,3250 | 0,1365 | |
| 1,37 | 240,86 | 1,5297 | 0,1275 | |
| 0,82 | 80,08 | 0,5086 | 0,1205 | |
| 1,28 | 227,25 | 1,4432 | 0,1057 |
Principales baisses ce trimestre
Nous utilisons la variation de l'allocation du portefeuille car il s'agit de l'indicateur le plus significatif. Les changements peuvent être dus à des transactions ou à des variations de prix des actions.
| Titre | Actions (en millions) |
Valeur ($ en millions) |
% du portefeuille | ΔPortefeuille % |
|---|---|---|---|---|
| 0,65 | 201,58 | 1,2802 | -0,9567 | |
| 6,49 | 699,98 | 4,4455 | -0,6887 | |
| 2,87 | 410,61 | 2,6077 | -0,6101 | |
| 3,25 | 665,84 | 4,2287 | -0,6012 | |
| 4,03 | 319,10 | 2,0266 | -0,4031 | |
| 2,22 | 292,71 | 1,8590 | -0,3555 | |
| 2,82 | 448,99 | 2,8515 | -0,3535 | |
| 0,90 | 214,67 | 1,3634 | -0,2391 | |
| 0,89 | 258,84 | 1,6438 | -0,1921 | |
| 0,31 | 244,81 | 1,5547 | -0,1726 |
Déclarations 13F et dépôts de fonds
Ce formulaire a été déposé le 2025-08-29 pour la période de déclaration 2025-06-30. Cliquez sur l'icône du lien pour voir l'historique complet des transactions.
Mettre à niveau pour débloquer les données premium et exporter vers Excel ![]() .
.
| Titre | Type | Prix moyen de l'action | Actions (en millions) |
ΔActions (%) |
ΔActions (%) |
Valeur ($ en millions) |
Portefeuille (%) |
ΔPortefeuille (%) |
|
|---|---|---|---|---|---|---|---|---|---|
| MSFT / Microsoft Corporation | 2,89 | 1,57 | 1 436,49 | 34,59 | 9,1230 | 1,9094 | |||
| XOM / Exxon Mobil Corporation | 6,49 | 1,66 | 699,98 | -7,85 | 4,4455 | -0,6887 | |||
| AAPL / Apple Inc. | 3,25 | 0,88 | 665,84 | -6,83 | 4,2287 | -0,6012 | |||
| NVDA / NVIDIA Corporation | 4,02 | 1,67 | 635,65 | 48,21 | 4,0369 | 1,1383 | |||
| PM / Philip Morris International Inc. | 2,57 | 1,59 | 467,98 | 16,57 | 2,9720 | 0,2587 | |||
| PG / The Procter & Gamble Company | 2,82 | 1,28 | 448,99 | -5,32 | 2,8515 | -0,3535 | |||
| CVX / Chevron Corporation | 2,87 | 0,76 | 410,61 | -13,76 | 2,6077 | -0,6101 | |||
| HD / The Home Depot, Inc. | 1,10 | 1,76 | 401,73 | 1,80 | 2,5513 | -0,1159 | |||
| WMT / Walmart Inc. | 3,74 | 1,51 | 366,09 | 13,06 | 2,3250 | 0,1365 | |||
| MRK / Merck & Co., Inc. | 4,03 | 0,65 | 319,10 | -11,23 | 2,0266 | -0,4031 | |||
| PEP / PepsiCo, Inc. | 2,22 | 1,45 | 292,71 | -10,66 | 1,8590 | -0,3555 | |||
| META / Meta Platforms, Inc. | 0,38 | 2,57 | 278,91 | 31,36 | 1,7713 | 0,3362 | |||
| ORCL / Oracle Corporation | 1,25 | 2,82 | 272,76 | 60,78 | 1,7323 | 0,5857 | |||
| C / Citigroup Inc. | 3,17 | 1,36 | 269,92 | 21,53 | 1,7142 | 0,2132 | |||
| MCD / McDonald's Corporation | 0,89 | 1,87 | 258,84 | -4,72 | 1,6438 | -0,1921 | |||
| LLY / Eli Lilly and Company | 0,31 | 1,49 | 244,81 | -4,21 | 1,5547 | -0,1726 | |||
| V / Visa Inc. | 0,68 | 1,23 | 240,92 | 2,56 | 1,5300 | -0,0576 | |||
| GOOGL / Alphabet Inc. | 1,37 | 1,88 | 240,86 | 16,10 | 1,5297 | 0,1275 | |||
| ABT / Abbott Laboratories | 1,74 | 1,09 | 236,38 | 3,65 | 1,5012 | -0,0401 | |||
| GOOG / Alphabet Inc. | 1,28 | 1,14 | 227,25 | 14,83 | 1,4432 | 0,1057 | |||
| GILD / Gilead Sciences, Inc. | 2,00 | 1,39 | 221,26 | 0,32 | 1,4052 | -0,0854 | |||
| TMUS / T-Mobile US, Inc. | 0,90 | 1,36 | 214,67 | -9,46 | 1,3634 | -0,2391 | |||
| UNH / UnitedHealth Group Incorporated | 0,65 | 2,25 | 201,58 | -39,09 | 1,2802 | -0,9567 | |||
| QCOM / QUALCOMM Incorporated | 1,20 | -0,67 | 191,03 | 2,98 | 1,2132 | -0,0405 | |||
| UNP / Union Pacific Corporation | 0,74 | 1,71 | 170,52 | -0,94 | 1,0830 | -0,0805 | |||
| BLK / BlackRock, Inc. | 0,15 | 1,35 | 162,40 | 12,36 | 1,0314 | 0,0545 | |||
| HON / Honeywell International Inc. | 0,68 | 1,33 | 158,88 | 11,44 | 1,0090 | 0,0455 | |||
| LMT / Lockheed Martin Corporation | 0,32 | 0,43 | 148,12 | 4,12 | 0,9407 | -0,0208 | |||
| MA / Mastercard Incorporated | 0,25 | 3,91 | 142,12 | 6,53 | 0,9026 | 0,0010 | |||
| ADP / Automatic Data Processing, Inc. | 0,44 | 1,41 | 135,92 | 2,36 | 0,8632 | -0,0342 | |||
| AXP / American Express Company | 0,36 | 3,37 | 115,28 | 22,56 | 0,7321 | 0,0964 | |||
| LOW / Lowe's Companies, Inc. | 0,51 | 1,71 | 113,83 | -3,25 | 0,7229 | -0,0722 | |||
| SCHW / The Charles Schwab Corporation | 1,20 | 3,86 | 109,66 | 21,05 | 0,6964 | 0,0842 | |||
| COST / Costco Wholesale Corporation | 0,11 | 1,31 | 109,43 | 6,04 | 0,6950 | -0,0025 | |||
| MMM / 3M Company | 0,66 | 5,70 | 100,49 | 9,57 | 0,6382 | 0,0183 | |||
| DE / Deere & Company | 0,19 | 1,46 | 97,35 | 9,92 | 0,6182 | 0,0197 | |||
| GE / General Electric Company | 0,36 | 0,33 | 92,75 | 29,03 | 0,5891 | 0,1032 | |||
| NKE / NIKE, Inc. | 1,29 | -0,12 | 91,44 | 11,77 | 0,5807 | 0,0278 | |||
| TJX / The TJX Companies, Inc. | 0,73 | 0,46 | 90,21 | 1,85 | 0,5729 | -0,0257 | |||
| GD / General Dynamics Corporation | 0,30 | 3,21 | 87,79 | 10,44 | 0,5575 | 0,0203 | |||
| ITW / Illinois Tool Works Inc. | 0,35 | 2,48 | 85,94 | 2,17 | 0,5458 | -0,0227 | |||
| CL / Colgate-Palmolive Company | 0,93 | 1,90 | 84,87 | -1,14 | 0,5390 | -0,0413 | |||
| MMC / Marsh & McLennan Companies, Inc. | 0,37 | -0,02 | 81,74 | -10,43 | 0,5192 | -0,0976 | |||
| LRCX / Lam Research Corporation | 0,82 | 4,16 | 80,08 | 39,46 | 0,5086 | 0,1205 | |||
| PAYX / Paychex, Inc. | 0,53 | 0,46 | 76,82 | -5,28 | 0,4879 | -0,0603 | |||
| INTU / Intuit Inc. | 0,10 | 1,38 | 75,41 | 30,05 | 0,4789 | 0,0870 | |||
| TGT / Target Corporation | 0,75 | 0,68 | 74,23 | -4,83 | 0,4714 | -0,0557 | |||
| APD / Air Products and Chemicals, Inc. | 0,26 | 1,49 | 73,37 | -2,94 | 0,4660 | -0,0449 | |||
| AMAT / Applied Materials, Inc. | 0,39 | 4,81 | 71,63 | 32,22 | 0,4549 | 0,0888 | |||
| KMB / Kimberly-Clark Corporation | 0,55 | 2,81 | 70,73 | -6,80 | 0,4492 | -0,0637 | |||
| SYK / Stryker Corporation | 0,17 | 2,88 | 67,40 | 9,34 | 0,4281 | 0,0114 | |||
| WM / Waste Management, Inc. | 0,29 | 1,78 | 66,71 | 0,59 | 0,4236 | -0,0245 | |||
| KLAC / KLA Corporation | 0,07 | 3,10 | 66,26 | 35,85 | 0,4208 | 0,0912 | |||
| AIG / American International Group, Inc. | 0,76 | 3,63 | 65,13 | 2,02 | 0,4136 | -0,0178 | |||
| SPGI / S&P Global Inc. | 0,12 | 1,88 | 65,05 | 5,73 | 0,4132 | -0,0027 | |||
| NSC / Norfolk Southern Corporation | 0,25 | 1,57 | 64,68 | 9,77 | 0,4108 | 0,0125 | |||
| FDX / FedEx Corporation | 0,26 | 0,89 | 59,99 | -5,92 | 0,3810 | -0,0500 | |||
| APH / Amphenol Corporation | 0,57 | -0,08 | 56,69 | 50,44 | 0,3600 | 0,1053 | |||
| SYY / Sysco Corporation | 0,68 | -0,68 | 51,85 | 0,25 | 0,3293 | -0,0203 | |||
| FAST / Fastenal Company | 1,19 | 96,93 | 49,86 | 6,65 | 0,3167 | 0,0007 | |||
| CSX / CSX Corporation | 1,48 | 4,76 | 48,25 | 16,16 | 0,3064 | 0,0257 | |||
| PH / Parker-Hannifin Corporation | 0,07 | 3,07 | 48,19 | 18,44 | 0,3061 | 0,0310 | |||
| CMI / Cummins Inc. | 0,14 | 1,76 | 47,47 | 6,33 | 0,3015 | -0,0003 | |||
| RSG / Republic Services, Inc. | 0,19 | 1,41 | 46,21 | 3,27 | 0,2935 | -0,0090 | |||
| HCA / HCA Healthcare, Inc. | 0,12 | -0,38 | 44,60 | 10,45 | 0,2832 | 0,0103 | |||
| YUM / Yum! Brands, Inc. | 0,30 | -0,46 | 44,37 | -6,26 | 0,2818 | -0,0381 | |||
| COP / ConocoPhillips | 0,48 | 2,59 | 42,84 | -12,34 | 0,2721 | -0,0582 | |||
| DRI / Darden Restaurants, Inc. | 0,19 | -1,78 | 41,55 | 3,05 | 0,2639 | -0,0086 | |||
| ECL / Ecolab Inc. | 0,15 | 0,02 | 39,71 | 6,30 | 0,2522 | -0,0003 | |||
| ROK / Rockwell Automation, Inc. | 0,12 | 3,05 | 39,28 | 32,48 | 0,2495 | 0,0491 | |||
| ZTS / Zoetis Inc. | 0,25 | 5,68 | 38,74 | 0,10 | 0,2461 | -0,0155 | |||
| MAR / Marriott International, Inc. | 0,14 | 2,24 | 37,82 | 17,27 | 0,2402 | 0,0222 | |||
| CARR / Carrier Global Corporation | 0,52 | 0,34 | 37,81 | 15,83 | 0,2401 | 0,0195 | |||
| HIG / The Hartford Insurance Group, Inc. | 0,29 | -0,72 | 36,75 | 1,80 | 0,2334 | -0,0106 | |||
| MCO / Moody's Corporation | 0,07 | 4,71 | 36,36 | 12,78 | 0,2309 | 0,0130 | |||
| DHR / Danaher Corporation | 0,18 | -1,01 | 36,20 | -4,61 | 0,2299 | -0,0266 | |||
| FERG / Ferguson Enterprises Inc. | 0,16 | 1,46 | 35,81 | 37,88 | 0,2274 | 0,0519 | |||
| NDAQ / Nasdaq, Inc. | 0,40 | -0,67 | 35,43 | 17,09 | 0,2250 | 0,0205 | |||
| CTAS / Cintas Corporation | 0,16 | -0,20 | 35,40 | 8,22 | 0,2248 | 0,0037 | |||
| SHW / The Sherwin-Williams Company | 0,10 | -1,08 | 35,37 | -2,73 | 0,2246 | -0,0211 | |||
| EBAY / eBay Inc. | 0,46 | -0,72 | 34,60 | 9,15 | 0,2197 | 0,0055 | |||
| OTIS / Otis Worldwide Corporation | 0,35 | 4,36 | 34,53 | 0,13 | 0,2193 | -0,0138 | |||
| CFG / Citizens Financial Group, Inc. | 0,77 | 2,98 | 34,47 | 12,48 | 0,2189 | 0,0118 | |||
| MSI / Motorola Solutions, Inc. | 0,08 | -2,32 | 34,23 | -6,19 | 0,2174 | -0,0292 | |||
| AMP / Ameriprise Financial, Inc. | 0,06 | 1,74 | 33,19 | 12,16 | 0,2108 | 0,0108 | |||
| CTVA / Corteva, Inc. | 0,44 | -1,33 | 33,15 | 16,86 | 0,2105 | 0,0188 | |||
| NRG / NRG Energy, Inc. | 0,20 | 1,40 | 32,70 | 70,57 | 0,2077 | 0,0781 | |||
| KKR / KKR & Co. Inc. | 0,24 | 1,39 | 32,25 | 16,67 | 0,2048 | 0,0180 | |||
| DD / DuPont de Nemours, Inc. | 0,44 | 1,15 | 30,14 | -7,10 | 0,1914 | -0,0278 | |||
| PCAR / PACCAR Inc | 0,31 | 2,95 | 29,68 | 0,50 | 0,1885 | -0,0111 | |||
| TPR / Tapestry, Inc. | 0,32 | 1,40 | 27,86 | 26,45 | 0,1769 | 0,0280 | |||
| IP / International Paper Company | 0,59 | 5,05 | 27,56 | -7,79 | 0,1750 | -0,0270 | |||
| MSCI / MSCI Inc. | 0,05 | 3,29 | 27,40 | 5,34 | 0,1740 | -0,0018 | |||
| TSN / Tyson Foods, Inc. | 0,48 | 4,44 | 26,80 | -8,44 | 0,1702 | -0,0276 | |||
| MCK / McKesson Corporation | 0,04 | 1,34 | 25,98 | 10,34 | 0,1650 | 0,0059 | |||
| BR / Broadridge Financial Solutions, Inc. | 0,11 | 1,39 | 25,90 | 1,62 | 0,1645 | -0,0078 | |||
| SBAC / SBA Communications Corporation | 0,11 | 6,03 | 25,89 | 13,17 | 0,1644 | 0,0098 | |||
| TSCO / Tractor Supply Company | 0,49 | 1,10 | 25,83 | -3,18 | 0,1641 | -0,0163 | |||
| BBY / Best Buy Co., Inc. | 0,38 | 1,73 | 25,83 | -7,23 | 0,1640 | -0,0241 | |||
| FNF / Fidelity National Financial, Inc. | 0,45 | 1,40 | 25,49 | -12,65 | 0,1619 | -0,0353 | |||
| ROST / Ross Stores, Inc. | 0,18 | 6,53 | 23,38 | 6,36 | 0,1485 | -0,0001 | |||
| URI / United Rentals, Inc. | 0,03 | 1,05 | 23,10 | 21,48 | 0,1467 | 0,0182 | |||
| ROL / Rollins, Inc. | 0,39 | 1,40 | 22,25 | 5,89 | 0,1413 | -0,0007 | |||
| OMC / Omnicom Group Inc. | 0,31 | -0,37 | 22,04 | -13,55 | 0,1400 | -0,0323 | |||
| XYL / Xylem Inc. | 0,17 | 1,72 | 21,97 | 10,15 | 0,1395 | 0,0047 | |||
| VST / Vistra Corp. | 0,11 | 1,40 | 21,85 | 67,35 | 0,1388 | 0,0505 | |||
| GWW / W.W. Grainger, Inc. | 0,02 | -3,66 | 20,83 | 1,45 | 0,1323 | -0,0065 | |||
| PKG / Packaging Corporation of America | 0,11 | -1,14 | 20,71 | -5,92 | 0,1315 | -0,0173 | |||
| CDW / CDW Corporation | 0,12 | 9,16 | 20,64 | 21,65 | 0,1311 | 0,0164 | |||
| NTAP / NetApp, Inc. | 0,19 | -0,36 | 20,56 | 20,87 | 0,1306 | 0,0156 | |||
| RMD / ResMed Inc. | 0,08 | 1,22 | 19,97 | 16,66 | 0,1269 | 0,0111 | |||
| BAX / Baxter International Inc. | 0,63 | -2,74 | 19,00 | -13,96 | 0,1207 | -0,0286 | |||
| MPWR / Monolithic Power Systems, Inc. | 0,03 | -5,34 | 18,84 | 19,37 | 0,1197 | 0,0130 | |||
| SWKS / Skyworks Solutions, Inc. | 0,24 | 1,67 | 18,07 | 17,24 | 0,1147 | 0,0106 | |||
| DAL / Delta Air Lines, Inc. | 0,36 | 1,20 | 17,94 | 14,16 | 0,1139 | 0,0077 | |||
| GEN / Gen Digital Inc. | 0,61 | 1,40 | 17,84 | 12,33 | 0,1133 | 0,0060 | |||
| WSO / Watsco, Inc. | 0,04 | 1,35 | 17,69 | -11,95 | 0,1123 | -0,0234 | |||
| DOV / Dover Corporation | 0,09 | 3,84 | 17,04 | 8,31 | 0,1082 | 0,0019 | |||
| STLD / Steel Dynamics, Inc. | 0,13 | -1,18 | 16,90 | 1,14 | 0,1073 | -0,0056 | |||
| CHRW / C.H. Robinson Worldwide, Inc. | 0,17 | 1,29 | 16,67 | -5,10 | 0,1059 | -0,0128 | |||
| WSM / Williams-Sonoma, Inc. | 0,10 | 1,41 | 15,90 | 4,79 | 0,1010 | -0,0016 | |||
| VRSK / Verisk Analytics, Inc. | 0,05 | 1,45 | 15,90 | 6,18 | 0,1010 | -0,0002 | |||
| AVY / Avery Dennison Corporation | 0,09 | 14,59 | 15,78 | 12,99 | 0,1002 | 0,0058 | |||
| DKS / DICK'S Sporting Goods, Inc. | 0,08 | 8,30 | 15,38 | 6,29 | 0,0977 | -0,0001 | |||
| HUBB / Hubbell Incorporated | 0,04 | -7,72 | 15,24 | 13,89 | 0,0968 | 0,0063 | |||
| HWM / Howmet Aerospace Inc. | 0,08 | 1,42 | 15,18 | 45,51 | 0,0964 | 0,0259 | |||
| A / Agilent Technologies, Inc. | 0,13 | 5,54 | 15,03 | 6,48 | 0,0954 | 0,0000 | |||
| EMN / Eastman Chemical Company | 0,20 | 1,84 | 14,78 | -13,71 | 0,0938 | -0,0219 | |||
| VMC / Vulcan Materials Company | 0,06 | 7,11 | 14,72 | 19,74 | 0,0935 | 0,0104 | |||
| REGN / Regeneron Pharmaceuticals, Inc. | 0,03 | 5,28 | 13,77 | -12,86 | 0,0874 | -0,0193 | |||
| DPZ / Domino's Pizza, Inc. | 0,03 | 1,39 | 13,64 | -0,55 | 0,0866 | -0,0061 | |||
| JEF / Jefferies Financial Group Inc. | 0,25 | 0,77 | 13,51 | 2,88 | 0,0858 | -0,0030 | |||
| BPOP / Popular, Inc. | 0,12 | 0,60 | 13,22 | 20,03 | 0,0840 | 0,0095 | |||
| MLM / Martin Marietta Materials, Inc. | 0,02 | 10,36 | 12,88 | 26,71 | 0,0818 | 0,0131 | |||
| EFX / Equifax Inc. | 0,05 | 1,04 | 12,78 | 7,60 | 0,0812 | 0,0009 | |||
| RPM / RPM International Inc. | 0,11 | 2,98 | 12,60 | -2,22 | 0,0800 | -0,0071 | |||
| RL / Ralph Lauren Corporation | 0,05 | 13,52 | 12,52 | 41,05 | 0,0795 | 0,0195 | |||
| EA / Electronic Arts Inc. | 0,08 | 1,33 | 12,40 | 11,98 | 0,0787 | 0,0039 | |||
| MAS / Masco Corporation | 0,19 | 1,43 | 12,14 | -6,13 | 0,0771 | -0,0103 | |||
| HLT / Hilton Worldwide Holdings Inc. | 0,05 | -5,95 | 12,12 | 10,08 | 0,0770 | 0,0026 | |||
| ERIE / Erie Indemnity Company | 0,03 | -4,53 | 12,03 | -20,99 | 0,0764 | -0,0265 | |||
| GGG / Graco Inc. | 0,14 | -5,47 | 11,91 | -2,69 | 0,0756 | -0,0071 | |||
| LECO / Lincoln Electric Holdings, Inc. | 0,06 | 1,18 | 11,84 | 10,89 | 0,0752 | 0,0030 | |||
| ADT / ADT Inc. | 1,39 | 8,45 | 11,81 | 12,85 | 0,0750 | 0,0043 | |||
| JKHY / Jack Henry & Associates, Inc. | 0,06 | 5,52 | 11,71 | 4,12 | 0,0743 | -0,0016 | |||
| ONB / Old National Bancorp | 0,54 | 0,94 | 11,43 | 1,65 | 0,0726 | -0,0034 | |||
| BAH / Booz Allen Hamilton Holding Corporation | 0,11 | 1,40 | 11,35 | 0,97 | 0,0721 | -0,0039 | |||
| EOG / EOG Resources, Inc. | 0,09 | -6,14 | 11,34 | -12,45 | 0,0720 | -0,0155 | |||
| OMF / OneMain Holdings, Inc. | 0,20 | -6,08 | 11,29 | 9,53 | 0,0717 | 0,0020 | |||
| SLM / SLM Corporation | 0,34 | 10,35 | 11,24 | 23,19 | 0,0714 | 0,0097 | |||
| SF / Stifel Financial Corp. | 0,11 | -6,04 | 11,20 | 3,44 | 0,0712 | -0,0020 | |||
| AOS / A. O. Smith Corporation | 0,17 | -3,92 | 10,94 | -3,61 | 0,0695 | -0,0072 | |||
| RGLD / Royal Gold, Inc. | 0,06 | 1,39 | 10,77 | 10,28 | 0,0684 | 0,0024 | |||
| SCI / Service Corporation International | 0,13 | -11,02 | 10,75 | -9,69 | 0,0683 | -0,0122 | |||
| VOYA / Voya Financial, Inc. | 0,15 | 11,76 | 10,56 | 17,10 | 0,0671 | 0,0061 | |||
| NEU / NewMarket Corporation | 0,02 | 10,94 | 10,53 | 35,31 | 0,0669 | 0,0143 | |||
| SEIC / SEI Investments Company | 0,12 | 26,45 | 10,51 | 46,37 | 0,0668 | 0,0182 | |||
| ODFL / Old Dominion Freight Line, Inc. | 0,06 | 3,78 | 10,45 | 1,80 | 0,0664 | -0,0030 | |||
| TXRH / Texas Roadhouse, Inc. | 0,06 | -8,60 | 10,37 | 2,81 | 0,0658 | -0,0023 | |||
| PWR / Quanta Services, Inc. | 0,03 | -8,19 | 10,34 | 36,56 | 0,0656 | 0,0145 | |||
| POOL / Pool Corporation | 0,04 | -1,93 | 10,31 | -10,21 | 0,0655 | -0,0121 | |||
| CSL / Carlisle Companies Incorporated | 0,03 | 5,46 | 10,29 | 15,65 | 0,0653 | 0,0052 | |||
| LII / Lennox International Inc. | 0,02 | 2,00 | 10,28 | 4,25 | 0,0653 | -0,0014 | |||
| JBHT / J.B. Hunt Transport Services, Inc. | 0,07 | -3,74 | 10,23 | -6,57 | 0,0650 | -0,0090 | |||
| MPC / Marathon Petroleum Corporation | 0,06 | 2,75 | 10,23 | 17,16 | 0,0650 | 0,0060 | |||
| FDS / FactSet Research Systems Inc. | 0,02 | 1,01 | 10,22 | -0,62 | 0,0649 | -0,0046 | |||
| R / Ryder System, Inc. | 0,06 | 1,67 | 10,22 | 12,39 | 0,0649 | 0,0035 | |||
| WAL / Western Alliance Bancorporation | 0,13 | 2,49 | 10,20 | 4,02 | 0,0648 | -0,0015 | |||
| HLI / Houlihan Lokey, Inc. | 0,06 | 12,90 | 10,17 | 25,79 | 0,0646 | 0,0099 | |||
| NDSN / Nordson Corporation | 0,05 | 17,35 | 10,15 | 24,72 | 0,0645 | 0,0095 | |||
| IEX / IDEX Corporation | 0,06 | 10,14 | 10,08 | 6,85 | 0,0640 | 0,0003 | |||
| PHM / PulteGroup, Inc. | 0,10 | 18,38 | 10,07 | 21,44 | 0,0640 | 0,0079 | |||
| BFB / Brown-Forman Corp. - Class B | 0,37 | -1,40 | 9,85 | -21,82 | 0,0626 | -0,0226 | |||
| DCI / Donaldson Company, Inc. | 0,14 | -7,92 | 9,78 | -4,78 | 0,0621 | -0,0073 | |||
| AL / Air Lease Corporation | 0,16 | 1,40 | 9,44 | 22,78 | 0,0599 | 0,0080 | |||
| ARMK / Aramark | 0,22 | 12,22 | 9,22 | 36,12 | 0,0586 | 0,0128 | |||
| NXST / Nexstar Media Group, Inc. | 0,05 | 15,55 | 9,22 | 11,50 | 0,0586 | 0,0027 | |||
| PSX / Phillips 66 | 0,08 | 12,59 | 9,14 | 8,78 | 0,0581 | 0,0013 | |||
| LPLA / LPL Financial Holdings Inc. | 0,02 | 1,31 | 9,06 | 16,12 | 0,0575 | 0,0048 | |||
| BFA / Brown-Forman Corp. - Class A | 0,33 | 4,15 | 8,98 | -14,52 | 0,0570 | -0,0140 | |||
| PRMB / Primo Brands Corporation | 0,30 | 1,40 | 8,93 | -15,37 | 0,0567 | -0,0146 | |||
| OKE / ONEOK, Inc. | 0,11 | -3,66 | 8,88 | -20,74 | 0,0564 | -0,0193 | |||
| EVR / Evercore Inc. | 0,03 | -3,16 | 8,84 | 30,94 | 0,0561 | 0,0105 | |||
| WWD / Woodward, Inc. | 0,04 | 1,35 | 8,61 | 36,13 | 0,0547 | 0,0119 | |||
| TTC / The Toro Company | 0,12 | 8,39 | 8,60 | 5,31 | 0,0546 | -0,0006 | |||
| ITT / ITT Inc. | 0,05 | -16,11 | 8,35 | 1,87 | 0,0530 | -0,0024 | |||
| CASY / Casey's General Stores, Inc. | 0,02 | 12,58 | 8,34 | 32,36 | 0,0530 | 0,0104 | |||
| EXPE / Expedia Group, Inc. | 0,05 | 1,40 | 8,26 | 1,75 | 0,0525 | -0,0024 | |||
| BWXT / BWX Technologies, Inc. | 0,06 | 18,59 | 8,24 | 73,17 | 0,0524 | 0,0202 | |||
| FCFS / FirstCash Holdings, Inc. | 0,06 | 1,38 | 8,24 | 13,88 | 0,0523 | 0,0034 | |||
| VRT / Vertiv Holdings Co | 0,06 | -12,16 | 8,23 | 56,22 | 0,0523 | 0,0167 | |||
| DREYFUS TRSY OBLIG CASH M / STIV (000000000) | 8,20 | 8,20 | 0,0521 | 0,0521 | |||||
| DREYFUS TRSY OBLIG CASH M / STIV (000000000) | 8,20 | 8,20 | 0,0521 | 0,0521 | |||||
| LEA / Lear Corporation | 0,09 | 1,98 | 8,17 | 9,79 | 0,0519 | 0,0016 | |||
| FMC / FMC Corporation | 0,19 | 0,48 | 8,04 | -0,57 | 0,0511 | -0,0036 | |||
| VLY / Valley National Bancorp | 0,89 | 2,65 | 7,98 | 3,10 | 0,0507 | -0,0016 | |||
| MKTX / MarketAxess Holdings Inc. | 0,04 | -7,80 | 7,89 | -4,81 | 0,0501 | -0,0059 | |||
| JBL / Jabil Inc. | 0,04 | -1,16 | 7,88 | 58,44 | 0,0500 | 0,0164 | |||
| FLS / Flowserve Corporation | 0,15 | -2,60 | 7,84 | 4,39 | 0,0498 | -0,0010 | |||
| NYT / The New York Times Company | 0,14 | -5,61 | 7,79 | 6,54 | 0,0495 | 0,0001 | |||
| MSM / MSC Industrial Direct Co., Inc. | 0,09 | -15,58 | 7,77 | -7,59 | 0,0494 | -0,0075 | |||
| TKR / The Timken Company | 0,11 | 5,39 | 7,68 | 6,39 | 0,0488 | -0,0000 | |||
| THO / THOR Industries, Inc. | 0,09 | -2,52 | 7,66 | 14,19 | 0,0487 | 0,0033 | |||
| VLO / Valero Energy Corporation | 0,06 | 21,63 | 7,64 | 23,80 | 0,0485 | 0,0068 | |||
| WH / Wyndham Hotels & Resorts, Inc. | 0,09 | 3,73 | 7,63 | -6,92 | 0,0484 | -0,0069 | |||
| TRGP / Targa Resources Corp. | 0,04 | -8,67 | 7,54 | -20,70 | 0,0479 | -0,0164 | |||
| EHC / Encompass Health Corporation | 0,06 | 1,39 | 7,44 | 22,75 | 0,0473 | 0,0063 | |||
| ATR / AptarGroup, Inc. | 0,05 | 0,50 | 7,43 | 5,95 | 0,0472 | -0,0002 | |||
| AVT / Avnet, Inc. | 0,14 | 24,96 | 7,37 | 37,93 | 0,0468 | 0,0107 | |||
| PAYC / Paycom Software, Inc. | 0,03 | 1,32 | 7,37 | 7,31 | 0,0468 | 0,0004 | |||
| BSY / Bentley Systems, Incorporated | 0,14 | 21,29 | 7,37 | 66,40 | 0,0468 | 0,0169 | |||
| HES / Hess Corporation | 0,05 | -7,84 | 7,21 | -20,07 | 0,0458 | -0,0152 | |||
| SLGN / Silgan Holdings Inc. | 0,13 | 0,90 | 7,13 | 6,93 | 0,0453 | 0,0002 | |||
| CRS / Carpenter Technology Corporation | 0,03 | 5,47 | 7,08 | 60,88 | 0,0450 | 0,0152 | |||
| GBCI / Glacier Bancorp, Inc. | 0,16 | -5,20 | 7,08 | -7,65 | 0,0450 | -0,0069 | |||
| BYD / Boyd Gaming Corporation | 0,09 | -4,02 | 6,94 | 14,06 | 0,0440 | 0,0029 | |||
| OLED / Universal Display Corporation | 0,04 | -5,71 | 6,89 | 4,41 | 0,0438 | -0,0008 | |||
| BC / Brunswick Corporation | 0,12 | -2,48 | 6,67 | 0,03 | 0,0424 | -0,0027 | |||
| WCC / WESCO International, Inc. | 0,04 | -2,85 | 6,67 | 15,86 | 0,0424 | 0,0035 | |||
| FBIN / Fortune Brands Innovations, Inc. | 0,13 | 0,34 | 6,64 | -15,15 | 0,0422 | -0,0107 | |||
| DLB / Dolby Laboratories, Inc. | 0,09 | 1,42 | 6,61 | -6,22 | 0,0420 | -0,0057 | |||
| TRU / TransUnion | 0,07 | -0,89 | 6,59 | 5,11 | 0,0418 | -0,0005 | |||
| CNS / Cohen & Steers, Inc. | 0,09 | -0,89 | 6,55 | -6,94 | 0,0416 | -0,0060 | |||
| SIGI / Selective Insurance Group, Inc. | 0,08 | -12,45 | 6,53 | -17,13 | 0,0414 | -0,0118 | |||
| OXY / Occidental Petroleum Corporation | 0,15 | -6,40 | 6,50 | -20,33 | 0,0413 | -0,0139 | |||
| CR / Crane Company | 0,03 | 18,75 | 6,35 | 47,20 | 0,0403 | 0,0112 | |||
| LFUS / Littelfuse, Inc. | 0,03 | -8,38 | 6,31 | 5,59 | 0,0401 | -0,0003 | |||
| NWSA / News Corporation | 0,21 | -22,03 | 6,28 | -14,88 | 0,0399 | -0,0100 | |||
| COKE / Coca-Cola Consolidated, Inc. | 0,06 | 910,63 | 6,16 | -16,42 | 0,0391 | -0,0107 | |||
| SAIC / Science Applications International Corporation | 0,05 | -12,32 | 6,09 | -12,05 | 0,0387 | -0,0081 | |||
| GEHC / GE HealthCare Technologies Inc. | 0,08 | 2,12 | 5,96 | -6,27 | 0,0379 | -0,0051 | |||
| WMG / Warner Music Group Corp. | 0,22 | 0,82 | 5,91 | -12,40 | 0,0376 | -0,0081 | |||
| NWS / News Corporation | 0,17 | 37,08 | 5,89 | 54,87 | 0,0374 | 0,0117 | |||
| GNTX / Gentex Corporation | 0,26 | 8,10 | 5,81 | 2,02 | 0,0369 | -0,0016 | |||
| ALSN / Allison Transmission Holdings, Inc. | 0,06 | 1,86 | 5,78 | 1,14 | 0,0367 | -0,0019 | |||
| TW / Tradeweb Markets Inc. | 0,04 | -11,32 | 5,77 | -12,55 | 0,0366 | -0,0079 | |||
| HEI / HEICO Corporation | 0,02 | -12,75 | 5,72 | 7,11 | 0,0363 | 0,0002 | |||
| LSTR / Landstar System, Inc. | 0,04 | -7,20 | 5,70 | -14,11 | 0,0362 | -0,0087 | |||
| RHI / Robert Half Inc. | 0,14 | -7,65 | 5,68 | -30,51 | 0,0361 | -0,0192 | |||
| FIX / Comfort Systems USA, Inc. | 0,01 | -14,87 | 5,65 | 41,62 | 0,0359 | 0,0089 | |||
| PFSI / PennyMac Financial Services, Inc. | 0,06 | -10,63 | 5,65 | -11,05 | 0,0359 | -0,0070 | |||
| HLNE / Hamilton Lane Incorporated | 0,04 | 17,35 | 5,55 | 12,19 | 0,0353 | 0,0018 | |||
| MORN / Morningstar, Inc. | 0,02 | 10,01 | 5,40 | 15,16 | 0,0343 | 0,0026 | |||
| KTB / Kontoor Brands, Inc. | 0,08 | 1,93 | 5,39 | 4,86 | 0,0343 | -0,0005 | |||
| CMC / Commercial Metals Company | 0,11 | 8,47 | 5,38 | 15,30 | 0,0342 | 0,0026 | |||
| LAD / Lithia Motors, Inc. | 0,02 | -5,52 | 5,36 | 8,74 | 0,0341 | 0,0007 | |||
| WMS / Advanced Drainage Systems, Inc. | 0,05 | -1,66 | 5,36 | 3,96 | 0,0340 | -0,0008 | |||
| KBR / KBR, Inc. | 0,11 | 1,42 | 5,35 | -2,37 | 0,0340 | -0,0031 | |||
| HXL / Hexcel Corporation | 0,09 | -0,29 | 5,33 | 2,86 | 0,0339 | -0,0012 | |||
| BMI / Badger Meter, Inc. | 0,02 | 15,87 | 5,29 | 49,21 | 0,0336 | 0,0096 | |||
| AMKR / Amkor Technology, Inc. | 0,25 | 25,13 | 5,28 | 45,45 | 0,0335 | 0,0090 | |||
| MKSI / MKS Inc. | 0,05 | -9,43 | 5,28 | 12,28 | 0,0335 | 0,0017 | |||
| AWI / Armstrong World Industries, Inc. | 0,03 | -17,88 | 5,18 | -5,32 | 0,0329 | -0,0041 | |||
| COLM / Columbia Sportswear Company | 0,08 | 8,83 | 5,14 | -12,17 | 0,0326 | -0,0069 | |||
| LPX / Louisiana-Pacific Corporation | 0,06 | -4,05 | 5,13 | -10,29 | 0,0326 | -0,0061 | |||
| CGNX / Cognex Corporation | 0,16 | -6,04 | 5,13 | -0,10 | 0,0326 | -0,0021 | |||
| TTEK / Tetra Tech, Inc. | 0,14 | 32,85 | 5,12 | 63,33 | 0,0325 | 0,0113 | |||
| FSS / Federal Signal Corporation | 0,05 | 33,03 | 5,08 | 92,53 | 0,0323 | 0,0144 | |||
| CBT / Cabot Corporation | 0,07 | 5,76 | 5,06 | -4,60 | 0,0322 | -0,0037 | |||
| FELE / Franklin Electric Co., Inc. | 0,06 | 2,23 | 5,05 | -2,28 | 0,0321 | -0,0029 | |||
| KBH / KB Home | 0,10 | -12,47 | 5,03 | -20,23 | 0,0320 | -0,0107 | |||
| UHS / Universal Health Services, Inc. | 0,03 | -11,56 | 4,90 | -14,75 | 0,0311 | -0,0077 | |||
| SFBS / ServisFirst Bancshares, Inc. | 0,06 | -2,25 | 4,87 | -8,27 | 0,0309 | -0,0050 | |||
| TER / Teradyne, Inc. | 0,05 | 4,41 | 4,85 | 13,65 | 0,0308 | 0,0020 | |||
| RYAN / Ryan Specialty Holdings, Inc. | 0,07 | 1,41 | 4,84 | -6,67 | 0,0308 | -0,0043 | |||
| UFPI / UFP Industries, Inc. | 0,05 | 3,02 | 4,80 | -4,36 | 0,0305 | -0,0034 | |||
| TPL / Texas Pacific Land Corporation | 0,00 | 1,18 | 4,71 | -19,33 | 0,0299 | -0,0095 | |||
| PIPR / Piper Sandler Companies | 0,02 | -13,81 | 4,64 | -3,25 | 0,0295 | -0,0030 | |||
| AIT / Applied Industrial Technologies, Inc. | 0,02 | 4,79 | 4,56 | 8,10 | 0,0290 | 0,0005 | |||
| CHE / Chemed Corporation | 0,01 | 1,17 | 4,39 | -19,94 | 0,0279 | -0,0092 | |||
| TXT / Textron Inc. | 0,05 | -12,86 | 4,33 | -3,15 | 0,0275 | -0,0027 | |||
| TECH / Bio-Techne Corporation | 0,08 | -1,96 | 4,31 | -13,97 | 0,0274 | -0,0065 | |||
| LENB / Lennar Corp. - Class B | 0,04 | -23,92 | 4,06 | -26,58 | 0,0258 | -0,0116 | |||
| RUSHA / Rush Enterprises, Inc. | 0,08 | -0,50 | 4,04 | -4,04 | 0,0257 | -0,0028 | |||
| TNET / TriNet Group, Inc. | 0,06 | -17,06 | 4,04 | -23,45 | 0,0256 | -0,0100 | |||
| SSD / Simpson Manufacturing Co., Inc. | 0,03 | 7,57 | 4,01 | 6,36 | 0,0255 | -0,0000 | |||
| MUSA / Murphy USA Inc. | 0,01 | 25,12 | 3,99 | 8,34 | 0,0253 | 0,0004 | |||
| IBP / Installed Building Products, Inc. | 0,02 | -17,99 | 3,79 | -13,76 | 0,0241 | -0,0056 | |||
| HRI / Herc Holdings Inc. | 0,03 | -3,77 | 3,68 | -5,60 | 0,0234 | -0,0030 | |||
| WST / West Pharmaceutical Services, Inc. | 0,02 | 8,56 | 3,60 | 6,10 | 0,0229 | -0,0001 | |||
| KNSL / Kinsale Capital Group, Inc. | 0,01 | 27,84 | 3,59 | 27,12 | 0,0228 | 0,0037 | |||
| ENSG / The Ensign Group, Inc. | 0,02 | -30,17 | 3,37 | -16,74 | 0,0214 | -0,0060 | |||
| VNT / Vontier Corporation | 0,09 | 30,31 | 3,37 | 46,39 | 0,0214 | 0,0058 | |||
| HAL / Halliburton Company | 0,16 | 13,62 | 3,34 | -8,73 | 0,0212 | -0,0035 | |||
| EXP / Eagle Materials Inc. | 0,02 | -15,42 | 3,27 | -22,97 | 0,0208 | -0,0079 | |||
| HEIA / Heico Corp. - Class A | 0,01 | 1,27 | 3,23 | 24,23 | 0,0205 | 0,0029 | |||
| MOGA / Moog, Inc. - Class A | 0,02 | 45,92 | 3,20 | 52,33 | 0,0203 | 0,0061 | |||
| SNDR / Schneider National, Inc. | 0,13 | 25,78 | 3,20 | 32,92 | 0,0203 | 0,0041 | |||
| OLN / Olin Corporation | 0,15 | -6,26 | 3,00 | -22,33 | 0,0191 | -0,0071 | |||
| AMG / Affiliated Managers Group, Inc. | 0,01 | -22,06 | 2,95 | -8,73 | 0,0187 | -0,0031 | |||
| BDC / Belden Inc. | 0,02 | 30,52 | 2,83 | 50,80 | 0,0180 | 0,0053 | |||
| CHDN / Churchill Downs Incorporated | 0,03 | -0,23 | 2,77 | -9,25 | 0,0176 | -0,0030 | |||
| RRC / Range Resources Corporation | 0,07 | 1,43 | 2,70 | 3,33 | 0,0172 | -0,0005 | |||
| BRKR / Bruker Corporation | 0,06 | 10,25 | 2,66 | 8,86 | 0,0169 | 0,0004 | |||
| CTRA / Coterra Energy Inc. | 0,10 | 1,42 | 2,64 | -10,96 | 0,0168 | -0,0033 | |||
| ACA / Arcosa, Inc. | 0,03 | 14,49 | 2,45 | 28,74 | 0,0155 | 0,0027 | |||
| BCC / Boise Cascade Company | 0,03 | 2,03 | 2,40 | -9,70 | 0,0153 | -0,0027 | |||
| AAON / AAON, Inc. | 0,03 | 1,35 | 2,30 | -4,33 | 0,0146 | -0,0016 | |||
| CSW / CSW Industrials, Inc. | 0,01 | -3,16 | 2,18 | -4,73 | 0,0138 | -0,0016 | |||
| MGY / Magnolia Oil & Gas Corporation | 0,06 | -33,90 | 1,37 | -41,19 | 0,0087 | -0,0071 | |||
| DREY INST PREF GOV MM-M / STIV (000000000) | 1,35 | 1,35 | 0,0086 | 0,0086 | |||||
| DREY INST PREF GOV MM-M / STIV (000000000) | 1,35 | 1,35 | 0,0086 | 0,0086 | |||||
| MTDR / Matador Resources Company | 0,03 | 4 288,56 | 1,34 | 4 075,00 | 0,0085 | 0,0083 | |||
| CHX / ChampionX Corporation | 0,05 | -15,17 | 1,13 | -29,27 | 0,0072 | -0,0036 | |||
| MUR / Murphy Oil Corporation | 0,05 | 12 898,13 | 1,09 | 10 830,00 | 0,0069 | 0,0069 | |||
| SM / SM Energy Company | 0,04 | 651,78 | 0,93 | 523,49 | 0,0059 | 0,0049 | |||
| CRC / California Resources Corporation | 0,02 | 1,27 | 0,76 | 5,12 | 0,0048 | -0,0001 |