Statistiques de base
| Profil de l'initié | WINMILL & CO. INC |
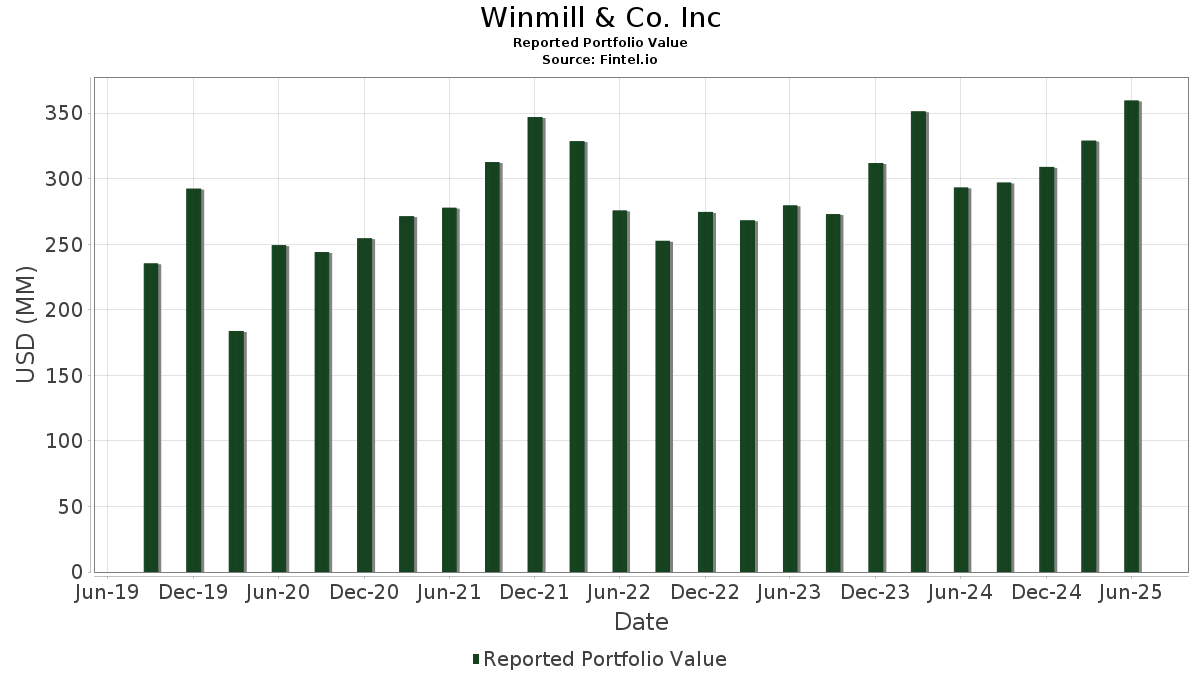
| Valeur du portefeuille | $ 359 600 974 |
| Positions actuelles | 55 |
Dernières positions, performances, ASG (à partir des dépôts 13F, 13D)
Winmill & Co. Inc a déclaré un total de 55 positions dans ses derniers dépôts auprès de la SEC. La valeur la plus récente du portefeuille est calculée à 359 600 974 USD. Les actifs sous gestion réels (ASG) sont cette valeur plus les liquidités (qui ne sont pas divulguées). Les principales positions de Winmill & Co. Inc sont AutoZone, Inc. (US:AZO) , Steel Dynamics, Inc. (US:STLD) , Alphabet Inc. (US:GOOGL) , LPL Financial Holdings Inc. (US:LPLA) , and Williams-Sonoma, Inc. (US:WSM) . Les nouvelles positions de Winmill & Co. Inc incluent Allison Transmission Holdings, Inc. (US:ALSN) , PayPal Holdings, Inc. (US:PYPL) , Triple Flag Precious Metals Corp. (US:TFPM) , QUALCOMM Incorporated (US:QCOM) , and .
Meilleures augmentations ce trimestre
Nous utilisons la variation de l'allocation du portefeuille car il s'agit de l'indicateur le plus significatif. Les changements peuvent être dus à des transactions ou à des variations de prix des actions.
| Titre | Actions (en millions) |
Valeur ($ en millions) |
% du portefeuille | ΔPortefeuille % |
|---|---|---|---|---|
| 1,25 | 9,16 | 2,3076 | 2,1025 | |
| 0,08 | 7,55 | 2,1000 | 2,1000 | |
| 0,07 | 5,50 | 1,5294 | 1,5294 | |
| 0,24 | 14,98 | 3,7749 | 0,5462 | |
| 0,33 | 18,13 | 4,5684 | 0,4510 | |
| 2,10 | 10,39 | 2,6193 | 0,3717 | |
| 0,02 | 11,61 | 3,2283 | 0,2929 | |
| 0,11 | 10,61 | 2,6735 | 0,2647 | |
| 0,03 | 0,71 | 0,1976 | 0,1976 | |
| 0,00 | 0,67 | 0,1860 | 0,1860 |
Principales baisses ce trimestre
Nous utilisons la variation de l'allocation du portefeuille car il s'agit de l'indicateur le plus significatif. Les changements peuvent être dus à des transactions ou à des variations de prix des actions.
| Titre | Actions (en millions) |
Valeur ($ en millions) |
% du portefeuille | ΔPortefeuille % |
|---|---|---|---|---|
| 0,01 | 26,24 | 6,6124 | -1,5806 | |
| 0,02 | 5,14 | 1,4293 | -1,1937 | |
| 0,11 | 18,30 | 4,6103 | -0,7720 | |
| 0,03 | 12,78 | 3,2203 | -0,7173 | |
| 0,03 | 8,65 | 2,1798 | -0,6681 | |
| 0,07 | 7,18 | 1,8101 | -0,5423 | |
| 0,17 | 13,45 | 3,3898 | -0,5282 | |
| 0,22 | 13,63 | 3,4354 | -0,5035 | |
| 0,17 | 21,60 | 6,0070 | -0,4090 | |
| 0,00 | 8,84 | 2,2276 | -0,4083 |
Déclarations 13F et dépôts de fonds
Ce formulaire a été déposé le 2025-08-01 pour la période de déclaration 2025-06-30. Cliquez sur l'icône du lien pour voir l'historique complet des transactions.
Mettre à niveau pour débloquer les données premium et exporter vers Excel ![]() .
.
| Titre | Type | Prix moyen de l'action | Actions (en millions) |
ΔActions (%) |
ΔActions (%) |
Valeur ($ en millions) |
Portefeuille (%) |
ΔPortefeuille (%) |
|
|---|---|---|---|---|---|---|---|---|---|
| AZO / AutoZone, Inc. | 0,01 | 0,00 | 26,24 | -2,64 | 6,6124 | -1,5806 | |||
| STLD / Steel Dynamics, Inc. | 0,17 | 0,00 | 21,60 | 2,35 | 6,0070 | -0,4090 | |||
| GOOGL / Alphabet Inc. | 0,11 | 0,00 | 19,05 | 13,96 | 4,8003 | -0,2812 | |||
| LPLA / LPL Financial Holdings Inc. | 0,05 | 0,00 | 18,32 | 14,62 | 4,6165 | -0,2423 | |||
| WSM / Williams-Sonoma, Inc. | 0,11 | 0,00 | 18,30 | 3,33 | 4,6103 | -0,7720 | |||
| IBKR / Interactive Brokers Group, Inc. | 0,33 | 300,00 | 18,13 | 33,85 | 4,5684 | 0,4510 | |||
| NMIH / NMI Holdings, Inc. | 0,40 | 0,00 | 16,71 | 17,03 | 4,2109 | -0,1297 | |||
| DFIN / Donnelley Financial Solutions, Inc. | 0,24 | 0,00 | 14,98 | 41,04 | 3,7749 | 0,5462 | |||
| ESNT / Essent Group Ltd. | 0,22 | 0,00 | 13,63 | 5,21 | 3,4354 | -0,5035 | |||
| MLI / Mueller Industries, Inc. | 0,17 | 0,00 | 13,45 | 4,38 | 3,3898 | -0,5282 | |||
| CACC / Credit Acceptance Corporation | 0,03 | 0,00 | 12,78 | -1,34 | 3,2203 | -0,7173 | |||
| KGC / Kinross Gold Corporation | 0,82 | 2,00 | 12,75 | 26,44 | 3,2118 | 0,1472 | |||
| URI / United Rentals, Inc. | 0,02 | 0,00 | 11,61 | 20,23 | 3,2283 | 0,2929 | |||
| WPM / Wheaton Precious Metals Corp. | 0,13 | 4,63 | 11,56 | 21,04 | 2,9122 | 0,0097 | |||
| LRCX / Lam Research Corporation | 0,11 | 0,00 | 10,61 | 33,90 | 2,6735 | 0,2647 | |||
| NGD / New Gold Inc. | 2,10 | 5,37 | 10,39 | 40,59 | 2,6193 | 0,3717 | |||
| IAG / IAMGOLD Corporation | 1,25 | 1 053,70 | 9,16 | 1 256,74 | 2,3076 | 2,1025 | |||
| DDS / Dillard's, Inc. | 0,02 | 0,00 | 9,00 | 16,67 | 2,2676 | -0,0771 | |||
| NVR / NVR, Inc. | 0,00 | 0,00 | 8,84 | 1,95 | 2,2276 | -0,4083 | |||
| SNA / Snap-on Incorporated | 0,03 | 0,00 | 8,65 | -7,66 | 2,1798 | -0,6681 | |||
| YOU / Clear Secure, Inc. | 0,29 | 0,00 | 8,03 | 7,14 | 2,0225 | -0,2548 | |||
| ALSN / Allison Transmission Holdings, Inc. | 0,08 | 7,55 | 2,1000 | 2,1000 | |||||
| UFPI / UFP Industries, Inc. | 0,07 | 0,00 | 7,18 | -7,17 | 1,8101 | -0,5423 | |||
| MA / Mastercard Incorporated | 0,01 | 0,00 | 5,62 | 2,52 | 1,4160 | -0,2502 | |||
| MTDR / Matador Resources Company | 0,12 | 0,00 | 5,53 | -6,59 | 1,5374 | -0,2618 | |||
| PYPL / PayPal Holdings, Inc. | 0,07 | 5,50 | 1,5294 | 1,5294 | |||||
| UNH / UnitedHealth Group Incorporated | 0,02 | 0,00 | 5,14 | -40,44 | 1,4293 | -1,1937 | |||
| CROX / Crocs, Inc. | 0,04 | 0,00 | 4,36 | -4,63 | 1,0997 | -0,2914 | |||
| ELV / Elevance Health, Inc. | 0,01 | 0,00 | 3,91 | -10,56 | 1,0860 | -0,2415 | |||
| AEM / Agnico Eagle Mines Limited | 0,03 | 0,00 | 3,57 | 9,69 | 0,9922 | 0,0036 | |||
| SELF / Global Self Storage, Inc. | 0,48 | 4,19 | 2,56 | 10,40 | 0,6446 | -0,0598 | |||
| BRK.B / Berkshire Hathaway Inc. | 0,01 | 0,00 | 2,48 | -8,80 | 0,6243 | -0,2014 | |||
| JPM / JPMorgan Chase & Co. | 0,01 | 0,00 | 1,97 | 18,17 | 0,4967 | -0,0103 | |||
| EXR / Extra Space Storage Inc. | 0,01 | 0,00 | 1,48 | -0,67 | 0,3725 | -0,0801 | |||
| GLD / SPDR Gold Trust | 0,00 | 0,00 | 1,06 | 5,81 | 0,2661 | -0,0373 | |||
| NEM / Newmont Corporation | 0,02 | 29,96 | 1,05 | 56,89 | 0,2642 | 0,0610 | |||
| RGLD / Royal Gold, Inc. | 0,01 | 0,00 | 0,94 | 8,78 | 0,2375 | -0,0259 | |||
| BBW / Build-A-Bear Workshop, Inc. | 0,02 | 0,00 | 0,85 | 38,66 | 0,2144 | 0,0279 | |||
| META / Meta Platforms, Inc. | 0,00 | 0,00 | 0,85 | 28,10 | 0,2139 | 0,0124 | |||
| FNV / Franco-Nevada Corporation | 0,00 | 78,29 | 0,75 | 85,71 | 0,1900 | 0,0664 | |||
| SLV / iShares Silver Trust | 0,02 | 0,00 | 0,73 | 5,93 | 0,2036 | -0,0066 | |||
| TFPM / Triple Flag Precious Metals Corp. | 0,03 | 0,71 | 0,1976 | 0,1976 | |||||
| QCOM / QUALCOMM Incorporated | 0,00 | 0,67 | 0,1860 | 0,1860 | |||||
| CUBE / CubeSmart | 0,01 | 0,00 | 0,59 | -0,34 | 0,1499 | -0,0318 | |||
| PSA / Public Storage | 0,00 | 0,00 | 0,50 | -1,97 | 0,1257 | -0,0290 | |||
| GOOG / Alphabet Inc. | 0,00 | 0,00 | 0,10 | 14,77 | 0,0255 | -0,0015 | |||
| MXE / Mexico Equity & Income Fund Inc. | 0,01 | 0,00 | 0,06 | 19,23 | 0,0158 | -0,0001 | |||
| SPE / Special Opportunities Fund, Inc. | 0,00 | 0,00 | 0,03 | 0,00 | 0,0078 | -0,0013 | |||
| BRW / Saba Capital Income & Opportunities Fund | 0,00 | 0,00 | 0,03 | 7,41 | 0,0073 | -0,0012 | |||
| SWZ / Total Return Securities, Inc. | 0,00 | 0,00 | 0,02 | -33,33 | 0,0058 | -0,0034 | |||
| SPE.PRC / Special Opportunities Fund, Inc. - Preferred Stock | 0,00 | 0,00 | 0,00 | 0,00 | 0,0012 | -0,0002 | |||
| PCF / High Income Securities Fund | 0,00 | 0,00 | 0,00 | 0,00 | 0,0011 | -0,0003 | |||
| CEFS / Exchange Listed Funds Trust - Saba Closed-End Funds ETF | 0,00 | 0,00 | 0,00 | 0,00 | 0,0006 | -0,0001 | |||
| SABA / Saba Capital Income & Opportunities Fund II | 0,00 | 0,00 | 0,00 | 0,0000 | -0,0000 | ||||
| SVVC / Firsthand Technology Value Fund, Inc. | 0,00 | 0,00 | 0,00 | 0,0000 | -0,0000 | ||||
| RIO / Rio Tinto Group - Depositary Receipt (Common Stock) | 0,00 | -100,00 | 0,00 | 0,0000 | |||||
| ATKR / Atkore Inc. | 0,00 | -100,00 | 0,00 | 0,0000 | |||||
| INSW / International Seaways, Inc. | 0,00 | -100,00 | 0,00 | 0,0000 | |||||
| POOL / Pool Corporation | 0,00 | -100,00 | 0,00 | 0,0000 | |||||
| VLO / Valero Energy Corporation | 0,00 | -100,00 | 0,00 | 0,0000 | |||||
| CGAU / Centerra Gold Inc. | 0,00 | -100,00 | 0,00 | 0,0000 |