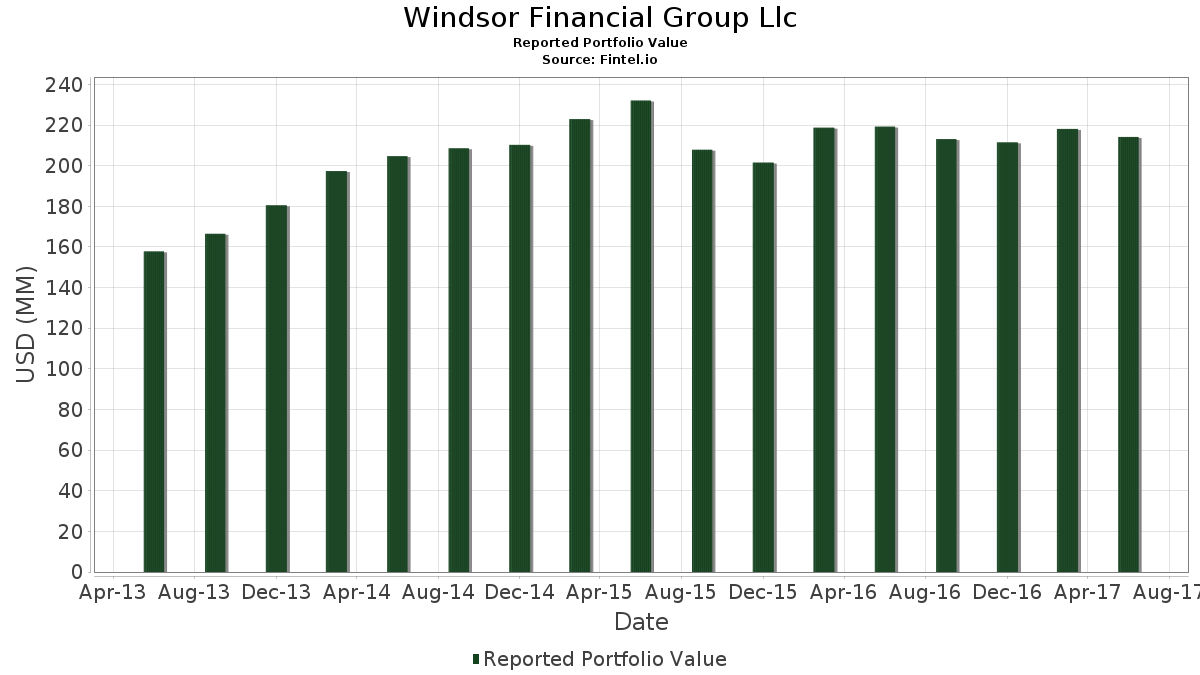
Statistiques de base
| Valeur du portefeuille | $ 214 150 000 |
| Positions actuelles | 79 |
Dernières positions, performances, ASG (à partir des dépôts 13F, 13D)
Windsor Financial Group Llc a déclaré un total de 79 positions dans ses derniers dépôts auprès de la SEC. La valeur la plus récente du portefeuille est calculée à 214 150 000 USD. Les actifs sous gestion réels (ASG) sont cette valeur plus les liquidités (qui ne sont pas divulguées). Les principales positions de Windsor Financial Group Llc sont Berkshire Hathaway Inc. (US:BRK.B) , Vanguard Scottsdale Funds - Vanguard Short-Term Corporate Bond ETF (US:VCSH) , Markel Group Inc. (US:MKL) , Apple Inc. (US:AAPL) , and Comcast Corporation (US:CMCSA) .
Meilleures augmentations ce trimestre
Nous utilisons la variation de l'allocation du portefeuille car il s'agit de l'indicateur le plus significatif. Les changements peuvent être dus à des transactions ou à des variations de prix des actions.
| Titre | Actions (en millions) |
Valeur ($ en millions) |
% du portefeuille | ΔPortefeuille % |
|---|---|---|---|---|
| 0,11 | 9,10 | 4,2489 | 4,2489 | |
| 0,17 | 5,72 | 2,6734 | 2,6734 | |
| 0,04 | 5,54 | 2,5856 | 2,5856 | |
| 0,06 | 5,43 | 2,5347 | 2,5347 | |
| 0,04 | 4,89 | 2,2858 | 2,2858 | |
| 0,06 | 4,85 | 2,2638 | 2,2638 | |
| 0,05 | 3,77 | 1,7618 | 1,7618 | |
| 0,10 | 1,18 | 0,5496 | 0,5496 | |
| 0,10 | 4,94 | 2,3077 | 0,2921 | |
| 0,01 | 6,42 | 2,9998 | 0,2588 |
Principales baisses ce trimestre
Nous utilisons la variation de l'allocation du portefeuille car il s'agit de l'indicateur le plus significatif. Les changements peuvent être dus à des transactions ou à des variations de prix des actions.
| Titre | Actions (en millions) |
Valeur ($ en millions) |
% du portefeuille | ΔPortefeuille % |
|---|---|---|---|---|
| 0,00 | 0,00 | -1,3833 | ||
| 0,20 | 5,14 | 2,4011 | -0,2216 | |
| 0,05 | 3,62 | 1,6904 | -0,1730 | |
| 0,05 | 3,58 | 1,6717 | -0,1550 | |
| 0,08 | 1,72 | 0,8032 | -0,1405 | |
| 0,13 | 4,21 | 1,9678 | -0,1102 | |
| 0,06 | 2,35 | 1,0983 | -0,0801 | |
| 0,05 | 2,85 | 1,3318 | -0,0520 | |
| 0,04 | 2,10 | 0,9802 | -0,0446 | |
| 0,06 | 5,64 | 2,6360 | -0,0252 |
Déclarations 13F et dépôts de fonds
Ce formulaire a été déposé le 2017-08-03 pour la période de déclaration 2017-06-30. Cliquez sur l'icône du lien pour voir l'historique complet des transactions.
Mettre à niveau pour débloquer les données premium et exporter vers Excel ![]() .
.
| Titre | Type | Prix moyen de l'action | Actions (en millions) |
ΔActions (%) |
ΔActions (%) |
Valeur ($ en millions) |
Portefeuille (%) |
ΔPortefeuille (%) |
|
|---|---|---|---|---|---|---|---|---|---|
| BRK.B / Berkshire Hathaway Inc. | 0,06 | 0,19 | 10,14 | 1,81 | 4,7331 | 0,1681 | |||
| VCSH / Vanguard Scottsdale Funds - Vanguard Short-Term Corporate Bond ETF | 0,11 | 4,44 | 9,10 | 4,83 | 4,2489 | 4,2489 | |||
| MKL / Markel Group Inc. | 0,01 | -1,88 | 8,15 | -1,88 | 3,8067 | -0,0027 | |||
| AAPL / Apple Inc. | 0,05 | -0,44 | 7,74 | -0,19 | 3,6129 | 0,0585 | |||
| CMCSA / Comcast Corporation | 0,18 | -2,46 | 6,90 | 1,00 | 3,2216 | 0,0895 | |||
| WTW / Willis Towers Watson Public Limited Company | 0,05 | -3,80 | 6,56 | 6,92 | 3,0647 | 0,2503 | |||
| VTI / Vanguard Index Funds - Vanguard Total Stock Market ETF | 0,05 | -2,87 | 6,47 | -0,37 | 3,0194 | 0,0436 | |||
| GOOG / Alphabet Inc. | 0,01 | -1,90 | 6,42 | 7,46 | 2,9998 | 0,2588 | |||
| JNJ / Johnson & Johnson | 0,05 | -0,60 | 6,09 | 5,56 | 2,8452 | 0,1986 | |||
| 61166W101 / Monsanto Co. | 0,05 | -3,29 | 5,92 | 1,13 | 2,7640 | 0,0803 | |||
| HRL / Hormel Foods Corporation | 0,17 | 52,01 | 5,72 | 49,71 | 2,6734 | 2,6734 | |||
| XOM / Exxon Mobil Corporation | 0,07 | 0,78 | 5,66 | -0,79 | 2,6411 | 0,0271 | |||
| PG / The Procter & Gamble Company | 0,06 | 0,28 | 5,64 | -2,74 | 2,6360 | -0,0252 | |||
| 74005P104 / Praxair, Inc. | 0,04 | -1,30 | 5,54 | 10,32 | 2,5856 | 2,5856 | |||
| V / Visa Inc. | 0,06 | 0,09 | 5,43 | 5,62 | 2,5347 | 2,5347 | |||
| MSFT / Microsoft Corporation | 0,08 | -0,40 | 5,31 | 4,24 | 2,4777 | 0,1439 | |||
| DISCK / Warner Bros.Discovery Inc - Series C | 0,20 | 0,95 | 5,14 | -10,10 | 2,4011 | -0,2216 | |||
| VEU / Vanguard International Equity Index Funds - Vanguard FTSE All-World ex-US ETF | 0,10 | 7,49 | 4,94 | 12,42 | 2,3077 | 0,2921 | |||
| GLD / SPDR Gold Trust | 0,04 | 0,58 | 4,89 | -0,02 | 2,2858 | 2,2858 | |||
| NVS / Novartis AG - Depositary Receipt (Common Stock) | 0,06 | -3,85 | 4,87 | 8,06 | 2,2732 | 0,2076 | |||
| DHR / Danaher Corporation | 0,06 | -0,03 | 4,85 | -1,36 | 2,2638 | 2,2638 | |||
| L / Loews Corporation | 0,10 | -0,68 | 4,77 | -0,60 | 2,2255 | 0,0270 | |||
| PDCO / Patterson Companies, Inc. | 0,10 | -0,45 | 4,72 | 3,35 | 2,2041 | 0,1100 | |||
| GE / General Electric Company | 0,17 | 8,26 | 4,58 | -1,87 | 2,1364 | -0,0012 | |||
| QCOM / QUALCOMM Incorporated | 0,08 | 2,70 | 4,47 | -1,09 | 2,0859 | 0,0153 | |||
| LMT / Lockheed Martin Corporation | 0,02 | -0,24 | 4,27 | 3,49 | 1,9953 | 0,1021 | |||
| CSCO / Cisco Systems, Inc. | 0,13 | 0,42 | 4,21 | -7,02 | 1,9678 | -0,1102 | |||
| DUK / Duke Energy Corporation | 0,05 | 0,19 | 4,02 | 2,13 | 1,8786 | 0,0725 | |||
| PFE / Pfizer Inc. | 0,12 | -0,22 | 3,97 | -2,02 | 1,8538 | -0,0041 | |||
| BSV / Vanguard Bond Index Funds - Vanguard Short-Term Bond ETF | 0,05 | 18,45 | 3,77 | 18,65 | 1,7618 | 1,7618 | |||
| CHRW / C.H. Robinson Worldwide, Inc. | 0,05 | 0,24 | 3,62 | -10,93 | 1,6904 | -0,1730 | |||
| SLB / Schlumberger Limited | 0,05 | 6,57 | 3,58 | -10,14 | 1,6717 | -0,1550 | |||
| TEVA / Teva Pharmaceutical Industries Limited - Depositary Receipt (Common Stock) | 0,09 | -0,48 | 3,10 | 3,02 | 1,4476 | 0,0679 | |||
| CNP / CenterPoint Energy, Inc. | 0,11 | -1,10 | 2,98 | -1,78 | 1,3939 | 0,0005 | |||
| TGT / Target Corporation | 0,05 | -0,27 | 2,85 | -5,50 | 1,3318 | -0,0520 | |||
| XEL / Xcel Energy Inc. | 0,06 | 0,00 | 2,35 | -8,48 | 1,0983 | -0,0801 | |||
| VNQ / Vanguard Specialized Funds - Vanguard Real Estate ETF | 0,03 | 2,32 | 2,17 | 3,14 | 1,0128 | 0,0486 | |||
| GIS / General Mills, Inc. | 0,04 | 0,01 | 2,10 | -6,09 | 0,9802 | -0,0446 | |||
| IGR / CBRE Global Real Estate Income Fund | 0,25 | 0,04 | 1,91 | 3,41 | 0,8914 | 0,0450 | |||
| MOS / The Mosaic Company | 0,08 | 6,83 | 1,72 | -16,42 | 0,8032 | -0,1405 | |||
| MMM / 3M Company | 0,01 | 0,67 | 1,66 | 9,53 | 0,7728 | 0,0800 | |||
| ICF / iShares Trust - iShares Select U.S. REIT ETF | 0,02 | -0,51 | 1,64 | 0,86 | 0,7672 | 0,0203 | |||
| AXP / American Express Company | 0,02 | 0,00 | 1,40 | 6,48 | 0,6523 | 0,0508 | |||
| TECH / Bio-Techne Corporation | 0,01 | 0,00 | 1,38 | 15,66 | 0,6449 | 0,0974 | |||
| IAU / iShares Gold Trust | 0,10 | 11,86 | 1,18 | 11,25 | 0,5496 | 0,5496 | |||
| RWX / SPDR Index Shares Funds - SPDR Dow Jones International Real Estate ETF | 0,03 | -4,79 | 1,15 | -3,05 | 0,5351 | -0,0068 | |||
| GILD / Gilead Sciences, Inc. | 0,01 | 8,58 | 0,69 | 13,09 | 0,3227 | 0,0425 | |||
| CVX / Chevron Corporation | 0,01 | 2,41 | 0,68 | -0,44 | 0,3189 | 0,0044 | |||
| BAC.PRL / Bank of America Corporation - Preferred Stock | 0,00 | 0,00 | 0,49 | 5,58 | 0,2297 | 0,0161 | |||
| AMP / Ameriprise Financial, Inc. | 0,00 | 0,00 | 0,47 | -1,87 | 0,2199 | -0,0001 | |||
| DTD / WisdomTree Trust - WisdomTree U.S. Total Dividend Fund | 0,01 | -4,27 | 0,44 | -2,86 | 0,2059 | -0,0022 | |||
| DVY / iShares Trust - iShares Select Dividend ETF | 0,00 | 0,00 | 0,39 | 1,31 | 0,1812 | 0,0056 | |||
| / Total S.A. | 0,01 | 17,11 | 0,39 | 15,22 | 0,1802 | 0,0266 | |||
| HD / The Home Depot, Inc. | 0,00 | 1,75 | 0,36 | 6,27 | 0,1662 | 0,0126 | |||
| SLV / iShares Silver Trust | 0,02 | 0,00 | 0,31 | -8,99 | 0,1466 | 0,1466 | |||
| BIV / Vanguard Bond Index Funds - Vanguard Intermediate-Term Bond ETF | 0,00 | 13,80 | 0,31 | 15,02 | 0,1466 | 0,1466 | |||
| WFC.PRL / Wells Fargo & Company - Preferred Stock | 0,00 | 0,00 | 0,30 | 5,96 | 0,1410 | 0,0103 | |||
| ABBV / AbbVie Inc. | 0,00 | 0,26 | 0,1223 | 0,1223 | |||||
| WFC / Wells Fargo & Company | 0,00 | 0,00 | 0,26 | -0,39 | 0,1205 | 0,0017 | |||
| BRK.A / Berkshire Hathaway Inc. | 0,00 | 0,00 | 0,26 | 2,00 | 0,1191 | 0,0044 | |||
| MO / Altria Group, Inc. | 0,00 | 10,99 | 0,24 | 15,71 | 0,1135 | 0,1135 | |||
| FCX / Freeport-McMoRan Inc. | 0,02 | 0,00 | 0,24 | -10,11 | 0,1121 | -0,0104 | |||
| PEP / PepsiCo, Inc. | 0,00 | 12,87 | 0,24 | 16,59 | 0,1116 | 0,0176 | |||
| ADM / Archer-Daniels-Midland Company | 0,01 | 0,00 | 0,24 | -10,19 | 0,1111 | -0,0104 | |||
| BHP / BHP Group Limited - Depositary Receipt (Common Stock) | 0,01 | 0,00 | 0,24 | -2,07 | 0,1102 | -0,0003 | |||
| JPM / JPMorgan Chase & Co. | 0,00 | 0,00 | 0,23 | 4,02 | 0,1088 | 0,1088 | |||
| DAL / Delta Air Lines, Inc. | 0,00 | 0,23 | 0,1069 | 0,1069 | |||||
| IBM / International Business Machines Corporation | 0,00 | 0,00 | 0,23 | -11,63 | 0,1065 | -0,0118 | |||
| CMI / Cummins Inc. | 0,00 | 0,00 | 0,23 | 7,08 | 0,1060 | 0,0088 | |||
| DE / Deere & Company | 0,00 | -6,42 | 0,22 | 5,88 | 0,1009 | 0,0073 | |||
| PM / Philip Morris International Inc. | 0,00 | 0,00 | 0,21 | 4,00 | 0,0971 | 0,0971 | |||
| ABT / Abbott Laboratories | 0,00 | 0,21 | 0,0971 | 0,0971 | |||||
| VZ / Verizon Communications Inc. | 0,00 | 0,00 | 0,21 | -8,41 | 0,0967 | -0,0070 | |||
| VBMFX / Vanguard Bond Index Funds - Vanguard Bond Index Fund Total Bond Market Index Fund | 0,00 | 0,20 | 0,0934 | 0,0934 | |||||
| NMS / Nuveen Minnesota Quality Municipal Income Fund | 0,01 | 0,00 | 0,18 | -4,19 | 0,0855 | 0,0855 | |||
| TROV / TrovaGene, Inc. | 0,06 | 0,00 | 0,08 | 9,72 | 0,0369 | 0,0039 | |||
| 90184LAB8 / Twitter, Inc. Bond 0.250% 9/1 | 0,05 | 0,00 | 0,05 | 0,00 | 0,0219 | 0,0219 | |||
| 092533AB4 / BlackRock Capital Investment Corporation Bond | 0,01 | 0,00 | 0,01 | 0,00 | 0,0070 | 0,0070 | |||
| 94733AAA2 / Web.com Group, Inc. Bond | 0,01 | 0,00 | 0,01 | 0,00 | 0,0070 | 0,0070 | |||
| EEM / iShares, Inc. - iShares MSCI Emerging Markets ETF | 0,00 | -100,00 | 0,00 | -100,00 | 0,0000 | ||||
| TPR / Tapestry, Inc. | 0,00 | -100,00 | 0,00 | -100,00 | -1,3833 | ||||
| WINA / Winmark Corporation | 0,00 | -100,00 | 0,00 | -100,00 | 0,0000 | ||||
| AAP / Advance Auto Parts, Inc. | 0,00 | -100,00 | 0,00 | -100,00 | 0,0000 |