Statistiques de base
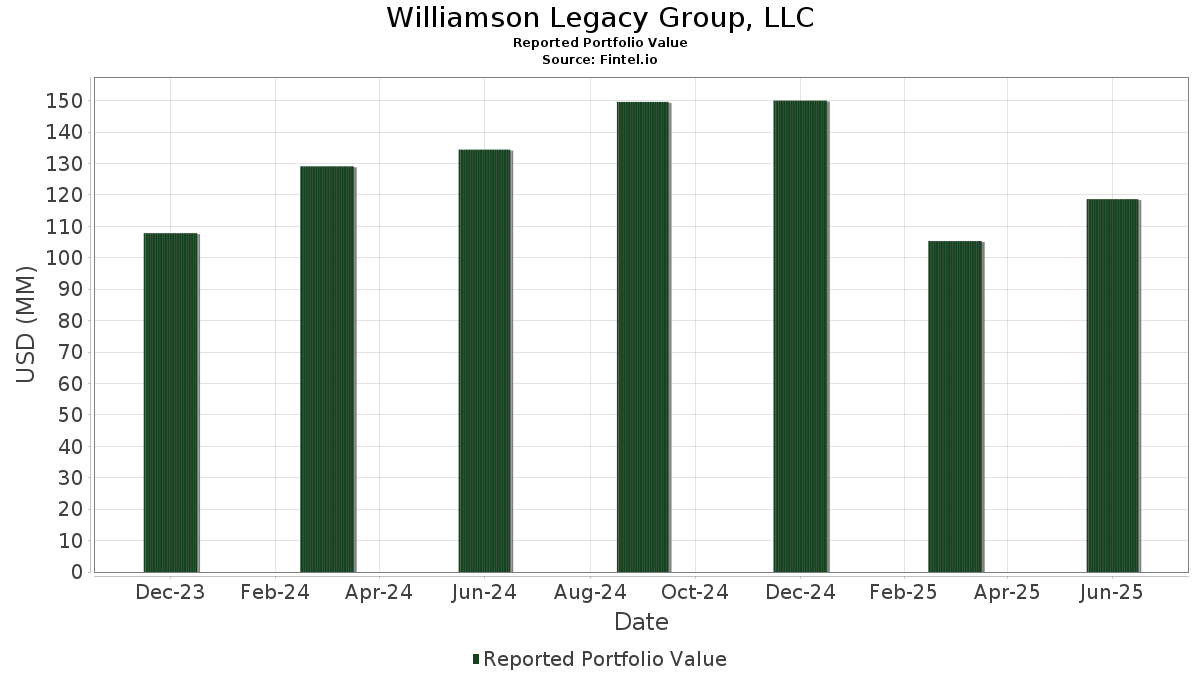
| Valeur du portefeuille | $ 118 671 499 |
| Positions actuelles | 104 |
Dernières positions, performances, ASG (à partir des dépôts 13F, 13D)
Williamson Legacy Group, LLC a déclaré un total de 104 positions dans ses derniers dépôts auprès de la SEC. La valeur la plus récente du portefeuille est calculée à 118 671 499 USD. Les actifs sous gestion réels (ASG) sont cette valeur plus les liquidités (qui ne sont pas divulguées). Les principales positions de Williamson Legacy Group, LLC sont Palantir Technologies Inc. (US:PLTR) , Spotify Technology S.A. (US:SPOT) , Robinhood Markets, Inc. (US:HOOD) , Amazon.com, Inc. (US:AMZN) , and eBay Inc. (US:EBAY) . Les nouvelles positions de Williamson Legacy Group, LLC incluent Howmet Aerospace Inc. (US:HWM) , Sportradar Group AG (US:SRAD) , DoorDash, Inc. (US:DASH) , Chewy, Inc. (US:CHWY) , and Wheaton Precious Metals Corp. (MX:WPM N) .
Meilleures augmentations ce trimestre
Nous utilisons la variation de l'allocation du portefeuille car il s'agit de l'indicateur le plus significatif. Les changements peuvent être dus à des transactions ou à des variations de prix des actions.
| Titre | Actions (en millions) |
Valeur ($ en millions) |
% du portefeuille | ΔPortefeuille % |
|---|---|---|---|---|
| 0,03 | 2,39 | 2,0159 | 1,6527 | |
| 0,01 | 1,38 | 1,1654 | 1,1654 | |
| 0,05 | 1,30 | 1,0959 | 1,0959 | |
| 0,01 | 1,26 | 1,0648 | 1,0648 | |
| 0,01 | 1,20 | 1,0134 | 1,0134 | |
| 0,03 | 1,20 | 1,0074 | 1,0074 | |
| 0,01 | 1,19 | 1,0016 | 1,0016 | |
| 0,01 | 1,17 | 0,9861 | 0,9861 | |
| 0,00 | 1,11 | 0,9347 | 0,9347 | |
| 0,02 | 1,10 | 0,9252 | 0,9252 |
Principales baisses ce trimestre
Nous utilisons la variation de l'allocation du portefeuille car il s'agit de l'indicateur le plus significatif. Les changements peuvent être dus à des transactions ou à des variations de prix des actions.
| Titre | Actions (en millions) |
Valeur ($ en millions) |
% du portefeuille | ΔPortefeuille % |
|---|---|---|---|---|
| 0,00 | 1,48 | 1,2508 | -0,9663 | |
| 0,00 | 2,22 | 1,8684 | -0,7189 | |
| 0,01 | 2,23 | 1,8792 | -0,5405 | |
| 0,01 | 1,75 | 1,4764 | -0,2926 | |
| 0,00 | 0,00 | -0,2869 | ||
| 0,00 | 1,68 | 1,4154 | -0,2495 | |
| 0,01 | 2,13 | 1,7942 | -0,1633 | |
| 0,06 | 1,52 | 1,2808 | -0,1619 | |
| 0,00 | 1,10 | 0,9236 | -0,1604 | |
| 0,00 | 0,41 | 0,3446 | -0,1575 |
Déclarations 13F et dépôts de fonds
Ce formulaire a été déposé le 2025-08-13 pour la période de déclaration 2025-06-30. Cliquez sur l'icône du lien pour voir l'historique complet des transactions.
Mettre à niveau pour débloquer les données premium et exporter vers Excel ![]() .
.
| Titre | Type | Prix moyen de l'action | Actions (en millions) |
ΔActions (%) |
ΔActions (%) |
Valeur ($ en millions) |
Portefeuille (%) |
ΔPortefeuille (%) |
|
|---|---|---|---|---|---|---|---|---|---|
| PLTR / Palantir Technologies Inc. | 0,02 | 4,15 | 2,73 | 68,23 | 2,2981 | 0,7590 | |||
| SPOT / Spotify Technology S.A. | 0,00 | 0,32 | 2,41 | 39,97 | 2,0336 | 0,3964 | |||
| HOOD / Robinhood Markets, Inc. | 0,03 | 177,99 | 2,39 | 526,18 | 2,0159 | 1,6527 | |||
| AMZN / Amazon.com, Inc. | 0,01 | 0,60 | 2,37 | 15,98 | 2,0003 | 0,0575 | |||
| EBAY / eBay Inc. | 0,03 | -0,13 | 2,27 | 9,79 | 1,9102 | -0,0502 | |||
| NRG / NRG Energy, Inc. | 0,01 | -47,98 | 2,23 | -12,48 | 1,8792 | -0,5405 | |||
| META / Meta Platforms, Inc. | 0,00 | -36,46 | 2,22 | -18,64 | 1,8684 | -0,7189 | |||
| AVGO / Broadcom Inc. | 0,01 | 2,87 | 2,22 | 69,29 | 1,8681 | 0,6252 | |||
| EAT / Brinker International, Inc. | 0,01 | 1,32 | 2,14 | 22,59 | 1,8024 | 0,1458 | |||
| RSG / Republic Services, Inc. | 0,01 | 1,41 | 2,13 | 3,30 | 1,7942 | -0,1633 | |||
| AXON / Axon Enterprise, Inc. | 0,00 | 7,68 | 2,08 | 69,49 | 1,7519 | 0,5874 | |||
| DTM / DT Midstream, Inc. | 0,02 | 7,55 | 1,99 | 22,50 | 1,6802 | 0,1351 | |||
| LNG / Cheniere Energy, Inc. | 0,01 | 1,72 | 1,94 | 7,06 | 1,6359 | -0,0859 | |||
| NVDA / NVIDIA Corporation | 0,01 | 1,78 | 1,91 | 48,37 | 1,6105 | 0,3874 | |||
| WMT / Walmart Inc. | 0,02 | 12,74 | 1,79 | 25,61 | 1,5088 | 0,1550 | |||
| TXRH / Texas Roadhouse, Inc. | 0,01 | -2,06 | 1,78 | 10,14 | 1,5016 | -0,0343 | |||
| ALL / The Allstate Corporation | 0,01 | -3,28 | 1,75 | -5,96 | 1,4764 | -0,2926 | |||
| LLY / Eli Lilly and Company | 0,00 | 1,51 | 1,68 | -4,22 | 1,4154 | -0,2495 | |||
| GE / General Electric Company | 0,01 | 0,95 | 1,64 | 29,80 | 1,3844 | 0,1829 | |||
| FTI / TechnipFMC plc | 0,05 | 1,42 | 1,61 | 10,27 | 1,3576 | -0,0301 | |||
| APP / AppLovin Corporation | 0,00 | 1,24 | 1,59 | 33,84 | 1,3434 | 0,2119 | |||
| WMB / The Williams Companies, Inc. | 0,03 | 37,85 | 1,59 | 44,86 | 1,3423 | 0,2985 | |||
| NTRA / Natera, Inc. | 0,01 | 2,54 | 1,58 | 22,45 | 1,3338 | 0,1070 | |||
| FTAI / FTAI Aviation Ltd. | 0,01 | 1,25 | 1,56 | 4,91 | 1,3142 | -0,0973 | |||
| PODD / Insulet Corporation | 0,00 | -0,49 | 1,53 | 19,05 | 1,2851 | 0,0689 | |||
| AGI / Alamos Gold Inc. | 0,06 | 0,70 | 1,52 | 0,00 | 1,2808 | -0,1619 | |||
| WELL / Welltower Inc. | 0,01 | 15,22 | 1,52 | 15,60 | 1,2806 | 0,0326 | |||
| SAP / SAP SE - Depositary Receipt (Common Stock) | 0,00 | -43,89 | 1,48 | -36,45 | 1,2508 | -0,9663 | |||
| SFM / Sprouts Farmers Market, Inc. | 0,01 | 15,69 | 1,47 | 24,74 | 1,2367 | 0,1201 | |||
| HIG / The Hartford Insurance Group, Inc. | 0,01 | 2,17 | 1,38 | 4,77 | 1,1660 | -0,0879 | |||
| HWM / Howmet Aerospace Inc. | 0,01 | 1,38 | 1,1654 | 1,1654 | |||||
| T / AT&T Inc. | 0,05 | 368,94 | 1,38 | 380,14 | 1,1619 | 0,8891 | |||
| NFLX / Netflix, Inc. | 0,00 | 0,80 | 1,35 | 44,78 | 1,1341 | 0,2514 | |||
| CM / Canadian Imperial Bank of Commerce | 0,02 | 357,25 | 1,34 | 476,29 | 1,1269 | 0,9061 | |||
| SRAD / Sportradar Group AG | 0,05 | 1,30 | 1,0959 | 1,0959 | |||||
| GWRE / Guidewire Software, Inc. | 0,01 | 1,95 | 1,29 | 28,20 | 1,0883 | 0,1312 | |||
| CASY / Casey's General Stores, Inc. | 0,00 | 4,94 | 1,28 | 23,36 | 1,0771 | 0,0935 | |||
| COST / Costco Wholesale Corporation | 0,00 | 5,42 | 1,27 | 10,43 | 1,0711 | -0,0226 | |||
| DASH / DoorDash, Inc. | 0,01 | 1,26 | 1,0648 | 1,0648 | |||||
| BSX / Boston Scientific Corporation | 0,01 | 1,06 | 1,26 | 7,67 | 1,0644 | -0,0502 | |||
| GFL / GFL Environmental Inc. | 0,02 | 2,13 | 1,25 | 6,72 | 1,0567 | -0,0594 | |||
| CYBR / CyberArk Software Ltd. | 0,00 | 7,79 | 1,22 | 29,76 | 1,0293 | 0,1355 | |||
| CTAS / Cintas Corporation | 0,01 | 5,82 | 1,21 | 14,75 | 1,0170 | 0,0185 | |||
| BWXT / BWX Technologies, Inc. | 0,01 | 1,20 | 1,0134 | 1,0134 | |||||
| NI / NiSource Inc. | 0,03 | 138,73 | 1,20 | 140,08 | 1,0103 | 0,5364 | |||
| CHWY / Chewy, Inc. | 0,03 | 1,20 | 1,0074 | 1,0074 | |||||
| AEM / Agnico Eagle Mines Limited | 0,01 | 2,13 | 1,19 | 12,04 | 1,0042 | -0,0056 | |||
| WPM N / Wheaton Precious Metals Corp. | 0,01 | 1,19 | 1,0016 | 1,0016 | |||||
| EHC / Encompass Health Corporation | 0,01 | 1,17 | 0,9861 | 0,9861 | |||||
| WRB / W. R. Berkley Corporation | 0,02 | 2,60 | 1,16 | 6,01 | 0,9809 | -0,0624 | |||
| TJX / The TJX Companies, Inc. | 0,01 | 126,08 | 1,15 | 129,14 | 0,9679 | 0,4921 | |||
| GDDY / GoDaddy Inc. | 0,01 | 0,75 | 1,11 | 0,72 | 0,9388 | -0,1115 | |||
| MSTR / Strategy Inc | 0,00 | 1,11 | 0,9347 | 0,9347 | |||||
| MO / Altria Group, Inc. | 0,02 | 1,10 | 0,9252 | 0,9252 | |||||
| PGR / The Progressive Corporation | 0,00 | 1,81 | 1,10 | -4,03 | 0,9236 | -0,1604 | |||
| CCEP N / Coca-Cola Europacific Partners PLC | 0,01 | 1,07 | 0,9049 | 0,9049 | |||||
| MPLX / MPLX LP - Limited Partnership | 0,02 | 28,06 | 1,06 | 23,22 | 0,8903 | 0,0765 | |||
| IBM / International Business Machines Corporation | 0,00 | 1,05 | 0,8868 | 0,8868 | |||||
| MFC / Manulife Financial Corporation | 0,03 | 130,61 | 1,04 | 136,67 | 0,8759 | 0,4588 | |||
| TW / Tradeweb Markets Inc. | 0,01 | 1,00 | 0,8422 | 0,8422 | |||||
| TRV / The Travelers Companies, Inc. | 0,00 | 0,98 | 0,8294 | 0,8294 | |||||
| AJG / Arthur J. Gallagher & Co. | 0,00 | 9,30 | 0,96 | 1,38 | 0,8052 | -0,0900 | |||
| SLM / SLM Corporation | 0,03 | 0,95 | 0,7980 | 0,7980 | |||||
| MWA / Mueller Water Products, Inc. | 0,04 | -0,25 | 0,94 | -5,69 | 0,7963 | -0,1548 | |||
| XEL / Xcel Energy Inc. | 0,01 | 0,94 | 0,7923 | 0,7923 | |||||
| SSNC / SS&C Technologies Holdings, Inc. | 0,01 | -2,81 | 0,94 | -3,60 | 0,7896 | -0,1338 | |||
| UNM / Unum Group | 0,01 | 0,93 | 0,7845 | 0,7845 | |||||
| CVNA / Carvana Co. | 0,00 | 0,92 | 0,7760 | 0,7760 | |||||
| BRO / Brown & Brown, Inc. | 0,01 | 0,92 | 0,7751 | 0,7751 | |||||
| FOXA / Fox Corporation | 0,02 | -1,12 | 0,89 | -2,08 | 0,7531 | -0,1136 | |||
| BJ / BJ's Wholesale Club Holdings, Inc. | 0,01 | 0,89 | 0,7485 | 0,7485 | |||||
| ATO / Atmos Energy Corporation | 0,01 | 183,38 | 0,87 | 182,41 | 0,7309 | 0,4394 | |||
| PNW / Pinnacle West Capital Corporation | 0,01 | 0,85 | 0,7201 | 0,7201 | |||||
| AROC / Archrock, Inc. | 0,03 | 0,23 | 0,85 | -5,16 | 0,7128 | -0,1340 | |||
| TRI N / Thomson Reuters Corporation | 0,00 | 0,80 | 0,6720 | 0,6720 | |||||
| MSI / Motorola Solutions, Inc. | 0,00 | -5,16 | 0,77 | -8,96 | 0,6512 | -0,1544 | |||
| BAP / Credicorp Ltd. | 0,00 | 0,75 | 0,6344 | 0,6344 | |||||
| BK / The Bank of New York Mellon Corporation | 0,01 | 122,29 | 0,69 | 141,81 | 0,5849 | 0,3120 | |||
| ULS / UL Solutions Inc. | 0,01 | 0,65 | 0,5473 | 0,5473 | |||||
| RACE / Ferrari N.V. | 0,00 | -0,15 | 0,64 | 14,41 | 0,5426 | 0,0088 | |||
| RBLX / Roblox Corporation | 0,01 | 0,63 | 0,5270 | 0,5270 | |||||
| CAH / Cardinal Health, Inc. | 0,00 | 0,61 | 0,5111 | 0,5111 | |||||
| AFL / Aflac Incorporated | 0,01 | 21,13 | 0,61 | 15,02 | 0,5099 | 0,0099 | |||
| TTWO / Take-Two Interactive Software, Inc. | 0,00 | 0,56 | 0,4701 | 0,4701 | |||||
| GEV / GE Vernova Inc. | 0,00 | 0,55 | 0,4624 | 0,4624 | |||||
| PG / The Procter & Gamble Company | 0,00 | -1,32 | 0,55 | -7,61 | 0,4601 | -0,1018 | |||
| RTX / RTX Corporation | 0,00 | 13,94 | 0,54 | 25,52 | 0,4565 | 0,0470 | |||
| MSFT / Microsoft Corporation | 0,00 | -4,93 | 0,48 | 25,98 | 0,4045 | 0,0427 | |||
| ABBV / AbbVie Inc. | 0,00 | -12,72 | 0,41 | -22,73 | 0,3446 | -0,1575 | |||
| TRP N / TC Energy Corporation | 0,01 | 0,40 | 0,3354 | 0,3354 | |||||
| PM / Philip Morris International Inc. | 0,00 | 0,35 | 0,2951 | 0,2951 | |||||
| USFD / US Foods Holding Corp. | 0,00 | 0,35 | 0,2907 | 0,2907 | |||||
| COF / Capital One Financial Corporation | 0,00 | 0,32 | 0,2725 | 0,2725 | |||||
| APH / Amphenol Corporation | 0,00 | 0,32 | 0,2661 | 0,2661 | |||||
| SRE / Sempra | 0,00 | -1,66 | 0,28 | 4,43 | 0,2387 | -0,0189 | |||
| VUG / Vanguard Index Funds - Vanguard Growth ETF | 0,00 | -3,48 | 0,28 | 14,34 | 0,2353 | 0,0030 | |||
| TKO / TKO Group Holdings, Inc. | 0,00 | 0,27 | 0,2275 | 0,2275 | |||||
| ICE / Intercontinental Exchange, Inc. | 0,00 | 0,27 | 0,2264 | 0,2264 | |||||
| FTNT / Fortinet, Inc. | 0,00 | 0,26 | 0,2178 | 0,2178 | |||||
| WAB / Westinghouse Air Brake Technologies Corporation | 0,00 | 0,23 | 0,1964 | 0,1964 | |||||
| RSPT / Invesco Exchange-Traded Fund Trust - Invesco S&P 500 Equal Weight Technology ETF | 0,01 | -4,34 | 0,23 | 13,79 | 0,1953 | 0,0024 | |||
| VTI / Vanguard Index Funds - Vanguard Total Stock Market ETF | 0,00 | 0,00 | 0,23 | 10,68 | 0,1926 | -0,0036 | |||
| TWLO / Twilio Inc. | 0,00 | 0,21 | 0,1769 | 0,1769 | |||||
| VEA / Vanguard Tax-Managed Funds - Vanguard FTSE Developed Markets ETF | 0,00 | -33,72 | 0,20 | -25,56 | 0,1695 | -0,0874 | |||
| SPGI / S&P Global Inc. | 0,00 | -100,00 | 0,00 | 0,0000 | |||||
| AIT / Applied Industrial Technologies, Inc. | 0,00 | -100,00 | 0,00 | 0,0000 | |||||
| FLEX / Flex Ltd. | 0,00 | -100,00 | 0,00 | 0,0000 | |||||
| MET / MetLife, Inc. | 0,00 | -100,00 | 0,00 | 0,0000 | |||||
| AER / AerCap Holdings N.V. | 0,00 | -100,00 | 0,00 | 0,0000 | |||||
| NEE / NextEra Energy, Inc. | 0,00 | -100,00 | 0,00 | 0,0000 | |||||
| BLK / BlackRock, Inc. | 0,00 | -100,00 | 0,00 | 0,0000 | |||||
| GRMN / Garmin Ltd. | 0,00 | -100,00 | 0,00 | 0,0000 | |||||
| APO / Apollo Global Management, Inc. | 0,00 | -100,00 | 0,00 | 0,0000 | |||||
| CRBG / Corebridge Financial, Inc. | 0,00 | -100,00 | 0,00 | 0,0000 | |||||
| ALSN / Allison Transmission Holdings, Inc. | 0,00 | -100,00 | 0,00 | 0,0000 | |||||
| TRU / TransUnion | 0,00 | -100,00 | 0,00 | 0,0000 | |||||
| CW / Curtiss-Wright Corporation | 0,00 | -100,00 | 0,00 | 0,0000 | |||||
| FI / Fiserv, Inc. | 0,00 | -100,00 | 0,00 | 0,0000 | |||||
| JPM / JPMorgan Chase & Co. | 0,00 | -100,00 | 0,00 | 0,0000 | |||||
| TRGP / Targa Resources Corp. | 0,00 | -100,00 | 0,00 | 0,0000 | |||||
| ISRG / Intuitive Surgical, Inc. | 0,00 | -100,00 | 0,00 | 0,0000 | |||||
| VMI / Valmont Industries, Inc. | 0,00 | -100,00 | 0,00 | 0,0000 | |||||
| OKE / ONEOK, Inc. | 0,00 | -100,00 | 0,00 | 0,0000 | |||||
| SN / SharkNinja, Inc. | 0,00 | -100,00 | 0,00 | 0,0000 | |||||
| UPS / United Parcel Service, Inc. | 0,00 | -100,00 | 0,00 | 0,0000 | |||||
| JXN / Jackson Financial Inc. | 0,00 | -100,00 | 0,00 | 0,0000 | |||||
| PEG / Public Service Enterprise Group Incorporated | 0,00 | -100,00 | 0,00 | 0,0000 | |||||
| GLW / Corning Incorporated | 0,00 | -100,00 | 0,00 | 0,0000 | |||||
| IBKR / Interactive Brokers Group, Inc. | 0,00 | -100,00 | 0,00 | 0,0000 | |||||
| CMI / Cummins Inc. | 0,00 | -100,00 | 0,00 | 0,0000 | |||||
| FLS / Flowserve Corporation | 0,00 | -100,00 | 0,00 | 0,0000 | |||||
| WTW / Willis Towers Watson Public Limited Company | 0,00 | -100,00 | 0,00 | 0,0000 | |||||
| HLI / Houlihan Lokey, Inc. | 0,00 | -100,00 | 0,00 | 0,0000 | |||||
| AAPL / Apple Inc. | 0,00 | -100,00 | 0,00 | 0,0000 | |||||
| MMSI / Merit Medical Systems, Inc. | 0,00 | -100,00 | 0,00 | 0,0000 | |||||
| TYL / Tyler Technologies, Inc. | 0,00 | -100,00 | 0,00 | 0,0000 | |||||
| FN / Fabrinet | 0,00 | -100,00 | 0,00 | -100,00 | -0,2869 | ||||
| SHW / The Sherwin-Williams Company | 0,00 | -100,00 | 0,00 | 0,0000 | |||||
| BPOP / Popular, Inc. | 0,00 | -100,00 | 0,00 | 0,0000 |