Statistiques de base
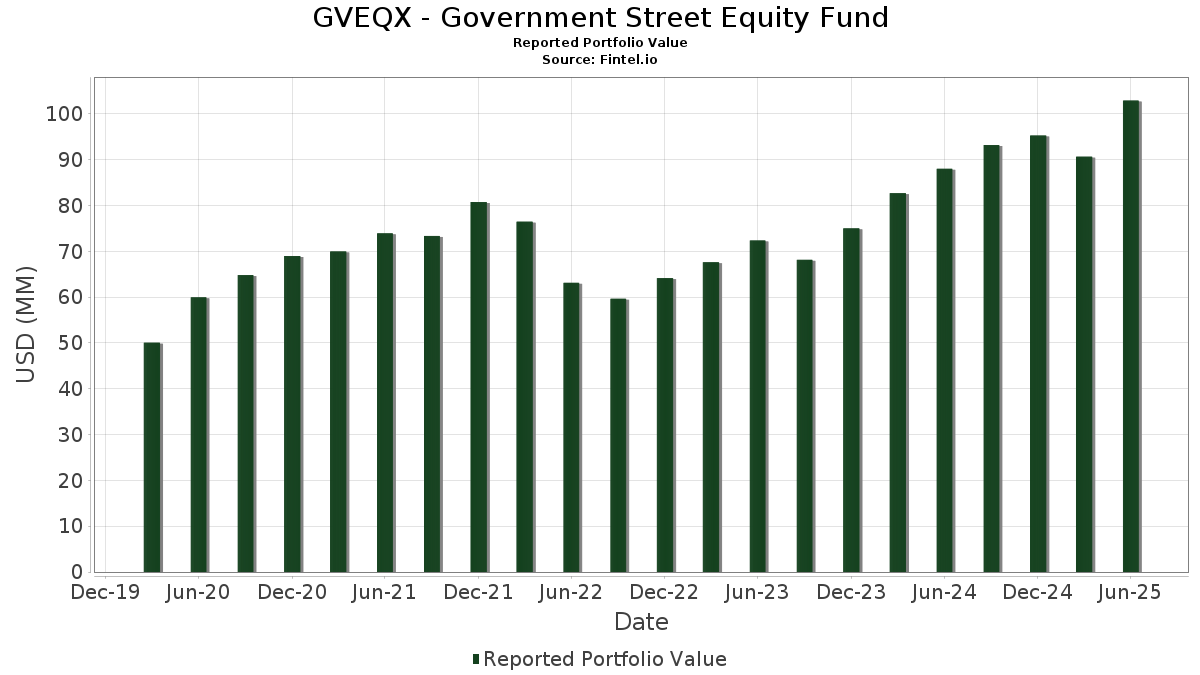
| Valeur du portefeuille | $ 102 923 007 |
| Positions actuelles | 81 |
Dernières positions, performances, ASG (à partir des dépôts 13F, 13D)
GVEQX - Government Street Equity Fund a déclaré un total de 81 positions dans ses derniers dépôts auprès de la SEC. La valeur la plus récente du portefeuille est calculée à 102 923 007 USD. Les actifs sous gestion réels (ASG) sont cette valeur plus les liquidités (qui ne sont pas divulguées). Les principales positions de GVEQX - Government Street Equity Fund sont NVIDIA Corporation (US:NVDA) , JPMorgan Chase & Co. (US:JPM) , Fidelity Colchester Street Trust - Fidelity Institutional Money Market Funds Government Portfolio Class I (US:FIGXX) , Microsoft Corporation (US:MSFT) , and Walmart Inc. (US:WMT) . Les nouvelles positions de GVEQX - Government Street Equity Fund incluent Fidelity Colchester Street Trust - Fidelity Institutional Money Market Funds Government Portfolio Class I (US:FIGXX) , Listed Funds Trust - Roundhill Ball Metaverse ETF (US:METV) , Listed Funds Trust - Horizon Kinetics Inflation Beneficiaries ETF (US:INFL) , The Bank of New York Mellon Corporation (US:BK) , and Broadcom Inc. (US:AVGO) .
Meilleures augmentations ce trimestre
Nous utilisons la variation de l'allocation du portefeuille car il s'agit de l'indicateur le plus significatif. Les changements peuvent être dus à des transactions ou à des variations de prix des actions.
| Titre | Actions (en millions) |
Valeur ($ en millions) |
% du portefeuille | ΔPortefeuille % |
|---|---|---|---|---|
| 0,10 | 16,19 | 15,9587 | 3,6878 | |
| 0,13 | 2,21 | 2,1817 | 2,1817 | |
| 0,03 | 1,05 | 1,0389 | 1,0389 | |
| 0,01 | 4,23 | 4,1666 | 0,6420 | |
| 0,00 | 1,03 | 1,0146 | 0,3956 | |
| 0,00 | 1,51 | 1,4903 | 0,3673 | |
| 0,00 | 0,36 | 0,3591 | 0,3591 | |
| 0,00 | 0,68 | 0,6679 | 0,3590 | |
| 0,00 | 2,36 | 2,3276 | 0,2903 | |
| 0,02 | 5,65 | 5,5711 | 0,2874 |
Principales baisses ce trimestre
Nous utilisons la variation de l'allocation du portefeuille car il s'agit de l'indicateur le plus significatif. Les changements peuvent être dus à des transactions ou à des variations de prix des actions.
| Titre | Actions (en millions) |
Valeur ($ en millions) |
% du portefeuille | ΔPortefeuille % |
|---|---|---|---|---|
| 0,01 | 2,18 | 2,1492 | -1,9457 | |
| 4,41 | 4,3482 | -1,4785 | ||
| 0,01 | 2,13 | 2,1036 | -0,5579 | |
| 0,00 | 0,20 | 0,1951 | -0,5080 | |
| 0,01 | 2,40 | 2,3656 | -0,5051 | |
| 0,01 | 1,50 | 1,4741 | -0,4559 | |
| 0,01 | 1,33 | 1,3127 | -0,3532 | |
| 0,00 | 1,16 | 1,1410 | -0,3393 | |
| 0,02 | 1,08 | 1,0648 | -0,2953 | |
| 0,01 | 1,46 | 1,4396 | -0,2856 |
Déclarations 13F et dépôts de fonds
Ce formulaire a été déposé le 2025-08-18 pour la période de déclaration 2025-06-30. Cliquez sur l'icône du lien pour voir l'historique complet des transactions.
Mettre à niveau pour débloquer les données premium et exporter vers Excel ![]() .
.
| Titre | Type | Prix moyen de l'action | Actions (en millions) |
ΔActions (%) |
ΔActions (%) |
Valeur ($ en millions) |
Portefeuille (%) |
ΔPortefeuille (%) |
|
|---|---|---|---|---|---|---|---|---|---|
| NVDA / NVIDIA Corporation | 0,10 | 0,00 | 16,19 | 45,78 | 15,9587 | 3,6878 | |||
| JPM / JPMorgan Chase & Co. | 0,02 | 0,00 | 5,65 | 18,19 | 5,5711 | 0,2874 | |||
| FIGXX / Fidelity Colchester Street Trust - Fidelity Institutional Money Market Funds Government Portfolio Class I | 4,41 | -16,34 | 4,3482 | -1,4785 | |||||
| MSFT / Microsoft Corporation | 0,01 | 0,00 | 4,23 | 32,51 | 4,1666 | 0,6420 | |||
| WMT / Walmart Inc. | 0,03 | 0,00 | 2,69 | 11,35 | 2,6499 | -0,0169 | |||
| AMZN / Amazon.com, Inc. | 0,01 | 1,69 | 2,63 | 17,24 | 2,5944 | 0,1145 | |||
| AAPL / Apple Inc. | 0,01 | 0,00 | 2,40 | -7,62 | 2,3656 | -0,5051 | |||
| GOOG / Alphabet Inc. | 0,01 | 0,00 | 2,37 | 13,53 | 2,3320 | 0,0299 | |||
| META / Meta Platforms, Inc. | 0,00 | 0,00 | 2,36 | 28,04 | 2,3276 | 0,2903 | |||
| METV / Listed Funds Trust - Roundhill Ball Metaverse ETF | 0,13 | 2,21 | 2,1817 | 2,1817 | |||||
| RSP / Invesco Exchange-Traded Fund Trust - Invesco S&P 500 Equal Weight ETF | 0,01 | -43,93 | 2,18 | -41,19 | 2,1492 | -1,9457 | |||
| ABBV / AbbVie Inc. | 0,01 | 0,00 | 2,13 | -11,42 | 2,1036 | -0,5579 | |||
| RTX / RTX Corporation | 0,01 | 0,00 | 2,04 | 10,25 | 2,0146 | -0,0338 | |||
| V / Visa Inc. | 0,01 | 0,00 | 1,78 | 1,31 | 1,7495 | -0,1861 | |||
| BN / Brookfield Corporation | 0,03 | 0,00 | 1,67 | 17,95 | 1,6457 | 0,0826 | |||
| TEL / TE Connectivity plc | 0,01 | 0,00 | 1,52 | 19,43 | 1,4960 | 0,0911 | |||
| PWR / Quanta Services, Inc. | 0,00 | 0,00 | 1,51 | 48,82 | 1,4903 | 0,3673 | |||
| BX / Blackstone Inc. | 0,01 | -20,00 | 1,50 | -14,42 | 1,4741 | -0,4559 | |||
| AFL / Aflac Incorporated | 0,01 | 0,00 | 1,48 | -5,14 | 1,4550 | -0,2645 | |||
| MCD / McDonald's Corporation | 0,01 | 0,00 | 1,46 | -6,47 | 1,4396 | -0,2856 | |||
| BKNG / Booking Holdings Inc. | 0,00 | 0,00 | 1,45 | 25,72 | 1,4263 | 0,1541 | |||
| HON / Honeywell International Inc. | 0,01 | 0,00 | 1,40 | 10,00 | 1,3770 | -0,0264 | |||
| MAA / Mid-America Apartment Communities, Inc. | 0,01 | 0,00 | 1,33 | -11,67 | 1,3127 | -0,3532 | |||
| ABT / Abbott Laboratories | 0,01 | 0,00 | 1,29 | 2,54 | 1,2733 | -0,1187 | |||
| LMT / Lockheed Martin Corporation | 0,00 | -16,67 | 1,16 | -13,66 | 1,1410 | -0,3393 | |||
| WEC / WEC Energy Group, Inc. | 0,01 | 0,00 | 1,15 | -4,34 | 1,1295 | -0,1946 | |||
| MA / Mastercard Incorporated | 0,00 | 0,00 | 1,12 | 2,46 | 1,1076 | -0,1034 | |||
| HD / The Home Depot, Inc. | 0,00 | 0,00 | 1,10 | 0,00 | 1,0839 | -0,1305 | |||
| FCX / Freeport-McMoRan Inc. | 0,03 | 0,00 | 1,08 | 14,48 | 1,0680 | 0,0225 | |||
| TECH / Bio-Techne Corporation | 0,02 | 0,00 | 1,08 | -12,27 | 1,0648 | -0,2953 | |||
| TXN / Texas Instruments Incorporated | 0,01 | 0,00 | 1,08 | 15,52 | 1,0639 | 0,0318 | |||
| GD / General Dynamics Corporation | 0,00 | 0,00 | 1,08 | 7,04 | 1,0635 | -0,0506 | |||
| INFL / Listed Funds Trust - Horizon Kinetics Inflation Beneficiaries ETF | 0,03 | 1,05 | 1,0389 | 1,0389 | |||||
| ACN / Accenture plc | 0,00 | 0,00 | 1,05 | -4,21 | 1,0309 | -0,1755 | |||
| GE / General Electric Company | 0,00 | 42,86 | 1,03 | 83,75 | 1,0146 | 0,3956 | |||
| GOOGL / Alphabet Inc. | 0,01 | 0,00 | 1,00 | 13,96 | 0,9899 | 0,0163 | |||
| LNG / Cheniere Energy, Inc. | 0,00 | 0,00 | 0,97 | 5,30 | 0,9599 | -0,0625 | |||
| CME / CME Group Inc. | 0,00 | 0,00 | 0,96 | 3,88 | 0,9507 | -0,0750 | |||
| ARES / Ares Management Corporation | 0,01 | 0,00 | 0,95 | 18,11 | 0,9388 | 0,0481 | |||
| PH / Parker-Hannifin Corporation | 0,00 | 0,00 | 0,91 | 14,94 | 0,8948 | 0,0220 | |||
| ASML / ASML Holding N.V. - Depositary Receipt (Common Stock) | 0,00 | 17,65 | 0,80 | 42,27 | 0,7897 | 0,1676 | |||
| BRK.B / Berkshire Hathaway Inc. | 0,00 | 0,00 | 0,78 | -8,80 | 0,7659 | -0,1753 | |||
| PSX / Phillips 66 | 0,01 | 0,00 | 0,76 | -3,42 | 0,7524 | -0,1205 | |||
| OKE / ONEOK, Inc. | 0,01 | 0,00 | 0,76 | -17,67 | 0,7441 | -0,2697 | |||
| ETN / Eaton Corporation plc | 0,00 | 0,00 | 0,75 | 31,40 | 0,7388 | 0,1082 | |||
| PLTR / Palantir Technologies Inc. | 0,01 | 0,00 | 0,68 | 61,37 | 0,6717 | 0,2056 | |||
| ORCL / Oracle Corporation | 0,00 | 55,00 | 0,68 | 142,65 | 0,6679 | 0,3590 | |||
| PG / The Procter & Gamble Company | 0,00 | 0,00 | 0,64 | -6,46 | 0,6280 | -0,1250 | |||
| LLY / Eli Lilly and Company | 0,00 | 33,33 | 0,62 | 25,86 | 0,6146 | 0,0672 | |||
| VRTX / Vertex Pharmaceuticals Incorporated | 0,00 | 0,00 | 0,62 | -8,11 | 0,6142 | -0,1355 | |||
| IBM / International Business Machines Corporation | 0,00 | 0,00 | 0,62 | 18,58 | 0,6100 | 0,0332 | |||
| EMR / Emerson Electric Co. | 0,00 | 0,00 | 0,60 | 21,50 | 0,5913 | 0,0463 | |||
| KMI / Kinder Morgan, Inc. | 0,02 | 0,00 | 0,59 | 3,16 | 0,5795 | -0,0508 | |||
| LOW / Lowe's Companies, Inc. | 0,00 | 0,00 | 0,55 | -4,97 | 0,5466 | -0,0974 | |||
| MMC / Marsh & McLennan Companies, Inc. | 0,00 | 0,00 | 0,55 | -10,49 | 0,5387 | -0,1352 | |||
| TSLA / Tesla, Inc. | 0,00 | 0,00 | 0,54 | 22,73 | 0,5322 | 0,0455 | |||
| GS / The Goldman Sachs Group, Inc. | 0,00 | 16,67 | 0,50 | 51,38 | 0,4882 | 0,1262 | |||
| GEHC / GE HealthCare Technologies Inc. | 0,01 | 0,00 | 0,48 | -8,21 | 0,4745 | -0,1050 | |||
| QCOM / QUALCOMM Incorporated | 0,00 | 0,00 | 0,48 | 3,70 | 0,4708 | -0,0382 | |||
| LIN / Linde plc | 0,00 | 25,00 | 0,47 | 26,08 | 0,4624 | 0,0509 | |||
| CEG / Constellation Energy Corporation | 0,00 | 16,67 | 0,45 | 87,14 | 0,4453 | 0,1780 | |||
| UBER / Uber Technologies, Inc. | 0,00 | 0,00 | 0,37 | 28,18 | 0,3678 | 0,0459 | |||
| TMO / Thermo Fisher Scientific Inc. | 0,00 | 0,00 | 0,36 | -18,57 | 0,3596 | -0,1351 | |||
| BK / The Bank of New York Mellon Corporation | 0,00 | 0,36 | 0,3591 | 0,3591 | |||||
| ARM / Arm Holdings plc - Depositary Receipt (Common Stock) | 0,00 | 0,00 | 0,36 | 51,71 | 0,3507 | 0,0911 | |||
| PANW / Palo Alto Networks, Inc. | 0,00 | 25,00 | 0,31 | 50,00 | 0,3025 | 0,0763 | |||
| DLR / Digital Realty Trust, Inc. | 0,00 | 0,00 | 0,31 | 22,00 | 0,3006 | 0,0237 | |||
| CCJ / Cameco Corporation | 0,00 | 0,00 | 0,30 | 80,49 | 0,2926 | 0,1107 | |||
| NVR / NVR, Inc. | 0,00 | 0,00 | 0,30 | 2,08 | 0,2911 | -0,0290 | |||
| APO / Apollo Global Management, Inc. | 0,00 | 100,00 | 0,28 | 108,09 | 0,2796 | 0,1284 | |||
| AVGO / Broadcom Inc. | 0,00 | 0,28 | 0,2716 | 0,2716 | |||||
| ICE / Intercontinental Exchange, Inc. | 0,00 | 0,00 | 0,28 | 6,59 | 0,2712 | -0,0146 | |||
| ACGL / Arch Capital Group Ltd. | 0,00 | 0,00 | 0,27 | -5,21 | 0,2692 | -0,0495 | |||
| TSCO / Tractor Supply Company | 0,01 | 0,00 | 0,26 | -4,36 | 0,2600 | -0,0443 | |||
| KO / The Coca-Cola Company | 0,00 | 0,00 | 0,25 | -1,20 | 0,2440 | -0,0329 | |||
| CPNG / Coupang, Inc. | 0,01 | 60,00 | 0,24 | 119,27 | 0,2362 | 0,1151 | |||
| COST / Costco Wholesale Corporation | 0,00 | -80,00 | 0,20 | -65,26 | 0,1951 | -0,5080 | |||
| CRSP / CRISPR Therapeutics AG | 0,00 | 60,00 | 0,19 | 128,24 | 0,1917 | 0,0978 | |||
| AVAV / AeroVironment, Inc. | 0,00 | 0,17 | 0,1685 | 0,1685 | |||||
| NUE / Nucor Corporation | 0,00 | 0,00 | 0,13 | 7,50 | 0,1277 | -0,0053 | |||
| SHW / The Sherwin-Williams Company | 0,00 | 0,00 | 0,12 | -1,64 | 0,1184 | -0,0166 |