Statistiques de base
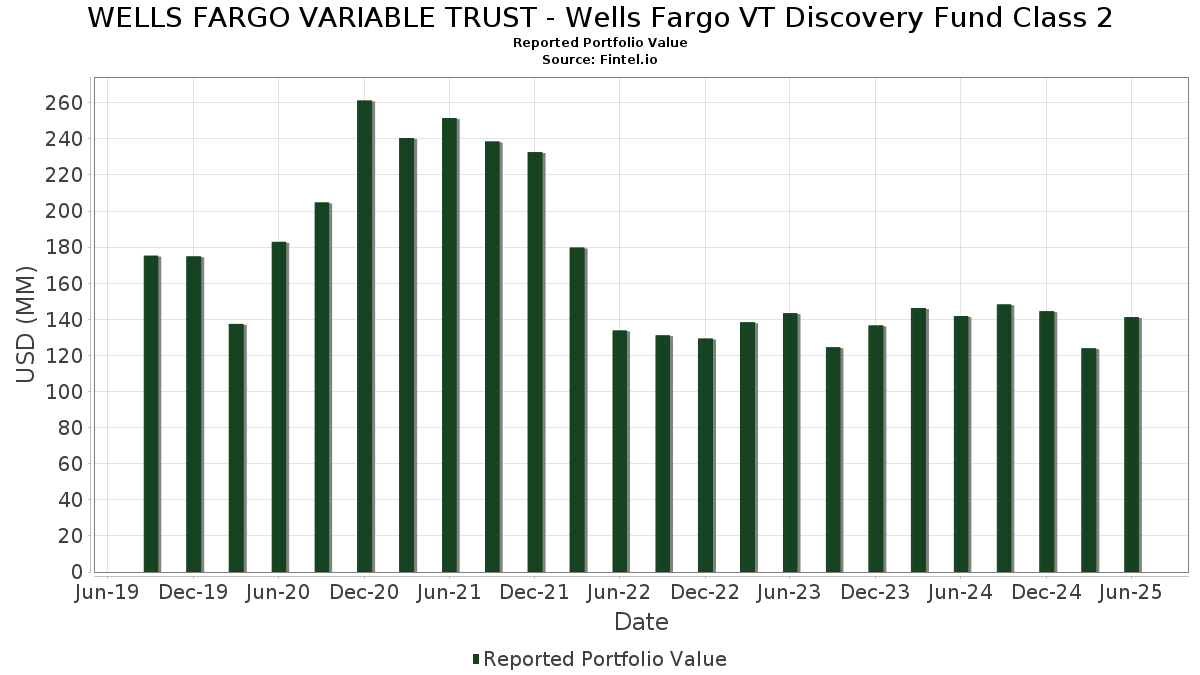
| Valeur du portefeuille | $ 141 252 408 |
| Positions actuelles | 71 |
Dernières positions, performances, ASG (à partir des dépôts 13F, 13D)
WELLS FARGO VARIABLE TRUST - Wells Fargo VT Discovery Fund Class 2 a déclaré un total de 71 positions dans ses derniers dépôts auprès de la SEC. La valeur la plus récente du portefeuille est calculée à 141 252 408 USD. Les actifs sous gestion réels (ASG) sont cette valeur plus les liquidités (qui ne sont pas divulguées). Les principales positions de WELLS FARGO VARIABLE TRUST - Wells Fargo VT Discovery Fund Class 2 sont Carpenter Technology Corporation (US:CRS) , Construction Partners, Inc. (US:ROAD) , Casella Waste Systems, Inc. (US:CWST) , Equitable Holdings, Inc. (US:EQH) , and Curtiss-Wright Corporation (US:CW) . Les nouvelles positions de WELLS FARGO VARIABLE TRUST - Wells Fargo VT Discovery Fund Class 2 incluent Varonis Systems, Inc. (US:VRNS) , Celestica Inc. (US:CLS) , Affirm Holdings, Inc. (US:AFRM) , Ryan Specialty Holdings, Inc. (US:RYAN) , and Vericel Corporation (US:VCEL) .
Meilleures augmentations ce trimestre
Nous utilisons la variation de l'allocation du portefeuille car il s'agit de l'indicateur le plus significatif. Les changements peuvent être dus à des transactions ou à des variations de prix des actions.
| Titre | Actions (en millions) |
Valeur ($ en millions) |
% du portefeuille | ΔPortefeuille % |
|---|---|---|---|---|
| 2,14 | 2,14 | 1,5164 | 1,5164 | |
| 0,04 | 2,11 | 1,4935 | 1,4935 | |
| 0,01 | 2,10 | 1,4884 | 1,4884 | |
| 0,03 | 2,04 | 1,4460 | 1,4460 | |
| 0,03 | 1,74 | 1,2347 | 1,2347 | |
| 0,03 | 1,40 | 0,9950 | 0,9950 | |
| 0,01 | 1,33 | 0,9437 | 0,9437 | |
| 0,01 | 2,51 | 1,7798 | 0,8858 | |
| 0,01 | 3,25 | 2,3007 | 0,8120 | |
| 0,01 | 2,79 | 1,9807 | 0,6894 |
Principales baisses ce trimestre
Nous utilisons la variation de l'allocation du portefeuille car il s'agit de l'indicateur le plus significatif. Les changements peuvent être dus à des transactions ou à des variations de prix des actions.
| Titre | Actions (en millions) |
Valeur ($ en millions) |
% du portefeuille | ΔPortefeuille % |
|---|---|---|---|---|
| 0,01 | 1,68 | 1,1919 | -1,1800 | |
| 0,00 | 0,00 | -1,0957 | ||
| 0,01 | 1,74 | 1,2328 | -0,5910 | |
| 0,01 | 1,59 | 1,1258 | -0,5315 | |
| 0,00 | 0,00 | -0,3921 | ||
| 0,02 | 2,02 | 1,4284 | -0,3787 | |
| 0,00 | 1,31 | 0,9315 | -0,3587 | |
| 0,01 | 2,33 | 1,6535 | -0,3453 | |
| 0,01 | 1,04 | 0,7339 | -0,3222 | |
| 0,03 | 3,45 | 2,4474 | -0,2967 |
Déclarations 13F et dépôts de fonds
Ce formulaire a été déposé le 2025-08-26 pour la période de déclaration 2025-06-30. Cliquez sur l'icône du lien pour voir l'historique complet des transactions.
Mettre à niveau pour débloquer les données premium et exporter vers Excel ![]() .
.
| Titre | Type | Prix moyen de l'action | Actions (en millions) |
ΔActions (%) |
ΔActions (%) |
Valeur ($ en millions) |
Portefeuille (%) |
ΔPortefeuille (%) |
|
|---|---|---|---|---|---|---|---|---|---|
| CRS / Carpenter Technology Corporation | 0,01 | -11,65 | 3,52 | 34,80 | 2,4953 | 0,3862 | |||
| ROAD / Construction Partners, Inc. | 0,03 | -1,32 | 3,48 | 45,97 | 2,4643 | 0,5407 | |||
| CWST / Casella Waste Systems, Inc. | 0,03 | -1,81 | 3,45 | 1,59 | 2,4474 | -0,2967 | |||
| EQH / Equitable Holdings, Inc. | 0,06 | -1,81 | 3,26 | 5,74 | 2,3094 | -0,1783 | |||
| CW / Curtiss-Wright Corporation | 0,01 | 14,33 | 3,25 | 76,13 | 2,3007 | 0,8120 | |||
| EME / EMCOR Group, Inc. | 0,01 | 11,56 | 2,94 | 61,46 | 2,0814 | 0,6127 | |||
| IRTC / iRhythm Technologies, Inc. | 0,02 | -8,18 | 2,86 | 35,07 | 2,0260 | 0,3170 | |||
| WING / Wingstop Inc. | 0,01 | 17,05 | 2,79 | 74,73 | 1,9807 | 0,6894 | |||
| HQY / HealthEquity, Inc. | 0,03 | -1,76 | 2,70 | 16,46 | 1,9160 | 0,0418 | |||
| TKO / TKO Group Holdings, Inc. | 0,01 | -1,18 | 2,70 | 17,66 | 1,9122 | 0,0609 | |||
| LLYVK / Liberty Live Group | 0,03 | -1,31 | 2,60 | 17,59 | 1,8434 | 0,0569 | |||
| RBC / RBC Bearings Incorporated | 0,01 | -1,30 | 2,57 | 18,04 | 1,8184 | 0,0634 | |||
| TLN / Talen Energy Corporation | 0,01 | 55,73 | 2,51 | 126,83 | 1,7798 | 0,8858 | |||
| CVLT / Commvault Systems, Inc. | 0,01 | -11,63 | 2,47 | -2,34 | 1,7485 | -0,2911 | |||
| MORN / Morningstar, Inc. | 0,01 | -1,82 | 2,44 | 2,78 | 1,7268 | -0,1871 | |||
| MELI / MercadoLibre, Inc. | 0,00 | 0,00 | 2,39 | 34,04 | 1,6966 | 0,2540 | |||
| CYBR / CyberArk Software Ltd. | 0,01 | -1,82 | 2,35 | 18,18 | 1,6635 | 0,0601 | |||
| RDNT / RadNet, Inc. | 0,04 | -1,75 | 2,35 | 12,46 | 1,6630 | -0,0215 | |||
| PEN / Penumbra, Inc. | 0,01 | -1,80 | 2,33 | -5,74 | 1,6535 | -0,3453 | |||
| PCOR / Procore Technologies, Inc. | 0,03 | -1,31 | 2,32 | 2,25 | 1,6447 | -0,1872 | |||
| NOVT / Novanta Inc. | 0,02 | 23,99 | 2,22 | 25,00 | 1,5738 | 0,1397 | |||
| AIT / Applied Industrial Technologies, Inc. | 0,01 | -1,32 | 2,16 | 1,79 | 1,5328 | -0,1824 | |||
| 6B6 / monday.com Ltd. | 0,01 | -7,66 | 2,16 | 19,47 | 1,5309 | 0,0706 | |||
| CWAN / Clearwater Analytics Holdings, Inc. | 0,10 | 59,59 | 2,15 | 30,56 | 1,5262 | 0,1949 | |||
| ALLSPRING GOVERNMENT MONEY MAR / STIV (000000000) | 2,14 | 2,14 | 1,5164 | 1,5164 | |||||
| VRNS / Varonis Systems, Inc. | 0,04 | 2,11 | 1,4935 | 1,4935 | |||||
| CLS / Celestica Inc. | 0,01 | 2,10 | 1,4884 | 1,4884 | |||||
| AFRM / Affirm Holdings, Inc. | 0,03 | 2,04 | 1,4460 | 1,4460 | |||||
| OPCH / Option Care Health, Inc. | 0,06 | 24,81 | 2,04 | 16,00 | 1,4437 | 0,0258 | |||
| RBA / RB Global, Inc. | 0,02 | -14,95 | 2,02 | -9,96 | 1,4284 | -0,3787 | |||
| BROS / Dutch Bros Inc. | 0,03 | -1,81 | 1,99 | 8,75 | 1,4092 | -0,0671 | |||
| JLL / Jones Lang LaSalle Incorporated | 0,01 | 4,91 | 1,99 | 8,28 | 1,4090 | -0,0738 | |||
| PSN / Parsons Corporation | 0,03 | 0,00 | 1,97 | 21,24 | 1,3958 | 0,0840 | |||
| TTEK / Tetra Tech, Inc. | 0,05 | 11,31 | 1,94 | 36,79 | 1,3762 | 0,2306 | |||
| ESAB / ESAB Corporation | 0,02 | -1,31 | 1,90 | 2,10 | 1,3449 | -0,1553 | |||
| HOOD / Robinhood Markets, Inc. | 0,02 | -41,16 | 1,87 | 32,37 | 1,3279 | 0,1851 | |||
| TDY / Teledyne Technologies Incorporated | 0,00 | -1,79 | 1,85 | 1,09 | 1,3128 | -0,1666 | |||
| DSGX / The Descartes Systems Group Inc. | 0,02 | -1,31 | 1,84 | -0,54 | 1,3045 | -0,1892 | |||
| TYL / Tyler Technologies, Inc. | 0,00 | 29,22 | 1,80 | 31,84 | 1,2764 | 0,1729 | |||
| TMHC / Taylor Morrison Home Corporation | 0,03 | 0,00 | 1,80 | 2,27 | 1,2759 | -0,1449 | |||
| TOST / Toast, Inc. | 0,04 | -30,09 | 1,79 | -6,68 | 1,2676 | -0,2793 | |||
| RYAN / Ryan Specialty Holdings, Inc. | 0,03 | 1,74 | 1,2347 | 1,2347 | |||||
| Viking Holdings Ltd / EC (BMG93A5A1010) | 0,03 | -12,85 | 1,74 | 16,85 | 1,2344 | 0,0309 | |||
| TW / Tradeweb Markets Inc. | 0,01 | -21,92 | 1,74 | -23,02 | 1,2328 | -0,5910 | |||
| IOT / Samsara Inc. | 0,04 | 21,81 | 1,73 | 26,44 | 1,2271 | 0,1214 | |||
| THC / Tenet Healthcare Corporation | 0,01 | -1,81 | 1,72 | 28,46 | 1,2223 | 0,1386 | |||
| INSM / Insmed Incorporated | 0,02 | -2,81 | 1,70 | 28,19 | 1,2020 | 0,1340 | |||
| NTRA / Natera, Inc. | 0,01 | -52,09 | 1,68 | -42,78 | 1,1919 | -1,1800 | |||
| WSO / Watsco, Inc. | 0,00 | 16,31 | 1,66 | 1,03 | 1,1783 | -0,1500 | |||
| MPWR / Monolithic Power Systems, Inc. | 0,00 | 0,00 | 1,60 | 26,06 | 1,1351 | 0,1097 | |||
| SAIA / Saia, Inc. | 0,01 | -1,31 | 1,59 | -22,61 | 1,1258 | -0,5315 | |||
| H / Hyatt Hotels Corporation | 0,01 | -1,81 | 1,56 | 11,87 | 1,1027 | -0,0195 | |||
| CHWY / Chewy, Inc. | 0,04 | 17,18 | 1,55 | 53,66 | 1,1001 | 0,2843 | |||
| BURL / Burlington Stores, Inc. | 0,01 | 0,00 | 1,54 | -2,40 | 1,0947 | -0,1828 | |||
| ASND / Ascendis Pharma A/S - Depositary Receipt (Common Stock) | 0,01 | 14,87 | 1,52 | 27,26 | 1,0788 | 0,1128 | |||
| SITE / SiteOne Landscape Supply, Inc. | 0,01 | -2,82 | 1,52 | -3,25 | 1,0763 | -0,1905 | |||
| TEVA / Teva Pharmaceutical Industries Limited - Depositary Receipt (Common Stock) | 0,09 | -1,76 | 1,52 | 7,14 | 1,0747 | -0,0682 | |||
| NBIX / Neurocrine Biosciences, Inc. | 0,01 | 34,85 | 1,50 | 53,21 | 1,0657 | 0,2735 | |||
| RGEN / Repligen Corporation | 0,01 | 8,28 | 1,47 | 5,84 | 1,0410 | -0,0794 | |||
| ADMA / ADMA Biologics, Inc. | 0,08 | 20,69 | 1,42 | 10,84 | 1,0071 | -0,0286 | |||
| GKOS / Glaukos Corporation | 0,01 | 12,19 | 1,41 | 17,71 | 0,9990 | 0,0325 | |||
| VCEL / Vericel Corporation | 0,03 | 1,40 | 0,9950 | 0,9950 | |||||
| ENTG / Entegris, Inc. | 0,02 | 25,37 | 1,38 | 15,56 | 0,9789 | 0,0141 | |||
| ATI / ATI Inc. | 0,02 | -29,18 | 1,37 | 17,45 | 0,9686 | 0,0296 | |||
| DKNG / DraftKings Inc. | 0,03 | -23,36 | 1,35 | -1,03 | 0,9581 | -0,1445 | |||
| BJ / BJ's Wholesale Club Holdings, Inc. | 0,01 | 1,33 | 0,9437 | 0,9437 | |||||
| CVNA / Carvana Co. | 0,00 | -48,97 | 1,31 | -17,77 | 0,9315 | -0,3587 | |||
| PI / Impinj, Inc. | 0,01 | 23,65 | 1,30 | 51,46 | 0,9181 | 0,2274 | |||
| AAON / AAON, Inc. | 0,01 | -16,14 | 1,04 | -20,87 | 0,7339 | -0,3222 | |||
| GLBE / Global-E Online Ltd. | 0,03 | 0,00 | 0,96 | -5,98 | 0,6803 | -0,1434 | |||
| CNM / Core & Main, Inc. | 0,01 | 0,73 | 0,5177 | 0,5177 | |||||
| WGS / GeneDx Holdings Corp. | 0,00 | -100,00 | 0,00 | -100,00 | -0,3921 | ||||
| FND / Floor & Decor Holdings, Inc. | 0,00 | -100,00 | 0,00 | -100,00 | -1,0957 |