Statistiques de base
| Valeur du portefeuille | $ 287 394 367 |
| Positions actuelles | 214 |
Dernières positions, performances, ASG (à partir des dépôts 13F, 13D)
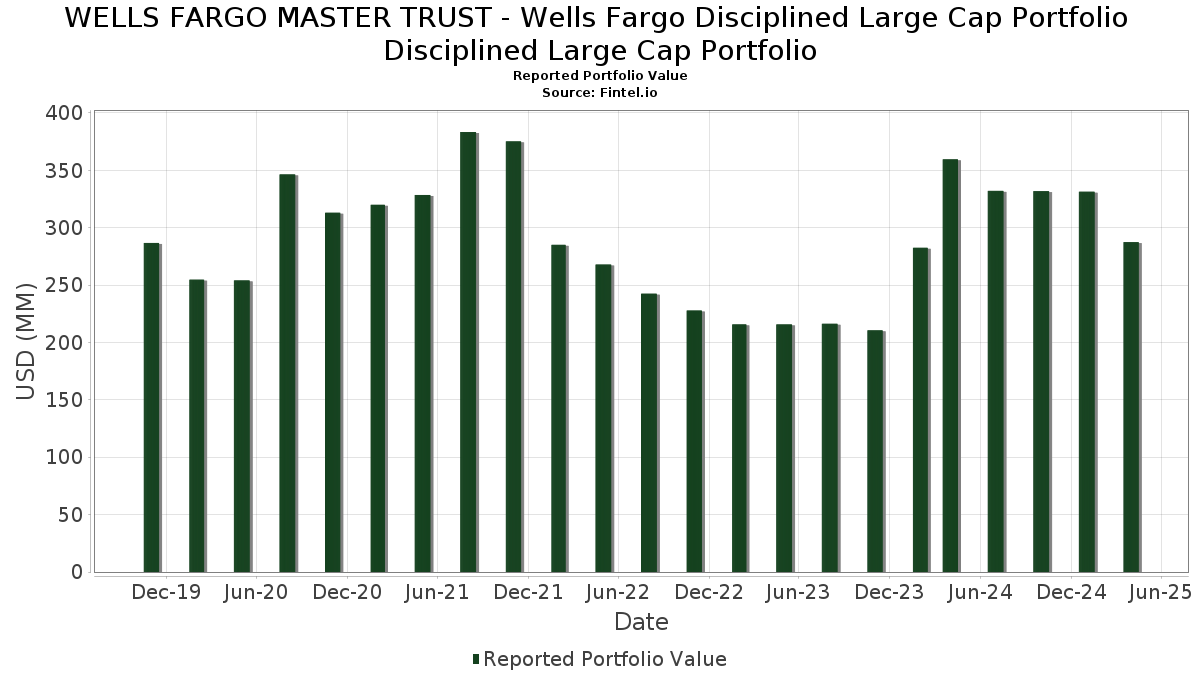
WELLS FARGO MASTER TRUST - Wells Fargo Disciplined Large Cap Portfolio Disciplined Large Cap Portfolio a déclaré un total de 214 positions dans ses derniers dépôts auprès de la SEC. La valeur la plus récente du portefeuille est calculée à 287 394 367 USD. Les actifs sous gestion réels (ASG) sont cette valeur plus les liquidités (qui ne sont pas divulguées). Les principales positions de WELLS FARGO MASTER TRUST - Wells Fargo Disciplined Large Cap Portfolio Disciplined Large Cap Portfolio sont Apple Inc. (US:AAPL) , Microsoft Corporation (US:MSFT) , NVIDIA Corporation (US:NVDA) , Amazon.com, Inc. (US:AMZN) , and Meta Platforms, Inc. (US:META) . Les nouvelles positions de WELLS FARGO MASTER TRUST - Wells Fargo Disciplined Large Cap Portfolio Disciplined Large Cap Portfolio incluent Omega Healthcare Investors, Inc. (US:OHI) , Keurig Dr Pepper Inc. (US:KDP) , MSA Safety Incorporated (US:MSA) , Valmont Industries, Inc. (US:VMI) , and Capri Holdings Limited (US:CPRI) .
Meilleures augmentations ce trimestre
Nous utilisons la variation de l'allocation du portefeuille car il s'agit de l'indicateur le plus significatif. Les changements peuvent être dus à des transactions ou à des variations de prix des actions.
| Titre | Actions (en millions) |
Valeur ($ en millions) |
% du portefeuille | ΔPortefeuille % |
|---|---|---|---|---|
| 6,66 | 6,66 | 2,3040 | 2,3040 | |
| 0,02 | 1,31 | 0,4536 | 0,4536 | |
| 0,03 | 1,19 | 0,4129 | 0,4129 | |
| 0,01 | 4,95 | 1,7139 | 0,4073 | |
| 0,02 | 2,32 | 0,8021 | 0,3843 | |
| 0,01 | 1,35 | 0,4679 | 0,3723 | |
| 0,01 | 1,41 | 0,4866 | 0,3499 | |
| 0,02 | 1,44 | 0,4995 | 0,3065 | |
| 0,01 | 1,18 | 0,4086 | 0,3020 | |
| 0,01 | 1,19 | 0,4117 | 0,2673 |
Principales baisses ce trimestre
Nous utilisons la variation de l'allocation du portefeuille car il s'agit de l'indicateur le plus significatif. Les changements peuvent être dus à des transactions ou à des variations de prix des actions.
| Titre | Actions (en millions) |
Valeur ($ en millions) |
% du portefeuille | ΔPortefeuille % |
|---|---|---|---|---|
| 0,05 | 9,72 | 3,3636 | -0,6389 | |
| 0,01 | 4,04 | 1,3995 | -0,4534 | |
| 0,01 | 7,40 | 2,5620 | -0,4073 | |
| 0,03 | 5,26 | 1,8204 | -0,3274 | |
| 0,02 | 1,66 | 0,5744 | -0,3203 | |
| 0,00 | 1,38 | 0,4762 | -0,3195 | |
| 0,00 | 0,64 | 0,2223 | -0,3177 | |
| 0,03 | 4,50 | 1,5574 | -0,2899 | |
| 0,00 | 0,49 | 0,1701 | -0,2803 | |
| 0,01 | 0,52 | 0,1806 | -0,2178 |
Déclarations 13F et dépôts de fonds
Ce formulaire a été déposé le 2025-06-25 pour la période de déclaration 2025-04-30. Cliquez sur l'icône du lien pour voir l'historique complet des transactions.
Mettre à niveau pour débloquer les données premium et exporter vers Excel ![]() .
.
| Titre | Type | Prix moyen de l'action | Actions (en millions) |
ΔActions (%) |
ΔActions (%) |
Valeur ($ en millions) |
Portefeuille (%) |
ΔPortefeuille (%) |
|
|---|---|---|---|---|---|---|---|---|---|
| AAPL / Apple Inc. | 0,08 | -5,64 | 16,40 | -15,04 | 5,6767 | -0,1442 | |||
| MSFT / Microsoft Corporation | 0,04 | -5,64 | 15,96 | -10,14 | 5,5216 | 0,1683 | |||
| NVDA / NVIDIA Corporation | 0,13 | -4,73 | 13,77 | -13,58 | 4,7651 | -0,0386 | |||
| AMZN / Amazon.com, Inc. | 0,05 | -5,64 | 9,72 | -26,79 | 3,3636 | -0,6389 | |||
| META / Meta Platforms, Inc. | 0,01 | -5,63 | 7,40 | -24,84 | 2,5620 | -0,4073 | |||
| ALLSPRING GOVERNMENT MONEY MAR / STIV (000000000) | 6,66 | 6,66 | 2,3040 | 2,3040 | |||||
| AVGO / Broadcom Inc. | 0,03 | -5,64 | 5,86 | -17,93 | 2,0294 | -0,1247 | |||
| GOOG / Alphabet Inc. | 0,03 | -5,64 | 5,26 | -26,17 | 1,8204 | -0,3274 | |||
| BRK.B / Berkshire Hathaway Inc. | 0,01 | 0,44 | 4,95 | 14,29 | 1,7139 | 0,4073 | |||
| JPM / JPMorgan Chase & Co. | 0,02 | -5,64 | 4,72 | -13,64 | 1,6318 | -0,0145 | |||
| GOOGL / Alphabet Inc. | 0,03 | -5,63 | 4,50 | -26,55 | 1,5574 | -0,2899 | |||
| NFLX / Netflix, Inc. | 0,00 | -13,00 | 4,06 | 0,79 | 1,4047 | 0,1906 | |||
| TSLA / Tesla, Inc. | 0,01 | -5,64 | 4,04 | -34,19 | 1,3995 | -0,4534 | |||
| V / Visa Inc. | 0,01 | -5,63 | 4,01 | -4,61 | 1,3882 | 0,1203 | |||
| LLY / Eli Lilly and Company | 0,00 | -5,63 | 3,92 | 4,59 | 1,3557 | 0,2264 | |||
| COST / Costco Wholesale Corporation | 0,00 | -5,65 | 3,54 | -4,25 | 1,2251 | 0,1105 | |||
| WMT / Walmart Inc. | 0,03 | -18,88 | 2,93 | -19,63 | 1,0142 | -0,0853 | |||
| ABBV / AbbVie Inc. | 0,01 | -5,64 | 2,50 | 0,12 | 0,8667 | 0,1124 | |||
| HD / The Home Depot, Inc. | 0,01 | -5,63 | 2,45 | -17,43 | 0,8463 | -0,0466 | |||
| CRM / Salesforce, Inc. | 0,01 | -10,72 | 2,32 | -29,79 | 0,8042 | -0,1937 | |||
| ABT / Abbott Laboratories | 0,02 | 63,67 | 2,32 | 67,29 | 0,8021 | 0,3843 | |||
| TJX / The TJX Companies, Inc. | 0,02 | -5,64 | 2,27 | -2,71 | 0,7845 | 0,0821 | |||
| XOM / Exxon Mobil Corporation | 0,02 | -5,64 | 2,23 | -6,70 | 0,7712 | 0,0511 | |||
| NOW / ServiceNow, Inc. | 0,00 | -5,59 | 2,21 | -11,49 | 0,7650 | 0,0122 | |||
| GS / The Goldman Sachs Group, Inc. | 0,00 | -5,64 | 2,17 | -19,29 | 0,7513 | -0,0600 | |||
| QCOM / QUALCOMM Incorporated | 0,01 | 8,79 | 2,05 | -6,58 | 0,7081 | 0,0476 | |||
| MO / Altria Group, Inc. | 0,03 | -5,64 | 2,03 | 6,89 | 0,7032 | 0,1299 | |||
| CSCO / Cisco Systems, Inc. | 0,03 | -5,64 | 1,93 | -10,13 | 0,6667 | 0,0205 | |||
| FTXP / Foothills Exploration, Inc. | 0,00 | 11,21 | 1,90 | 5,84 | 0,6585 | 0,1165 | |||
| PM / Philip Morris International Inc. | 0,01 | -5,64 | 1,87 | 24,14 | 0,6481 | 0,1935 | |||
| T / AT&T Inc. | 0,07 | -18,96 | 1,83 | -5,42 | 0,6338 | 0,0501 | |||
| MA / Mastercard Incorporated | 0,00 | -5,61 | 1,71 | -6,85 | 0,5932 | 0,0383 | |||
| DUK / Duke Energy Corporation | 0,01 | -5,64 | 1,69 | 2,80 | 0,5850 | 0,0893 | |||
| WFC / Wells Fargo & Company | 0,02 | -37,93 | 1,66 | -44,05 | 0,5744 | -0,3203 | |||
| PGR / The Progressive Corporation | 0,01 | -5,64 | 1,63 | 7,87 | 0,5647 | 0,1086 | |||
| C / Citigroup Inc. | 0,02 | -5,65 | 1,58 | -20,79 | 0,5474 | -0,0545 | |||
| CL / Colgate-Palmolive Company | 0,02 | -5,64 | 1,56 | 0,32 | 0,5387 | 0,0709 | |||
| PSA / Public Storage | 0,01 | 14,81 | 1,55 | 15,57 | 0,5369 | 0,1321 | |||
| BK / The Bank of New York Mellon Corporation | 0,02 | -20,31 | 1,51 | -25,46 | 0,5232 | -0,0881 | |||
| FTNT / Fortinet, Inc. | 0,01 | -14,08 | 1,51 | -11,61 | 0,5216 | 0,0074 | |||
| AEP / American Electric Power Company, Inc. | 0,01 | -5,64 | 1,49 | 3,91 | 0,5147 | 0,0832 | |||
| PG / The Procter & Gamble Company | 0,01 | -5,63 | 1,49 | -7,59 | 0,5141 | 0,0295 | |||
| SPG / Simon Property Group, Inc. | 0,01 | -5,64 | 1,48 | -14,57 | 0,5115 | -0,0102 | |||
| VRSN / VeriSign, Inc. | 0,01 | -5,65 | 1,46 | 23,81 | 0,5058 | 0,1499 | |||
| CF / CF Industries Holdings, Inc. | 0,02 | 165,29 | 1,44 | 125,47 | 0,4995 | 0,3065 | |||
| AMP / Ameriprise Financial, Inc. | 0,00 | -5,66 | 1,43 | -18,20 | 0,4947 | -0,0323 | |||
| ACN / Accenture plc | 0,00 | 48,83 | 1,41 | 15,69 | 0,4875 | 0,1203 | |||
| CME / CME Group Inc. | 0,01 | 164,74 | 1,41 | 210,38 | 0,4866 | 0,3499 | |||
| ISRG / Intuitive Surgical, Inc. | 0,00 | -42,19 | 1,38 | -47,86 | 0,4762 | -0,3195 | |||
| ANET / Arista Networks Inc | 0,02 | 37,77 | 1,36 | -1,66 | 0,4720 | 0,0539 | |||
| LNG / Cheniere Energy, Inc. | 0,01 | 236,07 | 1,35 | 326,50 | 0,4679 | 0,3723 | |||
| JNJ / Johnson & Johnson | 0,01 | -5,64 | 1,35 | -3,09 | 0,4675 | 0,0473 | |||
| NEE / NextEra Energy, Inc. | 0,02 | -5,63 | 1,35 | -11,83 | 0,4670 | 0,0057 | |||
| UNH / UnitedHealth Group Incorporated | 0,00 | -5,59 | 1,33 | -28,37 | 0,4613 | -0,1000 | |||
| PH / Parker-Hannifin Corporation | 0,00 | -5,60 | 1,33 | -19,21 | 0,4585 | -0,0360 | |||
| PLTR / Palantir Technologies Inc. | 0,01 | -5,64 | 1,32 | 35,42 | 0,4567 | 0,1630 | |||
| NFG / National Fuel Gas Company | 0,02 | 1,31 | 0,4536 | 0,4536 | |||||
| EME / EMCOR Group, Inc. | 0,00 | -5,64 | 1,29 | -15,60 | 0,4476 | -0,0145 | |||
| LIN / Linde plc | 0,00 | -5,65 | 1,29 | -4,15 | 0,4475 | 0,0407 | |||
| VICI / VICI Properties Inc. | 0,04 | -5,64 | 1,29 | 1,49 | 0,4473 | 0,0633 | |||
| MCK / McKesson Corporation | 0,00 | -5,61 | 1,28 | 13,15 | 0,4437 | 0,1020 | |||
| CCK / Crown Holdings, Inc. | 0,01 | -5,63 | 1,26 | 3,46 | 0,4349 | 0,0687 | |||
| SPOT / Spotify Technology S.A. | 0,00 | -42,40 | 1,25 | -35,53 | 0,4341 | -0,1525 | |||
| ALSN / Allison Transmission Holdings, Inc. | 0,01 | -5,64 | 1,25 | -25,96 | 0,4323 | -0,0763 | |||
| IBKR / Interactive Brokers Group, Inc. | 0,01 | -22,97 | 1,25 | -39,11 | 0,4316 | -0,1860 | |||
| SCHW / The Charles Schwab Corporation | 0,02 | 61,84 | 1,23 | 122,73 | 0,4242 | 0,1703 | |||
| CVS / CVS Health Corporation | 0,02 | -5,64 | 1,21 | 11,51 | 0,4192 | 0,0915 | |||
| ZTS / Zoetis Inc. | 0,01 | -5,63 | 1,20 | -13,60 | 0,4157 | -0,0036 | |||
| OHI / Omega Healthcare Investors, Inc. | 0,03 | 1,19 | 0,4129 | 0,4129 | |||||
| RGLD / Royal Gold, Inc. | 0,01 | 90,16 | 1,19 | 148,74 | 0,4117 | 0,2673 | |||
| LDOS / Leidos Holdings, Inc. | 0,01 | -5,63 | 1,18 | -2,23 | 0,4096 | 0,0447 | |||
| SAIC / Science Applications International Corporation | 0,01 | 198,90 | 1,18 | 234,28 | 0,4086 | 0,3020 | |||
| MCD / McDonald's Corporation | 0,00 | -5,64 | 1,17 | 4,46 | 0,4052 | 0,0673 | |||
| LMT / Lockheed Martin Corporation | 0,00 | -5,66 | 1,16 | -2,61 | 0,3997 | 0,0420 | |||
| CAT / Caterpillar Inc. | 0,00 | -5,66 | 1,15 | -21,44 | 0,3995 | -0,0436 | |||
| KMB / Kimberly-Clark Corporation | 0,01 | -5,64 | 1,15 | -4,34 | 0,3972 | 0,0355 | |||
| MMM / 3M Company | 0,01 | -5,63 | 1,15 | -13,89 | 0,3971 | -0,0046 | |||
| ZM / Zoom Communications Inc. | 0,01 | -5,64 | 1,14 | -15,88 | 0,3943 | -0,0139 | |||
| UAL / United Airlines Holdings, Inc. | 0,02 | -5,65 | 1,14 | -38,65 | 0,3940 | -0,1655 | |||
| TGT / Target Corporation | 0,01 | 72,25 | 1,11 | 20,72 | 0,3855 | 0,1074 | |||
| HON / Honeywell International Inc. | 0,01 | -5,65 | 1,11 | -11,23 | 0,3834 | 0,0071 | |||
| EXEL / Exelixis, Inc. | 0,03 | -5,64 | 1,10 | 11,39 | 0,3792 | 0,0828 | |||
| PLD / Prologis, Inc. | 0,01 | -5,64 | 1,09 | -19,17 | 0,3768 | -0,0291 | |||
| BAC / Bank of America Corporation | 0,03 | -5,64 | 1,08 | -18,75 | 0,3722 | -0,0268 | |||
| MRK / Merck & Co., Inc. | 0,01 | -5,64 | 1,08 | -18,62 | 0,3721 | -0,0264 | |||
| GLPI / Gaming and Leisure Properties, Inc. | 0,02 | -5,64 | 1,07 | -6,63 | 0,3703 | 0,0246 | |||
| CVX / Chevron Corporation | 0,01 | -5,65 | 1,05 | -13,96 | 0,3649 | -0,0046 | |||
| RGA / Reinsurance Group of America, Incorporated | 0,01 | -5,63 | 1,04 | -22,46 | 0,3599 | -0,0443 | |||
| BSX / Boston Scientific Corporation | 0,01 | -5,65 | 1,04 | -5,20 | 0,3598 | 0,0292 | |||
| PFE / Pfizer Inc. | 0,04 | -5,64 | 1,04 | -13,16 | 0,3587 | -0,0011 | |||
| COR / Cencora, Inc. | 0,00 | -5,63 | 1,03 | 8,61 | 0,3579 | 0,0709 | |||
| VEEV / Veeva Systems Inc. | 0,00 | 30,73 | 1,01 | 30,99 | 0,3481 | 0,1166 | |||
| COF / Capital One Financial Corporation | 0,01 | -27,30 | 0,99 | -35,69 | 0,3431 | -0,1216 | |||
| CNC / Centene Corporation | 0,02 | -5,64 | 0,99 | -11,83 | 0,3431 | 0,0042 | |||
| ADBE / Adobe Inc. | 0,00 | -5,65 | 0,98 | -19,11 | 0,3400 | -0,0263 | |||
| BKNG / Booking Holdings Inc. | 0,00 | -5,94 | 0,97 | 1,26 | 0,3353 | 0,0468 | |||
| MPC / Marathon Petroleum Corporation | 0,01 | -5,66 | 0,92 | -11,08 | 0,3197 | 0,0066 | |||
| HOLX / Hologic, Inc. | 0,02 | 122,91 | 0,92 | 79,92 | 0,3195 | 0,1647 | |||
| AXP / American Express Company | 0,00 | -5,65 | 0,90 | -20,88 | 0,3124 | -0,0313 | |||
| BLK / BlackRock, Inc. | 0,00 | -5,47 | 0,88 | -19,64 | 0,3059 | -0,0258 | |||
| CMCSA / Comcast Corporation | 0,03 | -5,63 | 0,88 | -4,16 | 0,3034 | 0,0277 | |||
| VIRT / Virtu Financial, Inc. | 0,02 | -5,64 | 0,88 | -7,80 | 0,3030 | 0,0167 | |||
| PSX / Phillips 66 | 0,01 | -5,64 | 0,87 | -16,70 | 0,3006 | -0,0138 | |||
| AMAT / Applied Materials, Inc. | 0,01 | -37,43 | 0,83 | -47,74 | 0,2886 | -0,1923 | |||
| UNM / Unum Group | 0,01 | 91,03 | 0,83 | 94,37 | 0,2868 | 0,1584 | |||
| SYK / Stryker Corporation | 0,00 | -5,65 | 0,82 | -9,82 | 0,2828 | 0,0095 | |||
| HWM / Howmet Aerospace Inc. | 0,01 | -46,18 | 0,80 | -41,06 | 0,2782 | -0,1331 | |||
| UBER / Uber Technologies, Inc. | 0,01 | -5,65 | 0,80 | 14,37 | 0,2755 | 0,0656 | |||
| MET / MetLife, Inc. | 0,01 | -5,63 | 0,79 | -17,85 | 0,2727 | -0,0163 | |||
| PHM / PulteGroup, Inc. | 0,01 | -5,66 | 0,78 | -14,98 | 0,2712 | -0,0066 | |||
| NTNX / Nutanix, Inc. | 0,01 | -5,63 | 0,78 | -5,68 | 0,2701 | 0,0205 | |||
| LEN / Lennar Corporation | 0,01 | -5,64 | 0,78 | -21,94 | 0,2699 | -0,0312 | |||
| FNF / Fidelity National Financial, Inc. | 0,01 | -5,64 | 0,77 | 3,90 | 0,2677 | 0,0432 | |||
| NOC / Northrop Grumman Corporation | 0,00 | -5,62 | 0,76 | -5,71 | 0,2631 | 0,0199 | |||
| REGN / Regeneron Pharmaceuticals, Inc. | 0,00 | -5,67 | 0,76 | -16,09 | 0,2619 | -0,0100 | |||
| OKTA / Okta, Inc. | 0,01 | -5,63 | 0,75 | 12,31 | 0,2590 | 0,0581 | |||
| HIG / The Hartford Insurance Group, Inc. | 0,01 | -5,65 | 0,73 | 3,84 | 0,2530 | 0,0406 | |||
| PAYC / Paycom Software, Inc. | 0,00 | -5,63 | 0,72 | 2,84 | 0,2508 | 0,0385 | |||
| CACI / CACI International Inc | 0,00 | -5,65 | 0,72 | 11,84 | 0,2486 | 0,0549 | |||
| INGR / Ingredion Incorporated | 0,01 | -5,65 | 0,69 | -8,10 | 0,2395 | 0,0123 | |||
| AYI / Acuity Inc. | 0,00 | -5,62 | 0,68 | -30,90 | 0,2363 | -0,0613 | |||
| EWBC / East West Bancorp, Inc. | 0,01 | -5,64 | 0,68 | -21,63 | 0,2359 | -0,0262 | |||
| THC / Tenet Healthcare Corporation | 0,00 | -5,66 | 0,68 | -4,25 | 0,2341 | 0,0210 | |||
| APP / AppLovin Corporation | 0,00 | -21,77 | 0,67 | -43,03 | 0,2321 | -0,1226 | |||
| DOCU / DocuSign, Inc. | 0,01 | -22,27 | 0,67 | -34,35 | 0,2304 | -0,0751 | |||
| CRH / CRH plc | 0,01 | -5,63 | 0,65 | -9,01 | 0,2237 | 0,0094 | |||
| APO / Apollo Global Management, Inc. | 0,00 | -55,06 | 0,64 | -64,15 | 0,2223 | -0,3177 | |||
| SYF / Synchrony Financial | 0,01 | -5,63 | 0,64 | -28,97 | 0,2200 | -0,0497 | |||
| WM / Waste Management, Inc. | 0,00 | -5,65 | 0,62 | 0,00 | 0,2158 | 0,0277 | |||
| EMR / Emerson Electric Co. | 0,01 | -5,63 | 0,62 | -23,61 | 0,2139 | -0,0302 | |||
| SNX / TD SYNNEX Corporation | 0,01 | -32,38 | 0,61 | -47,47 | 0,2120 | -0,1393 | |||
| EEFT / Euronet Worldwide, Inc. | 0,01 | 127,20 | 0,61 | 129,06 | 0,2103 | 0,1301 | |||
| PEP / PepsiCo, Inc. | 0,00 | -42,29 | 0,60 | -48,07 | 0,2091 | -0,1417 | |||
| GILD / Gilead Sciences, Inc. | 0,01 | -5,64 | 0,60 | 3,47 | 0,2065 | 0,0325 | |||
| DECK / Deckers Outdoor Corporation | 0,01 | -5,65 | 0,60 | -41,05 | 0,2064 | -0,0986 | |||
| TT / Trane Technologies plc | 0,00 | -5,56 | 0,58 | -0,17 | 0,2006 | 0,0255 | |||
| TSN / Tyson Foods, Inc. | 0,01 | 70,95 | 0,57 | 96,89 | 0,1969 | 0,0633 | |||
| GE / General Electric Company | 0,00 | -5,68 | 0,57 | -6,73 | 0,1968 | 0,0132 | |||
| EXPE / Expedia Group, Inc. | 0,00 | -5,64 | 0,56 | -13,33 | 0,1936 | -0,0011 | |||
| MTZ / MasTec, Inc. | 0,00 | -5,65 | 0,56 | -17,19 | 0,1935 | -0,0101 | |||
| COIN / Coinbase Global, Inc. | 0,00 | -5,65 | 0,56 | -34,35 | 0,1934 | -0,0630 | |||
| FCX / Freeport-McMoRan Inc. | 0,02 | -5,64 | 0,55 | -5,20 | 0,1895 | 0,0154 | |||
| GAP / The Gap, Inc. | 0,02 | -5,64 | 0,55 | -14,15 | 0,1892 | -0,0028 | |||
| VRTX / Vertex Pharmaceuticals Incorporated | 0,00 | -5,71 | 0,54 | 4,06 | 0,1864 | 0,0303 | |||
| PCAR / PACCAR Inc | 0,01 | -51,45 | 0,52 | -60,48 | 0,1806 | -0,2178 | |||
| GD / General Dynamics Corporation | 0,00 | -5,62 | 0,51 | 0,00 | 0,1772 | 0,0227 | |||
| GM / General Motors Company | 0,01 | -5,64 | 0,50 | -13,67 | 0,1727 | -0,0016 | |||
| EBAY / eBay Inc. | 0,01 | -5,64 | 0,50 | -4,80 | 0,1720 | 0,0148 | |||
| BLDR / Builders FirstSource, Inc. | 0,00 | -53,98 | 0,49 | -67,11 | 0,1701 | -0,2803 | |||
| DOCS / Doximity, Inc. | 0,01 | -5,64 | 0,49 | -9,26 | 0,1698 | 0,0069 | |||
| DUOL / Duolingo, Inc. | 0,00 | -5,62 | 0,49 | 1,03 | 0,1697 | 0,0233 | |||
| PYPL / PayPal Holdings, Inc. | 0,01 | -5,63 | 0,49 | -29,87 | 0,1683 | -0,0407 | |||
| CPRT / Copart, Inc. | 0,01 | -56,51 | 0,48 | -50,05 | 0,1669 | -0,1744 | |||
| ADP / Automatic Data Processing, Inc. | 0,00 | -5,65 | 0,48 | -6,42 | 0,1667 | 0,0115 | |||
| AMT / American Tower Corporation | 0,00 | -42,65 | 0,47 | -30,07 | 0,1635 | -0,0403 | |||
| CROX / Crocs, Inc. | 0,00 | -5,64 | 0,47 | -10,80 | 0,1631 | 0,0037 | |||
| EOG / EOG Resources, Inc. | 0,00 | -48,06 | 0,46 | -54,50 | 0,1577 | -0,1438 | |||
| KDP / Keurig Dr Pepper Inc. | 0,01 | 0,44 | 0,1529 | 0,1529 | |||||
| MSA / MSA Safety Incorporated | 0,00 | 0,44 | 0,1516 | 0,1516 | |||||
| GRMN / Garmin Ltd. | 0,00 | -5,60 | 0,43 | -18,27 | 0,1503 | -0,0099 | |||
| AMD / Advanced Micro Devices, Inc. | 0,00 | -5,63 | 0,42 | -20,75 | 0,1469 | -0,0146 | |||
| DKS / DICK'S Sporting Goods, Inc. | 0,00 | -5,65 | 0,42 | -26,18 | 0,1464 | -0,0265 | |||
| VRT / Vertiv Holdings Co | 0,00 | -5,64 | 0,41 | -31,22 | 0,1428 | -0,0379 | |||
| VLTO / Veralto Corporation | 0,00 | -5,64 | 0,41 | -12,39 | 0,1420 | 0,0006 | |||
| SF / Stifel Financial Corp. | 0,00 | -5,64 | 0,40 | -30,16 | 0,1395 | -0,0346 | |||
| WCC / WESCO International, Inc. | 0,00 | -5,66 | 0,39 | -16,88 | 0,1364 | -0,0066 | |||
| DXC / DXC Technology Company | 0,02 | 0,38 | 0,1319 | 0,1319 | |||||
| UGI / UGI Corporation | 0,01 | -5,64 | 0,38 | 0,53 | 0,1311 | 0,0177 | |||
| APPF / AppFolio, Inc. | 0,00 | -5,64 | 0,37 | -16,63 | 0,1268 | -0,0058 | |||
| KO / The Coca-Cola Company | 0,00 | -5,67 | 0,36 | 7,85 | 0,1236 | 0,0237 | |||
| GMED / Globus Medical, Inc. | 0,00 | -26,63 | 0,35 | -25,05 | 0,1222 | -0,0395 | |||
| AXS / AXIS Capital Holdings Limited | 0,00 | -5,63 | 0,34 | -0,29 | 0,1179 | 0,0150 | |||
| RBLX / Roblox Corporation | 0,01 | -5,63 | 0,34 | -11,02 | 0,1175 | 0,0025 | |||
| FFIV / F5, Inc. | 0,00 | -5,69 | 0,34 | -15,92 | 0,1170 | -0,0044 | |||
| VMI / Valmont Industries, Inc. | 0,00 | 0,34 | 0,1166 | 0,1166 | |||||
| EVRG / Evergy, Inc. | 0,00 | -5,64 | 0,33 | 1,53 | 0,1152 | 0,0164 | |||
| ONTO / Onto Innovation Inc. | 0,00 | -5,62 | 0,33 | -43,90 | 0,1148 | -0,0631 | |||
| MNST / Monster Beverage Corporation | 0,01 | -5,62 | 0,33 | 16,43 | 0,1129 | 0,0285 | |||
| CAH / Cardinal Health, Inc. | 0,00 | -36,21 | 0,33 | -27,13 | 0,1125 | -0,0220 | |||
| CPRI / Capri Holdings Limited | 0,02 | 0,32 | 0,1120 | 0,1120 | |||||
| CRUS / Cirrus Logic, Inc. | 0,00 | -5,63 | 0,32 | -9,60 | 0,1108 | 0,0038 | |||
| ORCL / Oracle Corporation | 0,00 | -5,64 | 0,31 | -22,11 | 0,1076 | -0,0125 | |||
| ZBRA / Zebra Technologies Corporation | 0,00 | -48,22 | 0,31 | -66,92 | 0,1056 | -0,1726 | |||
| JEF / Jefferies Financial Group Inc. | 0,01 | -5,65 | 0,30 | -42,69 | 0,1047 | -0,0544 | |||
| ADT / ADT Inc. | 0,04 | 0,30 | 0,1031 | 0,1031 | |||||
| APA / APA Corporation | 0,02 | -5,64 | 0,30 | -33,18 | 0,1026 | -0,0311 | |||
| JLL / Jones Lang LaSalle Incorporated | 0,00 | -5,66 | 0,29 | -24,22 | 0,1010 | -0,0150 | |||
| CSX / CSX Corporation | 0,01 | -5,64 | 0,29 | -19,44 | 0,0991 | -0,0080 | |||
| CEG / Constellation Energy Corporation | 0,00 | -5,68 | 0,28 | -29,93 | 0,0976 | -0,0234 | |||
| TEAM / Atlassian Corporation | 0,00 | 93,11 | 0,28 | 116,15 | 0,0975 | 0,0373 | |||
| PINS / Pinterest, Inc. | 0,01 | -5,64 | 0,28 | -27,68 | 0,0962 | -0,0194 | |||
| BILL / BILL Holdings, Inc. | 0,01 | 562,17 | 0,28 | 151,82 | 0,0961 | 0,0476 | |||
| AMGN / Amgen Inc. | 0,00 | -5,74 | 0,27 | -3,89 | 0,0942 | 0,0088 | |||
| ELV / Elevance Health, Inc. | 0,00 | -5,60 | 0,27 | 0,37 | 0,0933 | 0,0123 | |||
| DIS / The Walt Disney Company | 0,00 | -5,62 | 0,27 | -24,08 | 0,0930 | -0,0137 | |||
| AXTA / Axalta Coating Systems Ltd. | 0,01 | 0,27 | 0,0928 | 0,0928 | |||||
| HST / Host Hotels & Resorts, Inc. | 0,02 | -52,27 | 0,27 | -59,67 | 0,0925 | -0,1073 | |||
| FCNCA / First Citizens BancShares, Inc. | 0,00 | -5,92 | 0,25 | -24,18 | 0,0880 | -0,0130 | |||
| VZ / Verizon Communications Inc. | 0,01 | -5,63 | 0,25 | 5,83 | 0,0879 | 0,0154 | |||
| WYNN / Wynn Resorts, Limited | 0,00 | -5,65 | 0,25 | -12,63 | 0,0863 | 0,0001 | |||
| TWLO / Twilio Inc. | 0,00 | -38,20 | 0,25 | -59,25 | 0,0863 | -0,0982 | |||
| LRCX / Lam Research Corporation | 0,00 | -5,61 | 0,24 | -16,55 | 0,0823 | -0,0036 | |||
| ARW / Arrow Electronics, Inc. | 0,00 | -5,64 | 0,24 | -9,92 | 0,0818 | 0,0028 | |||
| SEE / Sealed Air Corporation | 0,01 | -5,64 | 0,23 | -25,49 | 0,0792 | -0,0132 | |||
| VST / Vistra Corp. | 0,00 | -5,64 | 0,23 | -27,48 | 0,0789 | -0,0155 | |||
| MANH / Manhattan Associates, Inc. | 0,00 | -5,66 | 0,21 | -19,92 | 0,0726 | -0,0062 | |||
| ED / Consolidated Edison, Inc. | 0,00 | -5,67 | 0,19 | 13,69 | 0,0662 | 0,0154 | |||
| TRIP / Tripadvisor, Inc. | 0,01 | -5,64 | 0,18 | -33,21 | 0,0636 | -0,0192 | |||
| OGN / Organon & Co. | 0,01 | -5,64 | 0,18 | -21,78 | 0,0611 | -0,0068 | |||
| CPAY / Corpay, Inc. | 0,00 | -5,86 | 0,16 | -19,40 | 0,0561 | -0,0046 | |||
| MEDP / Medpace Holdings, Inc. | 0,00 | -5,75 | 0,15 | -16,57 | 0,0507 | -0,0024 | |||
| US4039491000 / HF Sinclair Corp. | 0,00 | -5,64 | 0,12 | -21,29 | 0,0423 | -0,0046 | |||
| TXG / 10x Genomics, Inc. | 0,01 | -5,64 | 0,11 | -48,10 | 0,0379 | -0,0256 | |||
| S+P500 EMINI FUT JUN25 / DE (000000000) | 0,08 | 0,0281 | 0,0281 | ||||||
| VOYA / Voya Financial, Inc. | 0,00 | -100,00 | 0,00 | -100,00 | -0,1266 |