Statistiques de base
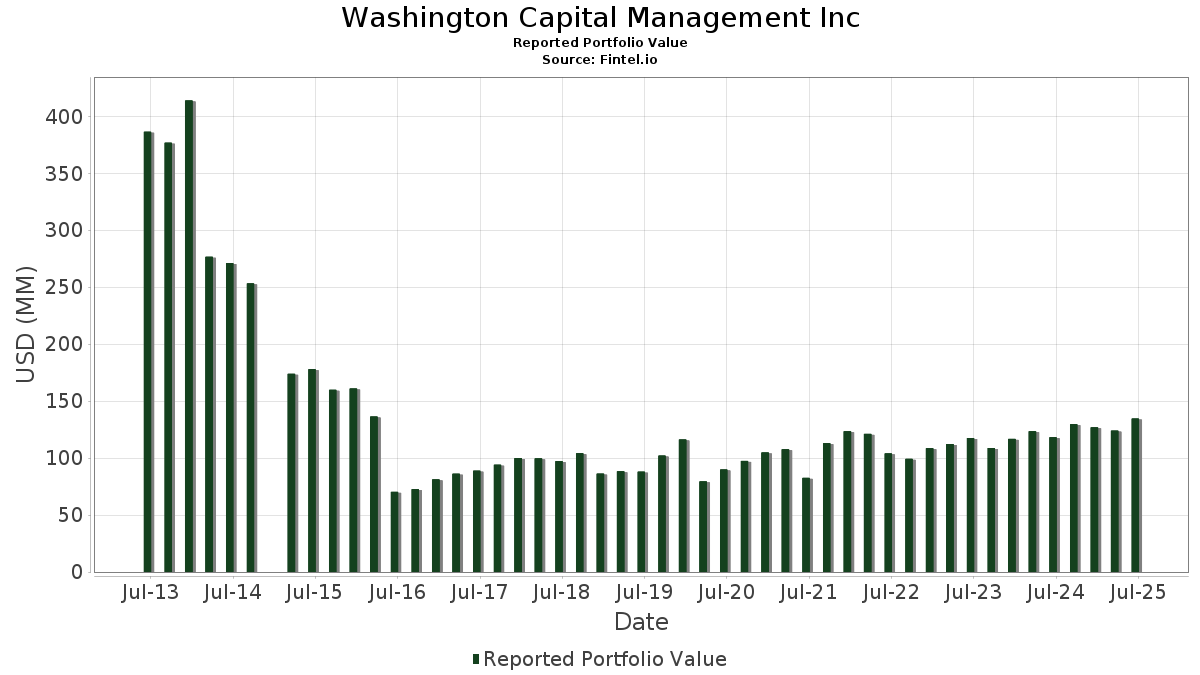
| Valeur du portefeuille | $ 134 601 186 |
| Positions actuelles | 116 |
Dernières positions, performances, ASG (à partir des dépôts 13F, 13D)
Washington Capital Management Inc a déclaré un total de 116 positions dans ses derniers dépôts auprès de la SEC. La valeur la plus récente du portefeuille est calculée à 134 601 186 USD. Les actifs sous gestion réels (ASG) sont cette valeur plus les liquidités (qui ne sont pas divulguées). Les principales positions de Washington Capital Management Inc sont Vanguard Index Funds - Vanguard Total Stock Market ETF (US:VTI) , SPDR Dow Jones Industrial Average ETF Trust (US:DIA) , SPDR S&P 500 ETF (US:SPY) , Vanguard Bond Index Funds - Vanguard Short-Term Bond ETF (US:BSV) , and iShares Trust - iShares 1-5 Year Investment Grade Corporate Bond ETF (US:IGSB) . Les nouvelles positions de Washington Capital Management Inc incluent Vanguard Bond Index Funds - Vanguard Ultra-Short Bond ETF (US:VUSB) , Hubbell Incorporated (US:HUBB) , Vertiv Holdings Co (US:VRT) , CSX Corporation (US:CSX) , and The Timken Company (US:TKR) .
Meilleures augmentations ce trimestre
Nous utilisons la variation de l'allocation du portefeuille car il s'agit de l'indicateur le plus significatif. Les changements peuvent être dus à des transactions ou à des variations de prix des actions.
| Titre | Actions (en millions) |
Valeur ($ en millions) |
% du portefeuille | ΔPortefeuille % |
|---|---|---|---|---|
| 0,02 | 1,49 | 1,1055 | 0,5523 | |
| 0,01 | 0,74 | 0,5520 | 0,5520 | |
| 0,00 | 1,07 | 0,7918 | 0,4580 | |
| 0,01 | 0,50 | 0,3730 | 0,3730 | |
| 0,01 | 0,50 | 0,3705 | 0,3705 | |
| 0,00 | 0,49 | 0,3641 | 0,3641 | |
| 0,01 | 0,49 | 0,3640 | 0,3640 | |
| 0,00 | 0,49 | 0,3620 | 0,3620 | |
| 0,08 | 25,77 | 19,1465 | 0,3534 | |
| 0,01 | 0,46 | 0,3450 | 0,3450 |
Principales baisses ce trimestre
Nous utilisons la variation de l'allocation du portefeuille car il s'agit de l'indicateur le plus significatif. Les changements peuvent être dus à des transactions ou à des variations de prix des actions.
| Titre | Actions (en millions) |
Valeur ($ en millions) |
% du portefeuille | ΔPortefeuille % |
|---|---|---|---|---|
| 0,02 | 0,53 | 0,3959 | -0,5989 | |
| 0,00 | 0,00 | -0,4525 | ||
| 0,00 | 0,25 | 0,1891 | -0,4129 | |
| 0,09 | 6,98 | 5,1821 | -0,4127 | |
| 0,00 | 0,00 | -0,3713 | ||
| 0,00 | 0,35 | 0,2609 | -0,3538 | |
| 0,00 | 0,42 | 0,3141 | -0,2582 | |
| 0,02 | 9,47 | 7,0382 | -0,2412 | |
| 0,00 | 0,35 | 0,2599 | -0,2095 | |
| 0,02 | 1,11 | 0,8243 | -0,1857 |
Déclarations 13F et dépôts de fonds
Ce formulaire a été déposé le 2025-07-17 pour la période de déclaration 2025-06-30. Cliquez sur l'icône du lien pour voir l'historique complet des transactions.
Mettre à niveau pour débloquer les données premium et exporter vers Excel ![]() .
.
| Titre | Type | Prix moyen de l'action | Actions (en millions) |
ΔActions (%) |
ΔActions (%) |
Valeur ($ en millions) |
Portefeuille (%) |
ΔPortefeuille (%) |
|
|---|---|---|---|---|---|---|---|---|---|
| VTI / Vanguard Index Funds - Vanguard Total Stock Market ETF | 0,08 | 0,00 | 25,77 | 10,59 | 19,1465 | 0,3534 | |||
| DIA / SPDR Dow Jones Industrial Average ETF Trust | 0,02 | 0,00 | 9,47 | 4,94 | 7,0382 | -0,2412 | |||
| SPY / SPDR S&P 500 ETF | 0,01 | 0,00 | 8,45 | 10,45 | 6,2753 | 0,1084 | |||
| BSV / Vanguard Bond Index Funds - Vanguard Short-Term Bond ETF | 0,09 | 0,00 | 6,98 | 0,55 | 5,1821 | -0,4127 | |||
| IGSB / iShares Trust - iShares 1-5 Year Investment Grade Corporate Bond ETF | 0,06 | 1,71 | 3,13 | 2,45 | 2,3290 | -0,1381 | |||
| JPM / JPMorgan Chase & Co. | 0,01 | 0,00 | 2,69 | 18,19 | 1,9988 | 0,1631 | |||
| AEM / Agnico Eagle Mines Limited | 0,02 | -7,27 | 2,35 | 1,73 | 1,7477 | -0,1170 | |||
| ACWX / iShares Trust - iShares MSCI ACWI ex U.S. ETF | 0,04 | 0,00 | 2,31 | 9,91 | 1,7141 | 0,0212 | |||
| PNC / The PNC Financial Services Group, Inc. | 0,01 | 7,43 | 1,62 | 13,96 | 1,2008 | 0,0569 | |||
| GOOG / Alphabet Inc. | 0,01 | 0,00 | 1,61 | 13,58 | 1,1993 | 0,0528 | |||
| EMR / Emerson Electric Co. | 0,01 | 0,00 | 1,51 | 21,65 | 1,1193 | 0,1202 | |||
| MCHP / Microchip Technology Incorporated | 0,02 | 49,22 | 1,49 | 117,08 | 1,1055 | 0,5523 | |||
| VCSH / Vanguard Scottsdale Funds - Vanguard Short-Term Corporate Bond ETF | 0,02 | 0,69 | 1,45 | 1,40 | 1,0782 | -0,0759 | |||
| KEY / KeyCorp | 0,08 | -7,34 | 1,39 | 0,95 | 1,0293 | -0,0775 | |||
| SBAC / SBA Communications Corporation | 0,01 | 0,00 | 1,35 | 6,72 | 1,0032 | -0,0169 | |||
| CIEN / Ciena Corporation | 0,02 | 0,00 | 1,32 | 34,59 | 0,9801 | 0,1896 | |||
| VEU / Vanguard International Equity Index Funds - Vanguard FTSE All-World ex-US ETF | 0,02 | 0,00 | 1,32 | 10,86 | 0,9786 | 0,0201 | |||
| CSCO / Cisco Systems, Inc. | 0,02 | 0,00 | 1,30 | 12,44 | 0,9675 | 0,0334 | |||
| LH / Labcorp Holdings Inc. | 0,00 | 0,00 | 1,28 | 12,79 | 0,9508 | 0,0358 | |||
| SLB / Schlumberger Limited | 0,04 | 22,38 | 1,26 | -1,10 | 0,9338 | -0,0905 | |||
| BAC / Bank of America Corporation | 0,02 | 0,00 | 1,16 | 13,38 | 0,8632 | 0,0369 | |||
| CNH / CNH Industrial N.V. | 0,09 | 0,00 | 1,16 | 5,55 | 0,8619 | -0,0245 | |||
| EA / Electronic Arts Inc. | 0,01 | 0,00 | 1,14 | 10,48 | 0,8465 | 0,0150 | |||
| HOLX / Hologic, Inc. | 0,02 | 12,30 | 1,13 | 18,45 | 0,8397 | 0,0703 | |||
| CNC / Centene Corporation | 0,02 | -0,92 | 1,11 | -11,42 | 0,8243 | -0,1857 | |||
| STM / STMicroelectronics N.V. - Depositary Receipt (Common Stock) | 0,04 | -32,97 | 1,07 | -7,21 | 0,7940 | -0,1345 | |||
| IWM / iShares Trust - iShares Russell 2000 ETF | 0,00 | 138,02 | 1,07 | 157,87 | 0,7918 | 0,4580 | |||
| HAL / Halliburton Company | 0,05 | 11,46 | 1,06 | -10,47 | 0,7876 | -0,1672 | |||
| PHM / PulteGroup, Inc. | 0,01 | 0,00 | 1,05 | 2,53 | 0,7835 | -0,0455 | |||
| NSC / Norfolk Southern Corporation | 0,00 | 0,00 | 1,02 | 8,07 | 0,7569 | -0,0033 | |||
| BRKR / Bruker Corporation | 0,02 | 2,25 | 0,92 | 0,88 | 0,6809 | -0,0514 | |||
| APTV / Aptiv PLC | 0,01 | 0,00 | 0,91 | 14,70 | 0,6728 | 0,0359 | |||
| VOO / Vanguard Index Funds - Vanguard S&P 500 ETF | 0,00 | 1,14 | 0,90 | 11,74 | 0,6723 | 0,0195 | |||
| FTS / Fortis Inc. | 0,02 | 0,00 | 0,90 | 4,78 | 0,6672 | -0,0244 | |||
| JCI / Johnson Controls International plc | 0,01 | -19,18 | 0,89 | 6,47 | 0,6611 | -0,0124 | |||
| KR / The Kroger Co. | 0,01 | -9,34 | 0,84 | -3,91 | 0,6208 | -0,0806 | |||
| ITT / ITT Inc. | 0,01 | 0,00 | 0,83 | 21,32 | 0,6134 | 0,0651 | |||
| GEHC / GE HealthCare Technologies Inc. | 0,01 | 19,78 | 0,81 | 9,95 | 0,5998 | 0,0075 | |||
| NBIX / Neurocrine Biosciences, Inc. | 0,01 | 40,91 | 0,78 | 60,29 | 0,5790 | 0,1865 | |||
| MRVL / Marvell Technology, Inc. | 0,01 | 0,74 | 0,5520 | 0,5520 | |||||
| MRK / Merck & Co., Inc. | 0,01 | 0,00 | 0,74 | -11,77 | 0,5515 | -0,1273 | |||
| MKSI / MKS Inc. | 0,01 | -1,33 | 0,74 | 22,30 | 0,5463 | 0,0615 | |||
| DG / Dollar General Corporation | 0,01 | 48,84 | 0,73 | 93,65 | 0,5439 | 0,2390 | |||
| CAH / Cardinal Health, Inc. | 0,00 | 0,00 | 0,73 | 21,87 | 0,5429 | 0,0597 | |||
| LEVI / Levi Strauss & Co. | 0,04 | 15,59 | 0,73 | 36,98 | 0,5399 | 0,1124 | |||
| EME / EMCOR Group, Inc. | 0,00 | 68,75 | 0,72 | 144,75 | 0,5365 | 0,2980 | |||
| MDB / MongoDB, Inc. | 0,00 | 21,43 | 0,71 | 45,21 | 0,5304 | 0,1344 | |||
| ALGN / Align Technology, Inc. | 0,00 | 0,00 | 0,70 | 19,25 | 0,5204 | 0,0465 | |||
| NXPI / NXP Semiconductors N.V. | 0,00 | 0,00 | 0,69 | 15,00 | 0,5129 | 0,0286 | |||
| INGR / Ingredion Incorporated | 0,00 | 0,00 | 0,67 | 0,30 | 0,4952 | -0,0407 | |||
| DV / DoubleVerify Holdings, Inc. | 0,04 | 10,41 | 0,65 | 23,76 | 0,4838 | 0,0590 | |||
| KEX / Kirby Corporation | 0,01 | 0,00 | 0,65 | 12,33 | 0,4811 | 0,0160 | |||
| PATH / UiPath Inc. | 0,05 | 19,05 | 0,64 | 48,15 | 0,4755 | 0,1266 | |||
| ASO / Academy Sports and Outdoors, Inc. | 0,01 | 16,53 | 0,63 | 14,52 | 0,4694 | 0,0244 | |||
| CCK / Crown Holdings, Inc. | 0,01 | -16,44 | 0,63 | -3,53 | 0,4667 | -0,0588 | |||
| HUM / Humana Inc. | 0,00 | 20,95 | 0,62 | 11,71 | 0,4613 | 0,0133 | |||
| LMT / Lockheed Martin Corporation | 0,00 | -18,52 | 0,61 | -15,49 | 0,4542 | -0,1294 | |||
| XOM / Exxon Mobil Corporation | 0,01 | -1,31 | 0,61 | -10,57 | 0,4529 | -0,0966 | |||
| CTRA / Coterra Energy Inc. | 0,02 | 27,66 | 0,61 | 12,15 | 0,4525 | 0,0144 | |||
| GTLB / GitLab Inc. | 0,01 | 47,54 | 0,61 | 41,40 | 0,4524 | 0,1056 | |||
| MDT / Medtronic plc | 0,01 | -19,55 | 0,61 | -21,91 | 0,4504 | -0,1760 | |||
| JBHT / J.B. Hunt Transport Services, Inc. | 0,00 | 0,00 | 0,60 | -2,90 | 0,4481 | -0,0530 | |||
| CFLT / Confluent, Inc. | 0,02 | 28,34 | 0,60 | 36,53 | 0,4445 | 0,0910 | |||
| DUK / Duke Energy Corporation | 0,00 | 0,00 | 0,58 | -3,33 | 0,4322 | -0,0527 | |||
| NDSN / Nordson Corporation | 0,00 | 68,75 | 0,58 | 79,50 | 0,4300 | 0,1697 | |||
| BILL / BILL Holdings, Inc. | 0,01 | 0,00 | 0,57 | 0,71 | 0,4227 | -0,0324 | |||
| SOLV / Solventum Corporation | 0,01 | -16,67 | 0,57 | -16,96 | 0,4226 | -0,1293 | |||
| C / Citigroup Inc. | 0,01 | 0,00 | 0,56 | 19,87 | 0,4174 | 0,0395 | |||
| MMS / Maximus, Inc. | 0,01 | -13,04 | 0,56 | -10,53 | 0,4172 | -0,0887 | |||
| WRB / W. R. Berkley Corporation | 0,01 | -19,15 | 0,56 | -16,47 | 0,4148 | -0,1246 | |||
| LHX / L3Harris Technologies, Inc. | 0,00 | 0,00 | 0,55 | 19,78 | 0,4100 | 0,0387 | |||
| MOH / Molina Healthcare, Inc. | 0,00 | 0,00 | 0,55 | -9,52 | 0,4094 | -0,0820 | |||
| ORCL / Oracle Corporation | 0,00 | 0,00 | 0,55 | 56,45 | 0,4061 | 0,1242 | |||
| CPB / The Campbell's Company | 0,02 | -43,74 | 0,53 | -56,85 | 0,3959 | -0,5989 | |||
| FROG / JFrog Ltd. | 0,01 | -30,86 | 0,53 | -5,36 | 0,3945 | -0,0571 | |||
| S / SentinelOne, Inc. | 0,03 | 16,94 | 0,52 | 17,77 | 0,3843 | 0,0296 | |||
| TFC / Truist Financial Corporation | 0,01 | 0,00 | 0,52 | 4,46 | 0,3833 | -0,0149 | |||
| TGT / Target Corporation | 0,01 | 0,50 | 0,3730 | 0,3730 | |||||
| VUSB / Vanguard Bond Index Funds - Vanguard Ultra-Short Bond ETF | 0,01 | 0,50 | 0,3705 | 0,3705 | |||||
| DIOD / Diodes Incorporated | 0,01 | 0,00 | 0,50 | 22,72 | 0,3694 | 0,0421 | |||
| HUBB / Hubbell Incorporated | 0,00 | 0,49 | 0,3641 | 0,3641 | |||||
| VOYA / Voya Financial, Inc. | 0,01 | 0,49 | 0,3640 | 0,3640 | |||||
| VRT / Vertiv Holdings Co | 0,00 | 0,49 | 0,3620 | 0,3620 | |||||
| CFR / Cullen/Frost Bankers, Inc. | 0,00 | 0,00 | 0,48 | 2,59 | 0,3533 | -0,0202 | |||
| VGSH / Vanguard Scottsdale Funds - Vanguard Short-Term Treasury ETF | 0,01 | 14,29 | 0,47 | 14,63 | 0,3494 | 0,0181 | |||
| KNX / Knight-Swift Transportation Holdings Inc. | 0,01 | 0,46 | 0,3450 | 0,3450 | |||||
| CSX / CSX Corporation | 0,01 | 0,46 | 0,3442 | 0,3442 | |||||
| COP / ConocoPhillips | 0,01 | 0,00 | 0,45 | -14,67 | 0,3334 | -0,0901 | |||
| TKR / The Timken Company | 0,01 | 0,44 | 0,3288 | 0,3288 | |||||
| UNH / UnitedHealth Group Incorporated | 0,00 | 0,00 | 0,42 | -40,48 | 0,3141 | -0,2582 | |||
| EXPE / Expedia Group, Inc. | 0,00 | 0,42 | 0,3133 | 0,3133 | |||||
| CPNG / Coupang, Inc. | 0,01 | 0,42 | 0,3094 | 0,3094 | |||||
| FITB / Fifth Third Bancorp | 0,01 | 0,00 | 0,41 | 4,85 | 0,3056 | -0,0105 | |||
| BLD / TopBuild Corp. | 0,00 | 0,00 | 0,40 | 6,04 | 0,3006 | -0,0067 | |||
| VIOG / Vanguard Admiral Funds - Vanguard S&P Small-Cap 600 Growth ETF | 0,00 | 0,40 | 0,2975 | 0,2975 | |||||
| GOOGL / Alphabet Inc. | 0,00 | 0,40 | 0,2946 | 0,2946 | |||||
| TRMB / Trimble Inc. | 0,01 | 0,39 | 0,2879 | 0,2879 | |||||
| TTD / The Trade Desk, Inc. | 0,01 | 0,00 | 0,37 | 31,69 | 0,2781 | 0,0487 | |||
| NVCR / NovoCure Limited | 0,02 | 0,37 | 0,2777 | 0,2777 | |||||
| DGX / Quest Diagnostics Incorporated | 0,00 | -56,60 | 0,35 | -53,94 | 0,2609 | -0,3538 | |||
| VC / Visteon Corporation | 0,00 | -50,00 | 0,35 | -40,03 | 0,2599 | -0,2095 | |||
| GMED / Globus Medical, Inc. | 0,01 | 0,34 | 0,2499 | 0,2499 | |||||
| VMI / Valmont Industries, Inc. | 0,00 | 0,00 | 0,33 | 14,39 | 0,2426 | 0,0125 | |||
| MUSA / Murphy USA Inc. | 0,00 | 0,33 | 0,2418 | 0,2418 | |||||
| AMP / Ameriprise Financial, Inc. | 0,00 | 0,00 | 0,31 | 10,25 | 0,2324 | 0,0036 | |||
| DECK / Deckers Outdoor Corporation | 0,00 | 0,00 | 0,29 | -7,99 | 0,2144 | -0,0381 | |||
| MSCI / MSCI Inc. | 0,00 | 0,29 | 0,2142 | 0,2142 | |||||
| WFC / Wells Fargo & Company | 0,00 | 0,00 | 0,26 | 11,86 | 0,1964 | 0,0054 | |||
| LULU / lululemon athletica inc. | 0,00 | 0,26 | 0,1942 | 0,1942 | |||||
| PCTY / Paylocity Holding Corporation | 0,00 | -64,74 | 0,25 | -65,95 | 0,1891 | -0,4129 | |||
| ELV / Elevance Health, Inc. | 0,00 | 0,00 | 0,24 | -10,33 | 0,1806 | -0,0386 | |||
| VVV / Valvoline Inc. | 0,01 | 0,22 | 0,1604 | 0,1604 | |||||
| CB / Chubb Limited | 0,00 | 0,00 | 0,21 | -4,11 | 0,1567 | -0,0206 | |||
| US91332UAB70 / CONVERTIBLE ZERO | 0,19 | 0,54 | 0,1383 | -0,0109 | |||||
| US20717MAB90 / CONVERTIBLE ZERO | 0,09 | 0,00 | 0,0685 | -0,0059 | |||||
| US29786AAN63 / CONV. NOTE | 0,09 | 1,19 | 0,0637 | -0,0048 | |||||
| PBH / Prestige Consumer Healthcare Inc. | 0,00 | -100,00 | 0,00 | 0,0000 | |||||
| WTW / Willis Towers Watson Public Limited Company | 0,00 | -100,00 | 0,00 | 0,0000 | |||||
| IPGP / IPG Photonics Corporation | 0,00 | -100,00 | 0,00 | 0,0000 | |||||
| WY / Weyerhaeuser Company | 0,00 | -100,00 | 0,00 | 0,0000 | |||||
| SNOW / Snowflake Inc. | 0,00 | -100,00 | 0,00 | -100,00 | -0,3713 | ||||
| HALO / Halozyme Therapeutics, Inc. | 0,00 | -100,00 | 0,00 | 0,0000 | |||||
| BABA / Alibaba Group Holding Limited - Depositary Receipt (Common Stock) | 0,00 | -100,00 | 0,00 | 0,0000 | |||||
| FANG / Diamondback Energy, Inc. | 0,00 | -100,00 | 0,00 | 0,0000 | |||||
| U / Unity Software Inc. | 0,00 | -100,00 | 0,00 | 0,0000 | |||||
| LYFT / Lyft, Inc. | 0,00 | -100,00 | 0,00 | 0,0000 | |||||
| WH / Wyndham Hotels & Resorts, Inc. | 0,00 | -100,00 | 0,00 | -100,00 | -0,4525 | ||||
| TTWO / Take-Two Interactive Software, Inc. | 0,00 | -100,00 | 0,00 | 0,0000 | |||||
| LITE / Lumentum Holdings Inc. | 0,00 | -100,00 | 0,00 | 0,0000 |