Statistiques de base
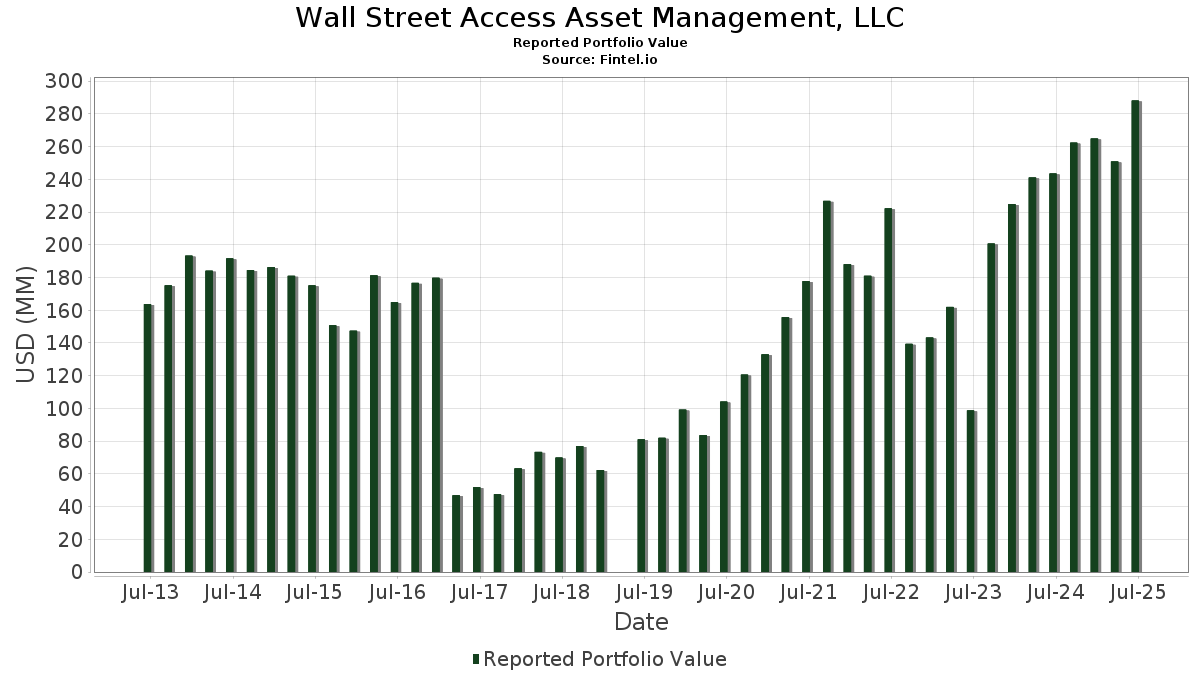
| Valeur du portefeuille | $ 288 165 447 |
| Positions actuelles | 138 |
Dernières positions, performances, ASG (à partir des dépôts 13F, 13D)
Wall Street Access Asset Management, LLC a déclaré un total de 138 positions dans ses derniers dépôts auprès de la SEC. La valeur la plus récente du portefeuille est calculée à 288 165 447 USD. Les actifs sous gestion réels (ASG) sont cette valeur plus les liquidités (qui ne sont pas divulguées). Les principales positions de Wall Street Access Asset Management, LLC sont iShares Trust - iShares Core S&P 500 ETF (US:IVV) , Berkshire Hathaway Inc. (US:BRK.A) , Microsoft Corporation (US:MSFT) , Apple Inc. (US:AAPL) , and Amazon.com, Inc. (US:AMZN) . Les nouvelles positions de Wall Street Access Asset Management, LLC incluent Honeywell International Inc. (US:HON) , Rocket Companies, Inc. (US:RKT) , AstraZeneca PLC - Depositary Receipt (Common Stock) (US:AZN) , .
Meilleures augmentations ce trimestre
Nous utilisons la variation de l'allocation du portefeuille car il s'agit de l'indicateur le plus significatif. Les changements peuvent être dus à des transactions ou à des variations de prix des actions.
| Titre | Actions (en millions) |
Valeur ($ en millions) |
% du portefeuille | ΔPortefeuille % |
|---|---|---|---|---|
| 0,04 | 19,63 | 6,8116 | 1,1419 | |
| 0,00 | 41,54 | 14,4159 | 0,7331 | |
| 0,01 | 9,22 | 3,2008 | 0,3830 | |
| 0,01 | 2,70 | 0,9367 | 0,2773 | |
| 0,01 | 2,17 | 0,7528 | 0,2064 | |
| 0,01 | 0,59 | 0,2051 | 0,2051 | |
| 0,00 | 0,52 | 0,1809 | 0,1809 | |
| 0,00 | 0,51 | 0,1754 | 0,1754 | |
| 0,02 | 1,32 | 0,4584 | 0,1665 | |
| 0,00 | 0,43 | 0,1493 | 0,1493 |
Principales baisses ce trimestre
Nous utilisons la variation de l'allocation du portefeuille car il s'agit de l'indicateur le plus significatif. Les changements peuvent être dus à des transactions ou à des variations de prix des actions.
| Titre | Actions (en millions) |
Valeur ($ en millions) |
% du portefeuille | ΔPortefeuille % |
|---|---|---|---|---|
| 0,02 | 11,42 | 3,9643 | -1,3597 | |
| 0,06 | 12,66 | 4,3924 | -0,9910 | |
| 0,04 | 4,66 | 1,6178 | -0,4669 | |
| 0,02 | 2,69 | 0,9351 | -0,2150 | |
| 0,08 | 46,74 | 16,2190 | -0,1948 | |
| 0,01 | 1,08 | 0,3738 | -0,1667 | |
| 0,01 | 4,14 | 1,4363 | -0,1355 | |
| 0,00 | 0,85 | 0,2963 | -0,1338 | |
| 0,00 | 0,22 | 0,0760 | -0,1099 | |
| 0,00 | 0,30 | 0,1032 | -0,1073 |
Déclarations 13F et dépôts de fonds
Ce formulaire a été déposé le 2025-08-08 pour la période de déclaration 2025-06-30. Cliquez sur l'icône du lien pour voir l'historique complet des transactions.
Mettre à niveau pour débloquer les données premium et exporter vers Excel ![]() .
.
| Titre | Type | Prix moyen de l'action | Actions (en millions) |
ΔActions (%) |
ΔActions (%) |
Valeur ($ en millions) |
Portefeuille (%) |
ΔPortefeuille (%) |
|
|---|---|---|---|---|---|---|---|---|---|
| IVV / iShares Trust - iShares Core S&P 500 ETF | 0,08 | 2,70 | 46,74 | 13,48 | 16,2190 | -0,1948 | |||
| BRK.A / Berkshire Hathaway Inc. | 0,00 | 32,56 | 41,54 | 21,00 | 14,4159 | 0,7331 | |||
| MSFT / Microsoft Corporation | 0,04 | 4,13 | 19,63 | 37,97 | 6,8116 | 1,1419 | |||
| AAPL / Apple Inc. | 0,06 | 1,45 | 12,66 | -6,30 | 4,3924 | -0,9910 | |||
| AMZN / Amazon.com, Inc. | 0,05 | 1,87 | 11,82 | 17,47 | 4,1006 | 0,0914 | |||
| BRK.A / Berkshire Hathaway Inc. | 0,02 | -6,25 | 11,42 | -14,49 | 3,9643 | -1,3597 | |||
| GOOG / Alphabet Inc. | 0,06 | 3,60 | 10,76 | 17,63 | 3,7332 | 0,0883 | |||
| META / Meta Platforms, Inc. | 0,01 | 1,87 | 9,22 | 30,45 | 3,2008 | 0,3830 | |||
| VTV / Vanguard Index Funds - Vanguard Value ETF | 0,03 | 14,13 | 5,74 | 16,77 | 1,9910 | 0,0329 | |||
| VUG / Vanguard Index Funds - Vanguard Growth ETF | 0,01 | 1,51 | 5,23 | 20,02 | 1,8160 | 0,0782 | |||
| BRO / Brown & Brown, Inc. | 0,04 | 0,00 | 4,66 | -10,88 | 1,6178 | -0,4669 | |||
| DIA / SPDR Dow Jones Industrial Average ETF Trust | 0,01 | 0,00 | 4,14 | 4,97 | 1,4363 | -0,1355 | |||
| RSP / Invesco Exchange-Traded Fund Trust - Invesco S&P 500 Equal Weight ETF | 0,02 | 18,23 | 3,93 | 24,03 | 1,3651 | 0,1013 | |||
| VIG / Vanguard Specialized Funds - Vanguard Dividend Appreciation ETF | 0,02 | 5,96 | 3,82 | 11,79 | 1,3264 | -0,0362 | |||
| QQQ / Invesco QQQ Trust, Series 1 | 0,01 | 8,46 | 3,59 | 27,61 | 1,2449 | 0,1243 | |||
| GOOGL / Alphabet Inc. | 0,02 | -0,56 | 3,17 | 13,32 | 1,0986 | -0,0148 | |||
| DFAS / Dimensional ETF Trust - Dimensional U.S. Small Cap ETF | 0,05 | 2,43 | 3,11 | 9,24 | 1,0793 | -0,0555 | |||
| SHV / iShares Trust - iShares Short Treasury Bond ETF | 0,03 | 28,75 | 3,02 | 28,73 | 1,0482 | 0,1129 | |||
| SPY / SPDR S&P 500 ETF | 0,00 | 1,61 | 2,92 | 12,23 | 1,0129 | -0,0236 | |||
| VB / Vanguard Index Funds - Vanguard Small-Cap ETF | 0,01 | 0,52 | 2,82 | 7,40 | 0,9779 | -0,0676 | |||
| JPM / JPMorgan Chase & Co. | 0,01 | 38,04 | 2,70 | 63,18 | 0,9367 | 0,2773 | |||
| BLDR / Builders FirstSource, Inc. | 0,02 | -0,03 | 2,69 | -6,62 | 0,9351 | -0,2150 | |||
| NVDA / NVIDIA Corporation | 0,01 | 8,55 | 2,17 | 58,32 | 0,7528 | 0,2064 | |||
| ABBV / AbbVie Inc. | 0,01 | 15,64 | 2,14 | 2,49 | 0,7420 | -0,0897 | |||
| VO / Vanguard Index Funds - Vanguard Mid-Cap ETF | 0,01 | 3,08 | 1,86 | 11,53 | 0,6445 | -0,0192 | |||
| BAC / Bank of America Corporation | 0,04 | 6,43 | 1,77 | 20,63 | 0,6153 | 0,0298 | |||
| UBER / Uber Technologies, Inc. | 0,02 | 1,22 | 1,71 | 29,66 | 0,5918 | 0,0675 | |||
| JGRW / Trust For Professional Managers - Jensen Quality Growth ETF | 0,06 | 17,81 | 1,70 | 22,62 | 0,5892 | 0,0373 | |||
| ET / Energy Transfer LP - Limited Partnership | 0,09 | 0,00 | 1,57 | -2,48 | 0,5452 | -0,0968 | |||
| APO / Apollo Global Management, Inc. | 0,01 | -0,33 | 1,52 | 3,25 | 0,5291 | -0,0594 | |||
| JNJ / Johnson & Johnson | 0,01 | 25,78 | 1,51 | 15,85 | 0,5229 | 0,0046 | |||
| NKE / NIKE, Inc. | 0,02 | -0,73 | 1,35 | 11,10 | 0,4691 | -0,0158 | |||
| CCJ / Cameco Corporation | 0,02 | 0,00 | 1,32 | 80,33 | 0,4584 | 0,1665 | |||
| GLD / SPDR Gold Trust | 0,00 | 0,00 | 1,31 | 5,74 | 0,4545 | -0,0389 | |||
| GSCE / GS Connect S&P GSCI Enhanced Commodity Total Return ETN | 0,00 | -0,33 | 1,28 | 29,16 | 0,4444 | 0,0493 | |||
| TSLA / Tesla, Inc. | 0,00 | -1,07 | 1,26 | 21,33 | 0,4363 | 0,0231 | |||
| CSCO / Cisco Systems, Inc. | 0,02 | 34,71 | 1,20 | 51,39 | 0,4173 | 0,1009 | |||
| XOM / Exxon Mobil Corporation | 0,01 | 5,78 | 1,18 | -4,13 | 0,4107 | -0,0812 | |||
| PFE / Pfizer Inc. | 0,04 | 11,99 | 1,09 | 7,11 | 0,3768 | -0,0271 | |||
| BABA / Alibaba Group Holding Limited - Depositary Receipt (Common Stock) | 0,01 | -7,40 | 1,08 | -20,58 | 0,3738 | -0,1667 | |||
| VZ / Verizon Communications Inc. | 0,02 | 5,44 | 1,02 | 0,69 | 0,3555 | -0,0499 | |||
| SCHG / Schwab Strategic Trust - Schwab U.S. Large-Cap Growth ETF | 0,03 | 0,00 | 1,01 | 16,69 | 0,3519 | 0,0055 | |||
| BR / Broadridge Financial Solutions, Inc. | 0,00 | -2,20 | 0,97 | -1,92 | 0,3378 | -0,0579 | |||
| VNQ / Vanguard Specialized Funds - Vanguard Real Estate ETF | 0,01 | 9,72 | 0,97 | 7,94 | 0,3351 | -0,0215 | |||
| MCD / McDonald's Corporation | 0,00 | -0,93 | 0,93 | -7,38 | 0,3226 | -0,0772 | |||
| GILD / Gilead Sciences, Inc. | 0,01 | 0,22 | 0,90 | -0,89 | 0,3109 | -0,0492 | |||
| GJR / Strats Trust For Procter & Gambel Security - Preferred Security | 0,01 | 74,21 | 0,89 | 63,07 | 0,3096 | 0,0913 | |||
| PEP / PepsiCo, Inc. | 0,01 | 7,03 | 0,89 | -5,71 | 0,3092 | -0,0676 | |||
| VTI / Vanguard Index Funds - Vanguard Total Stock Market ETF | 0,00 | -28,45 | 0,85 | -20,95 | 0,2963 | -0,1338 | |||
| XLE / The Select Sector SPDR Trust - The Energy Select Sector SPDR Fund | 0,01 | 0,00 | 0,85 | -9,32 | 0,2939 | -0,0780 | |||
| CVNA / Carvana Co. | 0,00 | 0,00 | 0,84 | 61,30 | 0,2923 | 0,0840 | |||
| IBM / International Business Machines Corporation | 0,00 | 12,00 | 0,83 | 32,85 | 0,2864 | 0,0387 | |||
| MRK / Merck & Co., Inc. | 0,01 | 60,15 | 0,82 | 41,25 | 0,2831 | 0,0529 | |||
| SCHV / Schwab Strategic Trust - Schwab U.S. Large-Cap Value ETF | 0,03 | 0,00 | 0,81 | 4,12 | 0,2806 | -0,0290 | |||
| T / AT&T Inc. | 0,03 | 11,27 | 0,77 | 13,97 | 0,2664 | -0,0019 | |||
| BA / The Boeing Company | 0,00 | 88,71 | 0,76 | 131,91 | 0,2650 | 0,1337 | |||
| AMGN / Amgen Inc. | 0,00 | 0,58 | 0,73 | -9,81 | 0,2520 | -0,0691 | |||
| JAAA / Janus Detroit Street Trust - Janus Henderson AAA CLO ETF | 0,01 | 33,18 | 0,68 | 33,33 | 0,2375 | 0,0329 | |||
| V / Visa Inc. | 0,00 | -0,10 | 0,68 | 1,34 | 0,2367 | -0,0319 | |||
| FWONA / Formula One Group | 0,01 | 0,00 | 0,68 | 16,04 | 0,2363 | 0,0026 | |||
| UNH / UnitedHealth Group Incorporated | 0,00 | 73,44 | 0,68 | 3,35 | 0,2354 | -0,0262 | |||
| DD / DuPont de Nemours, Inc. | 0,01 | 0,21 | 0,67 | -8,06 | 0,2339 | -0,0580 | |||
| GBTC / Grayscale Bitcoin Trust (BTC) | 0,01 | 0,00 | 0,67 | 30,08 | 0,2314 | 0,0272 | |||
| AVGO / Broadcom Inc. | 0,00 | 72,22 | 0,64 | 183,19 | 0,2224 | 0,1323 | |||
| VHT / Vanguard World Fund - Vanguard Health Care ETF | 0,00 | -13,98 | 0,62 | -19,27 | 0,2153 | -0,0911 | |||
| C / Citigroup Inc. | 0,01 | 0,01 | 0,61 | 19,96 | 0,2107 | 0,0089 | |||
| PPG / PPG Industries, Inc. | 0,01 | 0,59 | 0,2051 | 0,2051 | |||||
| VEA / Vanguard Tax-Managed Funds - Vanguard FTSE Developed Markets ETF | 0,01 | 0,00 | 0,59 | 12,17 | 0,2051 | -0,0049 | |||
| GE / General Electric Company | 0,00 | 0,00 | 0,59 | 28,60 | 0,2047 | 0,0219 | |||
| KO / The Coca-Cola Company | 0,01 | -3,77 | 0,59 | -5,01 | 0,2043 | -0,0425 | |||
| COST / Costco Wholesale Corporation | 0,00 | 0,00 | 0,56 | 4,72 | 0,1927 | -0,0187 | |||
| TIP / iShares Trust - iShares TIPS Bond ETF | 0,00 | 0,00 | 0,55 | -0,90 | 0,1906 | -0,0304 | |||
| SCHD / Schwab Strategic Trust - Schwab U.S. Dividend Equity ETF | 0,02 | 0,34 | 0,54 | -4,90 | 0,1887 | -0,0392 | |||
| VST / Vistra Corp. | 0,00 | 21,81 | 0,54 | 100,75 | 0,1863 | 0,0799 | |||
| VXUS / Vanguard STAR Funds - Vanguard Total International Stock ETF | 0,01 | 0,00 | 0,53 | 11,27 | 0,1851 | -0,0060 | |||
| TXN / Texas Instruments Incorporated | 0,00 | 0,52 | 0,1809 | 0,1809 | |||||
| IJH / iShares Trust - iShares Core S&P Mid-Cap ETF | 0,01 | 0,00 | 0,51 | 6,47 | 0,1770 | -0,0142 | |||
| VOO / Vanguard Index Funds - Vanguard S&P 500 ETF | 0,00 | 0,51 | 0,1754 | 0,1754 | |||||
| LENZ / LENZ Therapeutics, Inc. | 0,02 | 0,00 | 0,50 | 13,96 | 0,1731 | -0,0013 | |||
| PANW / Palo Alto Networks, Inc. | 0,00 | 18,04 | 0,46 | 41,61 | 0,1584 | 0,0299 | |||
| FLR / Fluor Corporation | 0,01 | 0,00 | 0,45 | 43,27 | 0,1554 | 0,0307 | |||
| OBDC / Blue Owl Capital Corporation | 0,03 | 1,13 | 0,44 | -0,89 | 0,1542 | -0,0247 | |||
| GD / General Dynamics Corporation | 0,00 | -0,39 | 0,44 | 6,75 | 0,1537 | -0,0119 | |||
| ADP / Automatic Data Processing, Inc. | 0,00 | -5,30 | 0,44 | -4,56 | 0,1530 | -0,0308 | |||
| HLT / Hilton Worldwide Holdings Inc. | 0,00 | -1,26 | 0,44 | 15,53 | 0,1525 | 0,0010 | |||
| ABT / Abbott Laboratories | 0,00 | -2,93 | 0,44 | -0,46 | 0,1514 | -0,0233 | |||
| IDXX / IDEXX Laboratories, Inc. | 0,00 | 0,00 | 0,43 | 27,73 | 0,1503 | 0,0151 | |||
| ETN / Eaton Corporation plc | 0,00 | 0,43 | 0,1493 | 0,1493 | |||||
| HON / Honeywell International Inc. | 0,00 | 0,43 | 0,1489 | 0,1489 | |||||
| SYK / Stryker Corporation | 0,00 | -7,68 | 0,43 | -1,83 | 0,1486 | -0,0253 | |||
| RTX / RTX Corporation | 0,00 | 35,38 | 0,42 | 49,64 | 0,1454 | 0,0335 | |||
| QCOM / QUALCOMM Incorporated | 0,00 | 0,00 | 0,41 | 3,78 | 0,1430 | -0,0154 | |||
| CAT / Caterpillar Inc. | 0,00 | -0,09 | 0,41 | 17,53 | 0,1422 | 0,0033 | |||
| GBDC / Golub Capital BDC, Inc. | 0,03 | 1,12 | 0,41 | -1,93 | 0,1414 | -0,0243 | |||
| BP / BP p.l.c. - Depositary Receipt (Common Stock) | 0,01 | 1,70 | 0,40 | -10,04 | 0,1401 | -0,0385 | |||
| DIS / The Walt Disney Company | 0,00 | -32,67 | 0,40 | -15,42 | 0,1371 | -0,0491 | |||
| MMC / Marsh & McLennan Companies, Inc. | 0,00 | 0,39 | 0,1348 | 0,1348 | |||||
| LLY / Eli Lilly and Company | 0,00 | 0,00 | 0,36 | -5,71 | 0,1262 | -0,0274 | |||
| MMM / 3M Company | 0,00 | 0,00 | 0,36 | 3,72 | 0,1259 | -0,0136 | |||
| NFBK / Northfield Bancorp, Inc. (Staten Island, NY) | 0,03 | 0,00 | 0,36 | 5,23 | 0,1259 | -0,0115 | |||
| AVY / Avery Dennison Corporation | 0,00 | 0,36 | 0,1234 | 0,1234 | |||||
| CTVA / Corteva, Inc. | 0,00 | 0,00 | 0,33 | 18,35 | 0,1144 | 0,0035 | |||
| BHP / BHP Group Limited - Depositary Receipt (Common Stock) | 0,01 | 1,47 | 0,31 | 0,64 | 0,1092 | -0,0155 | |||
| RKT / Rocket Companies, Inc. | 0,02 | 0,31 | 0,1089 | 0,1089 | |||||
| NBIS / Nebius Group N.V. | 0,01 | 0,31 | 0,1083 | 0,1083 | |||||
| EXP / Eagle Materials Inc. | 0,00 | 0,30 | 0,1052 | 0,1052 | |||||
| SLRC / SLR Investment Corp. | 0,02 | 0,19 | 0,30 | -4,13 | 0,1050 | -0,0207 | |||
| DE / Deere & Company | 0,00 | 0,00 | 0,30 | 8,70 | 0,1041 | -0,0063 | |||
| AVUV / American Century ETF Trust - Avantis U.S. Small Cap Value ETF | 0,00 | -46,11 | 0,30 | -43,75 | 0,1032 | -0,1073 | |||
| SCHA / Schwab Strategic Trust - Schwab U.S. Small-Cap ETF | 0,01 | 0,00 | 0,29 | 8,15 | 0,1014 | -0,0064 | |||
| IWF / iShares Trust - iShares Russell 1000 Growth ETF | 0,00 | 0,00 | 0,29 | 17,48 | 0,1005 | 0,0023 | |||
| TGT / Target Corporation | 0,00 | -31,39 | 0,29 | -35,20 | 0,1004 | -0,0774 | |||
| BKNG / Booking Holdings Inc. | 0,00 | 0,00 | 0,28 | 25,78 | 0,0984 | 0,0085 | |||
| HUN / Huntsman Corporation | 0,03 | 5,71 | 0,28 | -30,17 | 0,0973 | -0,0629 | |||
| ORCL / Oracle Corporation | 0,00 | 0,28 | 0,0970 | 0,0970 | |||||
| HD / The Home Depot, Inc. | 0,00 | -3,22 | 0,26 | -3,30 | 0,0918 | -0,0171 | |||
| INTC / Intel Corporation | 0,01 | 11,81 | 0,25 | 10,43 | 0,0883 | -0,0037 | |||
| PGR / The Progressive Corporation | 0,00 | 0,00 | 0,25 | -5,60 | 0,0880 | -0,0192 | |||
| PHYL / PGIM ETF Trust - PGIM Active High Yield Bond ETF | 0,01 | -3,51 | 0,25 | 4,17 | 0,0871 | -0,0086 | |||
| ACN / Accenture plc | 0,00 | -12,63 | 0,25 | -16,22 | 0,0861 | -0,0321 | |||
| PM / Philip Morris International Inc. | 0,00 | -1,09 | 0,25 | 13,30 | 0,0859 | -0,0010 | |||
| DHR / Danaher Corporation | 0,00 | 0,24 | 0,0821 | 0,0821 | |||||
| HTGC / Hercules Capital, Inc. | 0,01 | 0,11 | 0,24 | -4,47 | 0,0816 | -0,0168 | |||
| CVX / Chevron Corporation | 0,00 | 32,79 | 0,23 | 13,24 | 0,0805 | -0,0008 | |||
| SCHM / Schwab Strategic Trust - Schwab U.S. Mid-Cap ETF | 0,01 | 0,00 | 0,23 | 7,01 | 0,0796 | -0,0058 | |||
| CMI / Cummins Inc. | 0,00 | 0,00 | 0,23 | 4,57 | 0,0796 | -0,0079 | |||
| DSU / BlackRock Debt Strategies Fund, Inc. | 0,02 | 2,43 | 0,22 | 3,76 | 0,0768 | -0,0082 | |||
| FDX / FedEx Corporation | 0,00 | -49,66 | 0,22 | -53,22 | 0,0760 | -0,1099 | |||
| TD / The Toronto-Dominion Bank | 0,00 | 0,21 | 0,0735 | 0,0735 | |||||
| TMO / Thermo Fisher Scientific Inc. | 0,00 | -0,95 | 0,21 | -19,16 | 0,0733 | -0,0310 | |||
| AZN / AstraZeneca PLC - Depositary Receipt (Common Stock) | 0,00 | 0,21 | 0,0731 | 0,0731 | |||||
| BMY / Bristol-Myers Squibb Company | 0,00 | 22,47 | 0,20 | -7,37 | 0,0700 | -0,0165 | |||
| DSL / DoubleLine Income Solutions Fund | 0,01 | 0,18 | 0,0622 | 0,0622 | |||||
| OCSL / Oaktree Specialty Lending Corporation | 0,01 | 1,55 | 0,17 | -9,68 | 0,0584 | -0,0159 | |||
| HIO / Western Asset High Income Opportunity Fund Inc. | 0,03 | 0,12 | 0,0433 | 0,0433 | |||||
| PCYO / Pure Cycle Corporation | 0,01 | 0,11 | 0,0372 | 0,0372 | |||||
| CLF / Cleveland-Cliffs Inc. | 0,01 | 0,00 | 0,08 | -7,69 | 0,0293 | -0,0071 | |||
| DCGO / DocGo Inc. | 0,01 | 0,00 | 0,02 | -40,00 | 0,0063 | -0,0059 | |||
| MNST / Monster Beverage Corporation | 0,00 | -100,00 | 0,00 | 0,0000 | |||||
| KVUE / Kenvue Inc. | 0,00 | -100,00 | 0,00 | 0,0000 | |||||
| HBI / Hanesbrands Inc. | 0,00 | -100,00 | 0,00 | 0,0000 | |||||
| ED / Consolidated Edison, Inc. | 0,00 | -100,00 | 0,00 | 0,0000 | |||||
| IQV / IQVIA Holdings Inc. | 0,00 | -100,00 | 0,00 | 0,0000 | |||||
| MA / Mastercard Incorporated | 0,00 | -100,00 | 0,00 | 0,0000 |