Statistiques de base
| Valeur du portefeuille | $ 1 113 698 699 |
| Positions actuelles | 69 |
Dernières positions, performances, ASG (à partir des dépôts 13F, 13D)
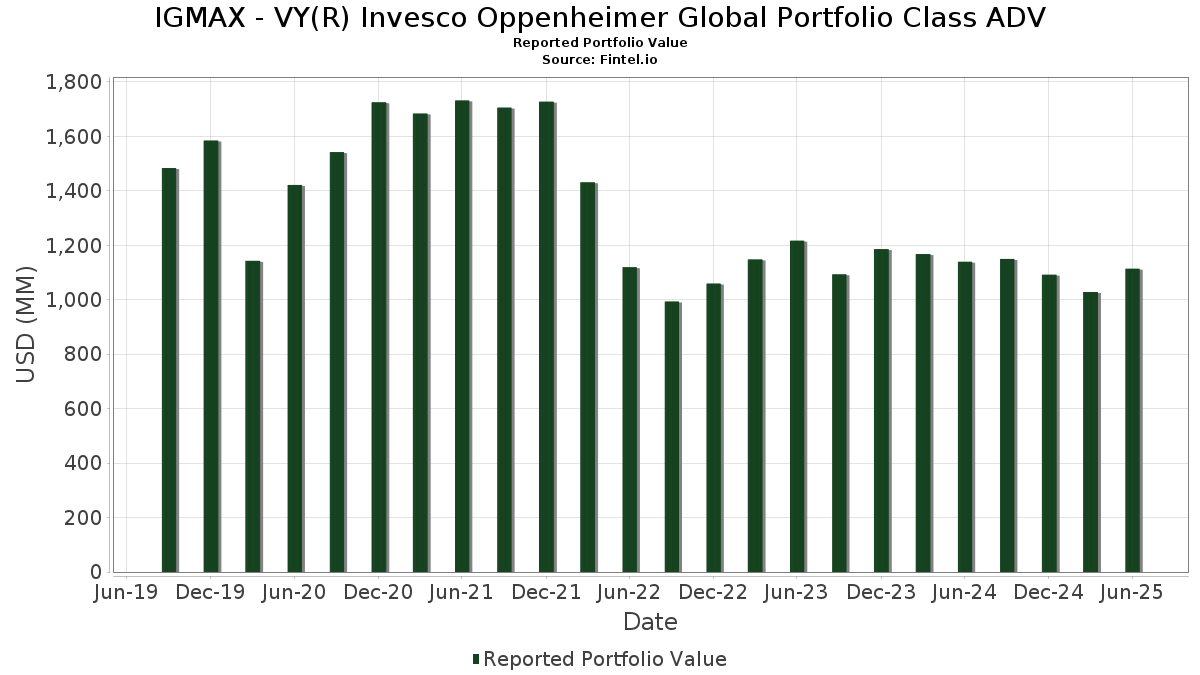
IGMAX - VY(R) Invesco Oppenheimer Global Portfolio Class ADV a déclaré un total de 69 positions dans ses derniers dépôts auprès de la SEC. La valeur la plus récente du portefeuille est calculée à 1 113 698 699 USD. Les actifs sous gestion réels (ASG) sont cette valeur plus les liquidités (qui ne sont pas divulguées). Les principales positions de IGMAX - VY(R) Invesco Oppenheimer Global Portfolio Class ADV sont Cisco Systems, Inc. (US:CSCO) , Robinhood Markets, Inc. (US:HOOD) , Microsoft Corporation (US:MSFT) , StandardAero, Inc. (US:SARO) , and Enel SpA (IT:ENEL) . Les nouvelles positions de IGMAX - VY(R) Invesco Oppenheimer Global Portfolio Class ADV incluent Robinhood Markets, Inc. (US:HOOD) , Siemens Energy AG (IT:ENR) , Spotify Technology S.A. (US:SPOT) , Sportradar Group AG (US:SRAD) , and Trip.com Group Limited (HK:9961) .
Meilleures augmentations ce trimestre
Nous utilisons la variation de l'allocation du portefeuille car il s'agit de l'indicateur le plus significatif. Les changements peuvent être dus à des transactions ou à des variations de prix des actions.
| Titre | Actions (en millions) |
Valeur ($ en millions) |
% du portefeuille | ΔPortefeuille % |
|---|---|---|---|---|
| 0,44 | 40,97 | 3,6266 | 3,6266 | |
| 0,26 | 30,95 | 2,7395 | 2,7395 | |
| 0,04 | 29,95 | 2,6505 | 2,6505 | |
| 0,89 | 25,09 | 2,2204 | 2,2204 | |
| 0,22 | 20,26 | 1,7936 | 1,7936 | |
| 0,07 | 32,97 | 2,9185 | 1,3916 | |
| 0,21 | 12,10 | 1,0709 | 1,0709 | |
| 0,06 | 11,05 | 0,9780 | 0,9780 | |
| 0,12 | 19,96 | 1,7663 | 0,7860 | |
| 0,09 | 11,46 | 1,0144 | 0,6298 |
Principales baisses ce trimestre
Nous utilisons la variation de l'allocation du portefeuille car il s'agit de l'indicateur le plus significatif. Les changements peuvent être dus à des transactions ou à des variations de prix des actions.
| Titre | Actions (en millions) |
Valeur ($ en millions) |
% du portefeuille | ΔPortefeuille % |
|---|---|---|---|---|
| 0,14 | 12,88 | 1,1400 | -2,9586 | |
| 0,39 | 11,36 | 1,0056 | -2,1079 | |
| 0,27 | 11,11 | 0,9836 | -1,8324 | |
| 1,57 | 1,57 | 0,1386 | -1,4420 | |
| 0,13 | 9,80 | 0,8678 | -0,9961 | |
| 0,36 | 20,38 | 1,8036 | -0,9918 | |
| 0,11 | 22,95 | 2,0310 | -0,9229 | |
| 0,03 | 7,82 | 0,6918 | -0,8378 | |
| 0,07 | 15,46 | 1,3687 | -0,8218 | |
| 0,16 | 15,86 | 1,4039 | -0,7518 |
Déclarations 13F et dépôts de fonds
Ce formulaire a été déposé le 2025-08-26 pour la période de déclaration 2025-06-30. Cliquez sur l'icône du lien pour voir l'historique complet des transactions.
Mettre à niveau pour débloquer les données premium et exporter vers Excel ![]() .
.
| Titre | Type | Prix moyen de l'action | Actions (en millions) |
ΔActions (%) |
ΔActions (%) |
Valeur ($ en millions) |
Portefeuille (%) |
ΔPortefeuille (%) |
|
|---|---|---|---|---|---|---|---|---|---|
| CSCO / Cisco Systems, Inc. | 0,73 | -2,32 | 50,31 | 9,82 | 4,4530 | 0,0289 | |||
| HOOD / Robinhood Markets, Inc. | 0,44 | 40,97 | 3,6266 | 3,6266 | |||||
| MSFT / Microsoft Corporation | 0,07 | 57,38 | 32,97 | 108,54 | 2,9185 | 1,3916 | |||
| SARO / StandardAero, Inc. | 0,99 | -8,40 | 31,18 | 8,82 | 2,7600 | -0,0071 | |||
| ENEL / Enel SpA | 3,27 | 0,97 | 31,06 | 18,21 | 2,7495 | 0,2118 | |||
| ENR / Siemens Energy AG | 0,26 | 30,95 | 2,7395 | 2,7395 | |||||
| 6758 / Sony Group Corporation | 1,16 | -15,66 | 30,04 | -13,33 | 2,6589 | -0,6884 | |||
| SPOT / Spotify Technology S.A. | 0,04 | 29,95 | 2,6505 | 2,6505 | |||||
| TSLA / Tesla, Inc. | 0,09 | 3,71 | 28,29 | 27,12 | 2,5038 | 0,3549 | |||
| DIS / The Walt Disney Company | 0,22 | 0,97 | 26,93 | 26,86 | 2,3836 | 0,3336 | |||
| WMT / Walmart Inc. | 0,27 | -8,38 | 25,93 | 2,04 | 2,2948 | -0,1588 | |||
| NVDA / NVIDIA Corporation | 0,16 | -12,48 | 25,79 | 27,58 | 2,2825 | 0,3305 | |||
| LSE N / London Stock Exchange Group plc | 0,17 | 0,97 | 25,38 | -0,58 | 2,2463 | -0,2189 | |||
| SRAD / Sportradar Group AG | 0,89 | 25,09 | 2,2204 | 2,2204 | |||||
| DE / Deere & Company | 0,05 | 17,97 | 23,37 | 27,81 | 2,0682 | 0,3027 | |||
| BAC / Bank of America Corporation | 0,49 | -11,62 | 23,08 | 0,22 | 2,0426 | -0,1810 | |||
| AAPL / Apple Inc. | 0,11 | -18,78 | 22,95 | -24,98 | 2,0310 | -0,9229 | |||
| BARC / Barclays PLC | 4,81 | 16,24 | 22,20 | 42,85 | 1,9652 | 0,4642 | |||
| BAS / Leverage Shares Plc - Corporate Bond/Note | 0,44 | -18,75 | 21,52 | -19,83 | 1,9049 | -0,6876 | |||
| CEG / Constellation Energy Corporation | 0,07 | -4,59 | 21,46 | 52,73 | 1,8992 | 0,5424 | |||
| FOXA / Fox Corporation | 0,36 | -28,90 | 20,38 | -29,61 | 1,8036 | -0,9918 | |||
| ALAB / Astera Labs, Inc. | 0,22 | 20,26 | 1,7936 | 1,7936 | |||||
| NTRA / Natera, Inc. | 0,12 | 64,56 | 19,96 | 96,60 | 1,7663 | 0,7860 | |||
| MMM / 3M Company | 0,13 | 0,96 | 19,60 | 4,66 | 1,7348 | -0,0736 | |||
| MARUTI / Maruti Suzuki India Limited | 0,12 | 0,96 | 17,83 | 8,71 | 1,5779 | -0,0056 | |||
| RKT / Reckitt Benckiser Group plc | 0,24 | 0,97 | 16,24 | 1,72 | 1,4377 | -0,1043 | |||
| FCX / Freeport-McMoRan Inc. | 0,37 | 0,97 | 16,02 | 15,61 | 1,4178 | 0,0798 | |||
| OTIS / Otis Worldwide Corporation | 0,16 | -25,95 | 15,86 | -28,94 | 1,4039 | -0,7518 | |||
| GOLF / Acushnet Holdings Corp. | 0,21 | 0,97 | 15,52 | 7,08 | 1,3735 | -0,0259 | |||
| MMC / Marsh & McLennan Companies, Inc. | 0,07 | -23,91 | 15,46 | -31,83 | 1,3687 | -0,8218 | |||
| RELIANCE / Reliance Industries Limited | 0,79 | 0,97 | 13,79 | 18,87 | 1,2205 | 0,1003 | |||
| GRMN / Garmin Ltd. | 0,06 | 0,96 | 13,39 | -2,95 | 1,1850 | -0,1472 | |||
| FSLR / First Solar, Inc. | 0,08 | 0,96 | 13,37 | 32,19 | 1,1836 | 0,2067 | |||
| MSTR / Strategy Inc | 0,03 | 9,86 | 13,22 | 54,05 | 1,1705 | 0,3415 | |||
| ZTS / Zoetis Inc. | 0,08 | 0,96 | 13,16 | -4,37 | 1,1645 | -0,1641 | |||
| BBCA / PT Bank Central Asia Tbk | 24,22 | 0,97 | 12,95 | 5,16 | 1,1462 | -0,0431 | |||
| WPM / Wheaton Precious Metals Corp. | 0,14 | -73,77 | 12,88 | -69,66 | 1,1400 | -2,9586 | |||
| HIA1 / Hitachi, Ltd. | 0,44 | 0,94 | 12,79 | 24,95 | 1,1316 | 0,1435 | |||
| BABA / Alibaba Group Holding Limited - Depositary Receipt (Common Stock) | 0,11 | 0,97 | 12,52 | -13,40 | 1,1081 | -0,2880 | |||
| 9961 / Trip.com Group Limited | 0,21 | 12,10 | 1,0709 | 1,0709 | |||||
| LONN / Lonza Group AG | 0,02 | -32,97 | 12,04 | -22,41 | 1,0654 | -0,4327 | |||
| VRT / Vertiv Holdings Co | 0,09 | 61,80 | 11,46 | 187,80 | 1,0144 | 0,6298 | |||
| T / AT&T Inc. | 0,39 | -65,57 | 11,36 | -64,76 | 1,0056 | -2,1079 | |||
| ROK / Rockwell Automation, Inc. | 0,03 | -36,86 | 11,25 | -18,83 | 0,9962 | -0,3428 | |||
| AD / Koninklijke Ahold Delhaize N.V. | 0,27 | -65,92 | 11,11 | -61,89 | 0,9836 | -1,8324 | |||
| ABBV / AbbVie Inc. | 0,06 | 11,05 | 0,9780 | 0,9780 | |||||
| SHEL / Shell plc | 0,30 | 0,97 | 10,49 | -3,22 | 0,9284 | -0,1183 | |||
| META / Meta Platforms, Inc. | 0,01 | -60,61 | 10,32 | -40,12 | 0,9136 | -0,5638 | |||
| PLD / Prologis, Inc. | 0,10 | -32,46 | 10,22 | -36,49 | 0,9047 | -0,6495 | |||
| HCA / HCA Healthcare, Inc. | 0,03 | 0,96 | 10,09 | 11,93 | 0,8933 | 0,0225 | |||
| COIN / Coinbase Global, Inc. | 0,03 | -30,99 | 9,90 | 40,43 | 0,8762 | 0,1955 | |||
| HOLN / Holcim AG | 0,13 | -26,39 | 9,80 | -49,21 | 0,8678 | -0,9961 | |||
| ARM / Arm Holdings plc - Depositary Receipt (Common Stock) | 0,06 | -25,45 | 9,64 | 12,90 | 0,8530 | 0,0287 | |||
| CNE100002CC3 / Shenzhen Envicool Technology Co Ltd | 2,30 | 30,00 | 9,52 | -0,70 | 0,8429 | -0,0832 | |||
| CTRA / Coterra Energy Inc. | 0,34 | -8,90 | 8,72 | -19,99 | 0,7722 | -0,2808 | |||
| GRAB / Grab Holdings Limited | 1,62 | 48,95 | 8,13 | 65,39 | 0,7198 | 0,2450 | |||
| CRM / Salesforce, Inc. | 0,03 | -51,44 | 7,82 | -50,66 | 0,6918 | -0,8378 | |||
| INSP / Inspire Medical Systems, Inc. | 0,06 | 0,96 | 7,58 | -17,75 | 0,6711 | -0,2190 | |||
| TRGP / Targa Resources Corp. | 0,04 | -11,00 | 7,49 | -22,72 | 0,6631 | -0,2730 | |||
| AMRZ / Amrize AG | 0,13 | 6,59 | 0,5829 | 0,5829 | |||||
| JOBY / Joby Aviation, Inc. | 0,62 | 15,57 | 6,52 | 102,55 | 0,5768 | 0,2661 | |||
| ASAN / Asana, Inc. | 0,48 | -23,70 | 6,48 | -29,32 | 0,5737 | -0,3117 | |||
| IDEXY / Industria de Diseño Textil, S.A. - Depositary Receipt (Common Stock) | 0,12 | 0,96 | 6,46 | 5,78 | 0,5713 | -0,0180 | |||
| WAY / Waystar Holding Corp. | 0,14 | 5,76 | 0,5101 | 0,5101 | |||||
| OS / OneStream, Inc. | 0,19 | 5,44 | 0,4814 | 0,4814 | |||||
| Mixue Group / EC (CNE100006T36) | 0,08 | 5,35 | 0,4735 | 0,4735 | |||||
| VLO / Valero Energy Corporation | 0,04 | -19,35 | 4,83 | -17,92 | 0,4275 | -0,1407 | |||
| TFDXX / Blackrock Liquidity Funds - BlackRock Liquidity Funds FedFund Portfolio Institutional Class | 1,57 | -90,43 | 1,57 | -90,44 | 0,1386 | -1,4420 | |||
| TD SECURITIES (USA) LLC / RA (000000000) | 0,00 | 0,0000 | 0,0000 |