Statistiques de base
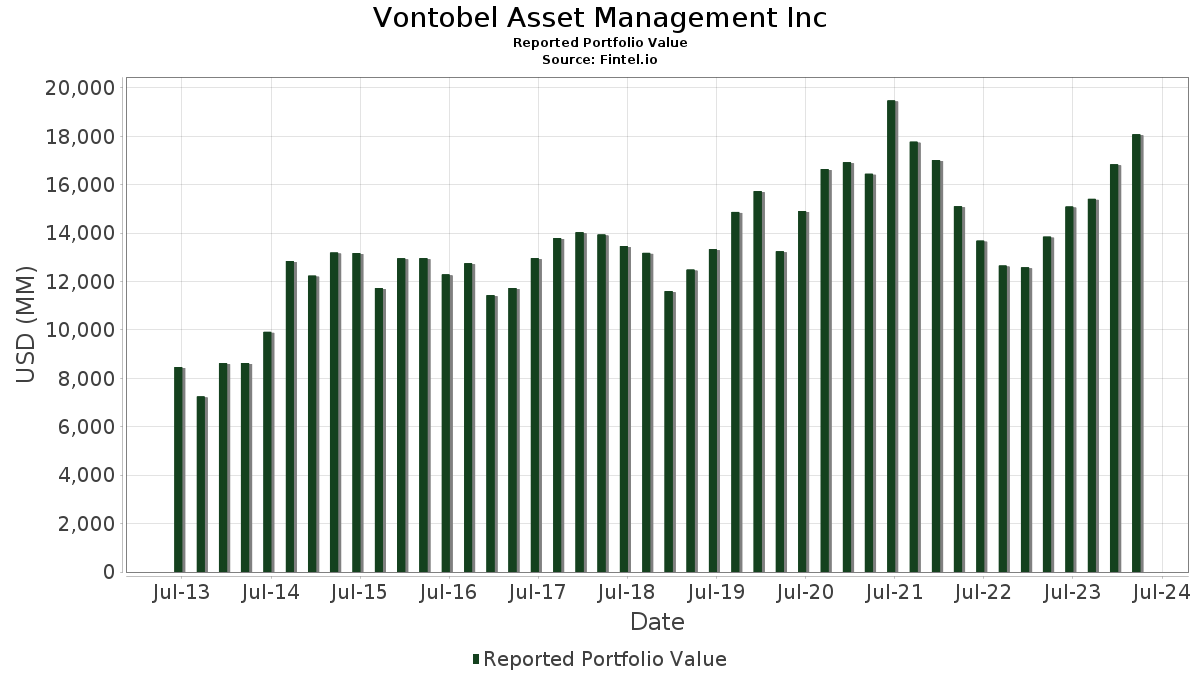
| Valeur du portefeuille | $ 18 078 465 386 |
| Positions actuelles | 70 |
Dernières positions, performances, ASG (à partir des dépôts 13F, 13D)
Vontobel Asset Management Inc a déclaré un total de 70 positions dans ses derniers dépôts auprès de la SEC. La valeur la plus récente du portefeuille est calculée à 18 078 465 386 USD. Les actifs sous gestion réels (ASG) sont cette valeur plus les liquidités (qui ne sont pas divulguées). Les principales positions de Vontobel Asset Management Inc sont Microsoft Corporation (US:MSFT) , Amazon.com, Inc. (US:AMZN) , Mastercard Incorporated (US:MA) , The Coca-Cola Company (US:KO) , and CME Group Inc. (US:CME) . Les nouvelles positions de Vontobel Asset Management Inc incluent Union Pacific Corporation (US:UNP) , PDD Holdings Inc. - Depositary Receipt (Common Stock) (US:PDD) , NVIDIA Corporation (US:NVDA) , Brookfield Infrastructure Partners L.P. - Limited Partnership (US:BIP) , and .
Meilleures augmentations ce trimestre
Nous utilisons la variation de l'allocation du portefeuille car il s'agit de l'indicateur le plus significatif. Les changements peuvent être dus à des transactions ou à des variations de prix des actions.
| Titre | Actions (en millions) |
Valeur ($ en millions) |
% du portefeuille | ΔPortefeuille % |
|---|---|---|---|---|
| 0,63 | 161,07 | 0,8909 | 0,8909 | |
| 1,57 | 149,75 | 0,8284 | 0,8284 | |
| 6,59 | 1 264,19 | 6,9928 | 0,7802 | |
| 0,74 | 130,39 | 0,7213 | 0,7213 | |
| 0,65 | 392,91 | 2,1734 | 0,6565 | |
| 2,25 | 136,35 | 0,7542 | 0,5730 | |
| 0,29 | 204,52 | 1,1313 | 0,3889 | |
| 2,40 | 355,55 | 1,9667 | 0,3648 | |
| 3,24 | 1 449,98 | 8,0205 | 0,2070 | |
| 6,66 | 538,27 | 2,9774 | 0,1983 |
Principales baisses ce trimestre
Nous utilisons la variation de l'allocation du portefeuille car il s'agit de l'indicateur le plus significatif. Les changements peuvent être dus à des transactions ou à des variations de prix des actions.
| Titre | Actions (en millions) |
Valeur ($ en millions) |
% du portefeuille | ΔPortefeuille % |
|---|---|---|---|---|
| 0,72 | 443,17 | 2,4514 | -0,6779 | |
| 1,46 | 769,12 | 4,2543 | -0,6768 | |
| 9,67 | 718,92 | 3,9766 | -0,4963 | |
| 3,44 | 787,78 | 4,3576 | -0,4603 | |
| 2,38 | 148,81 | 0,8231 | -0,4470 | |
| 1,37 | 250,65 | 1,3865 | -0,3338 | |
| 0,00 | 111,07 | 0,6144 | -0,3206 | |
| 0,35 | 283,51 | 1,5682 | -0,3144 | |
| 0,52 | 106,38 | 0,5884 | -0,3126 | |
| 3,16 | 143,07 | 0,7914 | -0,3009 |
Déclarations 13F et dépôts de fonds
Ce formulaire a été déposé le 2024-05-15 pour la période de déclaration 2024-03-31. Cliquez sur l'icône du lien pour voir l'historique complet des transactions.
Mettre à niveau pour débloquer les données premium et exporter vers Excel ![]() .
.
| Titre | Type | Prix moyen de l'action | Actions (en millions) |
ΔActions (%) |
ΔActions (%) |
Valeur ($ en millions) |
Portefeuille (%) |
ΔPortefeuille (%) |
|
|---|---|---|---|---|---|---|---|---|---|
| MSFT / Microsoft Corporation | 3,24 | -2,47 | 1 449,98 | 10,22 | 8,0205 | 0,2070 | |||
| AMZN / Amazon.com, Inc. | 6,59 | 0,87 | 1 264,19 | 20,86 | 6,9928 | 0,7802 | |||
| MA / Mastercard Incorporated | 1,80 | -6,25 | 921,23 | 7,08 | 5,0957 | -0,0140 | |||
| KO / The Coca-Cola Company | 14,05 | -2,00 | 915,38 | 2,75 | 5,0634 | -0,2277 | |||
| CME / CME Group Inc. | 3,44 | -5,89 | 787,78 | -2,89 | 4,3576 | -0,4603 | |||
| UNH / UnitedHealth Group Incorporated | 1,46 | -2,42 | 769,12 | -7,36 | 4,2543 | -0,6768 | |||
| BSX / Boston Scientific Corporation | 9,98 | -9,04 | 728,45 | 8,97 | 4,0294 | 0,0592 | |||
| ABT / Abbott Laboratories | 5,97 | -3,12 | 722,36 | 1,09 | 3,9957 | -0,2484 | |||
| MDLZ / Mondelez International, Inc. | 9,67 | -2,16 | 718,92 | -4,54 | 3,9766 | -0,4963 | |||
| GOOG / Alphabet Inc. | 4,12 | -1,91 | 665,10 | 6,96 | 3,6789 | -0,0141 | |||
| BDX / Becton, Dickinson and Company | 2,28 | 10,59 | 598,14 | 13,11 | 3,3086 | 0,1678 | |||
| RBA / RB Global, Inc. | 6,66 | 0,20 | 538,27 | 15,04 | 2,9774 | 0,1983 | |||
| ADBE / Adobe Inc. | 0,98 | 23,62 | 520,28 | 5,69 | 2,8779 | -0,0458 | |||
| V / Visa Inc. | 1,60 | -5,59 | 472,98 | 2,20 | 2,6163 | -0,1323 | |||
| ICE / Intercontinental Exchange, Inc. | 3,26 | -1,75 | 468,59 | 5,86 | 2,5920 | -0,0371 | |||
| TMO / Thermo Fisher Scientific Inc. | 0,72 | -24,02 | 443,17 | -15,89 | 2,4514 | -0,6779 | |||
| SNPS / Synopsys, Inc. | 0,65 | 37,62 | 392,91 | 53,85 | 2,1734 | 0,6565 | |||
| VMC / Vulcan Materials Company | 1,26 | -10,07 | 365,54 | 9,37 | 2,0219 | 0,0370 | |||
| TSM / Taiwan Semiconductor Manufacturing Company Limited - Depositary Receipt (Common Stock) | 2,40 | -1,18 | 355,55 | 31,82 | 1,9667 | 0,3648 | |||
| INTU / Intuit Inc. | 0,50 | -0,43 | 341,66 | 4,20 | 1,8899 | -0,0575 | |||
| CASY / Casey's General Stores, Inc. | 0,98 | -3,39 | 326,85 | 12,67 | 1,8079 | 0,0850 | |||
| NOW / ServiceNow, Inc. | 0,35 | -17,78 | 283,51 | -10,56 | 1,5682 | -0,3144 | |||
| BKNG / Booking Holdings Inc. | 0,07 | -2,73 | 264,19 | 0,59 | 1,4614 | -0,0985 | |||
| SHW / The Sherwin-Williams Company | 0,70 | -2,48 | 258,20 | 9,71 | 1,4282 | 0,0304 | |||
| PEP / PepsiCo, Inc. | 1,37 | -16,67 | 250,65 | -13,46 | 1,3865 | -0,3338 | |||
| NKE / NIKE, Inc. | 2,10 | 47,36 | 210,07 | 28,76 | 1,1620 | 0,1930 | |||
| PGR / The Progressive Corporation | 0,96 | -10,46 | 208,64 | 17,11 | 1,1541 | 0,0960 | |||
| FTXP / Foothills Exploration, Inc. | 0,29 | 37,57 | 204,52 | 63,62 | 1,1313 | 0,3889 | |||
| APH / Amphenol Corporation | 1,57 | -0,53 | 189,31 | 16,49 | 1,0471 | 0,0819 | |||
| AMT / American Tower Corporation | 0,79 | 36,03 | 162,98 | 25,28 | 0,9015 | 0,1289 | |||
| UNP / Union Pacific Corporation | 0,63 | 161,07 | 0,8909 | 0,8909 | |||||
| SBUX / Starbucks Corporation | 1,57 | 149,75 | 0,8284 | 0,8284 | |||||
| WMT / Walmart Inc. | 2,38 | 81,78 | 148,81 | -30,41 | 0,8231 | -0,4470 | |||
| CMCSA / Comcast Corporation | 3,16 | -21,76 | 143,07 | -22,21 | 0,7914 | -0,3009 | |||
| GOOGL / Alphabet Inc. | 0,90 | -0,89 | 141,82 | 7,82 | 0,7845 | 0,0033 | |||
| CPRT / Copart, Inc. | 2,25 | 276,09 | 136,35 | 346,83 | 0,7542 | 0,5730 | |||
| YUMC / Yum China Holdings, Inc. | 3,17 | 18,60 | 135,30 | 12,67 | 0,7484 | 0,0352 | |||
| KEYS / Keysight Technologies, Inc. | 0,83 | 2,18 | 134,60 | 0,89 | 0,7445 | -0,0478 | |||
| ZTS / Zoetis Inc. | 0,74 | 130,39 | 0,7213 | 0,7213 | |||||
| BRK.A / Berkshire Hathaway Inc. | 0,00 | -40,22 | 111,07 | -29,44 | 0,6144 | -0,3206 | |||
| HDB / HDFC Bank Limited - Depositary Receipt (Common Stock) | 1,47 | 27,34 | 110,23 | 4,44 | 0,6097 | -0,0171 | |||
| HD / The Home Depot, Inc. | 0,27 | -0,42 | 109,11 | 10,93 | 0,6035 | 0,0194 | |||
| GGG / Graco Inc. | 1,10 | 1,53 | 107,56 | 10,05 | 0,5950 | 0,0145 | |||
| HSY / The Hershey Company | 0,52 | -33,22 | 106,38 | -29,88 | 0,5884 | -0,3126 | |||
| ISRG / Intuitive Surgical, Inc. | 0,16 | -2,38 | 67,65 | 16,69 | 0,3742 | 0,0299 | |||
| ACN / Accenture plc | 0,17 | 88,70 | 58,11 | 92,32 | 0,3214 | 0,1420 | |||
| FMX / Fomento Económico Mexicano, S.A.B. de C.V. - Depositary Receipt (Common Stock) | 0,42 | 14,64 | 53,04 | 15,72 | 0,2934 | 0,0212 | |||
| BRK.B / Berkshire Hathaway Inc. | 0,11 | -40,95 | 46,80 | -30,14 | 0,2588 | -0,1390 | |||
| MELI / MercadoLibre, Inc. | 0,03 | 8,81 | 37,71 | 5,80 | 0,2086 | -0,0031 | |||
| MTD / Mettler-Toledo International Inc. | 0,02 | -1,57 | 31,17 | 8,03 | 0,1724 | 0,0010 | |||
| NU HLDGS LTD / CALL (G6683N903) | 2,59 | 30,29 | 0,0000 | ||||||
| PDD / PDD Holdings Inc. - Depositary Receipt (Common Stock) | 0,23 | 26,75 | 0,1480 | 0,1480 | |||||
| AAPL / Apple Inc. | 0,12 | -25,60 | 20,74 | -33,74 | 0,1147 | -0,0712 | |||
| AON / Aon plc | 0,06 | -9,04 | 18,69 | 4,31 | 0,1034 | -0,0030 | |||
| NVDA / NVIDIA Corporation | 0,02 | 17,35 | 0,0960 | 0,0960 | |||||
| BIDU / Baidu, Inc. - Depositary Receipt (Common Stock) | 0,13 | 13,84 | 0,0765 | 0,0765 | |||||
| SLB / Schlumberger Limited | 0,15 | -43,41 | 7,95 | -40,40 | 0,0440 | -0,0353 | |||
| SPY / SPDR S&P 500 ETF | 0,01 | 0,00 | 6,72 | 9,72 | 0,0372 | 0,0008 | |||
| QQQM / Invesco Exchange-Traded Fund Trust II - Invesco NASDAQ 100 ETF | 0,03 | 0,00 | 5,44 | 7,93 | 0,0301 | 0,0002 | |||
| FEZ / SPDR Index Shares Funds - SPDR EURO STOXX 50 ETF | 0,06 | 20,99 | 3,09 | 33,09 | 0,0171 | 0,0033 | |||
| FLGB / Franklin Templeton ETF Trust - Franklin FTSE United Kingdom ETF | 0,11 | 0,00 | 2,81 | 3,95 | 0,0156 | -0,0005 | |||
| FLJP / Franklin Templeton ETF Trust - Franklin FTSE Japan ETF | 0,08 | -10,95 | 2,52 | -1,21 | 0,0140 | -0,0012 | |||
| BIP / Brookfield Infrastructure Partners L.P. - Limited Partnership | 0,02 | 0,77 | 0,0042 | 0,0042 | |||||
| JNJ / Johnson & Johnson | 0,00 | 0,55 | 0,61 | 1,51 | 0,0033 | -0,0002 | |||
| GPC / Genuine Parts Company | 0,00 | -4,63 | 0,55 | 6,77 | 0,0031 | -0,0000 | |||
| MDT / Medtronic plc | 0,01 | 4,61 | 0,53 | 10,60 | 0,0029 | 0,0001 | |||
| WFC / Wells Fargo & Company | 0,01 | -14,02 | 0,44 | 1,14 | 0,0024 | -0,0001 | |||
| TJX / The TJX Companies, Inc. | 0,00 | -58,43 | 0,31 | -55,08 | 0,0017 | -0,0024 | |||
| PNC / The PNC Financial Services Group, Inc. | 0,00 | 1,51 | 0,26 | 5,69 | 0,0014 | -0,0000 | |||
| MTB / M&T Bank Corporation | 0,00 | -5,44 | 0,26 | 0,39 | 0,0014 | -0,0001 | |||
| BABA / Alibaba Group Holding Limited - Depositary Receipt (Common Stock) | 0,00 | -100,00 | 0,00 | 0,0000 | |||||
| LIN / Linde plc | 0,00 | -100,00 | 0,00 | 0,0000 | |||||
| CIB / Grupo Cibest S.A. - Depositary Receipt (Common Stock) | 0,00 | -100,00 | 0,00 | 0,0000 | |||||
| NTES / NetEase, Inc. - Depositary Receipt (Common Stock) | 0,00 | -100,00 | 0,00 | -100,00 | -0,0122 | ||||
| HUM / Humana Inc. | 0,00 | -100,00 | 0,00 | 0,0000 | |||||
| CPNG / Coupang, Inc. | 0,00 | -100,00 | 0,00 | 0,0000 |