Statistiques de base
| Valeur du portefeuille | $ 29 635 031 |
| Positions actuelles | 157 |
Dernières positions, performances, ASG (à partir des dépôts 13F, 13D)
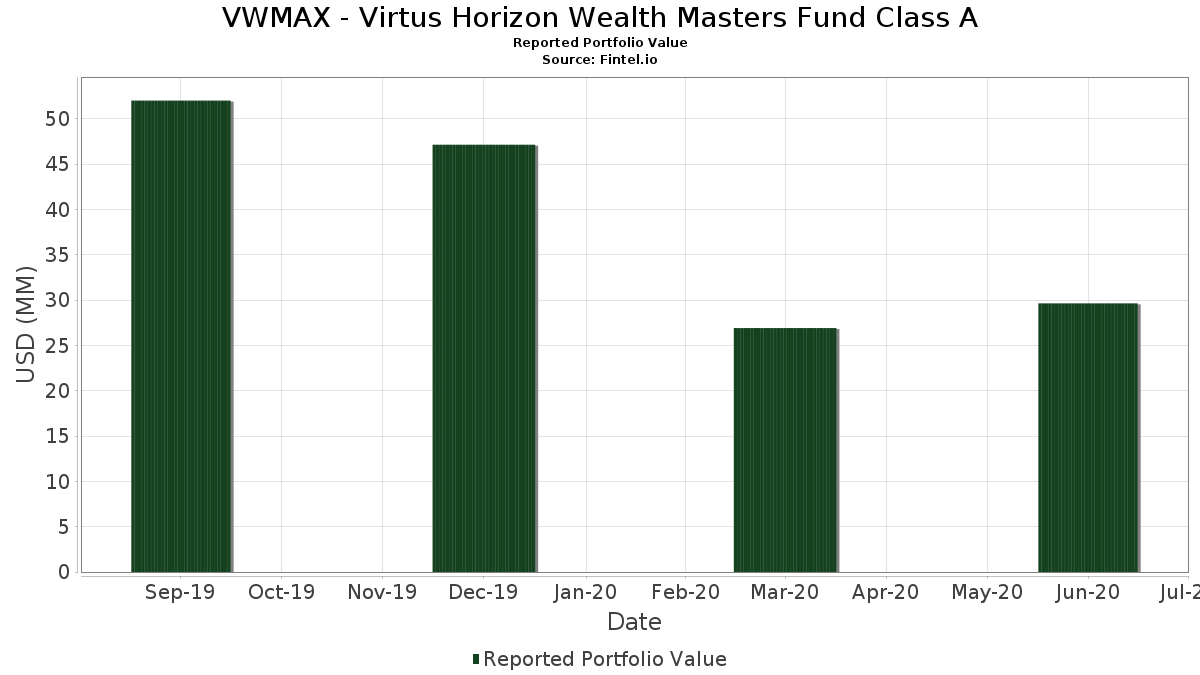
VWMAX - Virtus Horizon Wealth Masters Fund Class A a déclaré un total de 157 positions dans ses derniers dépôts auprès de la SEC. La valeur la plus récente du portefeuille est calculée à 29 635 031 USD. Les actifs sous gestion réels (ASG) sont cette valeur plus les liquidités (qui ne sont pas divulguées). Les principales positions de VWMAX - Virtus Horizon Wealth Masters Fund Class A sont ImmunityBio, Inc. (US:IBRX) , Precigen, Inc. (US:PGEN) , The Gap, Inc. (US:GPS) , NovaGold Resources Inc. (US:NG) , and Urban Edge Properties (US:UE) . Les nouvelles positions de VWMAX - Virtus Horizon Wealth Masters Fund Class A incluent Madison Square Garden Entertainment Corp. (US:MSGE) , Occidental Petroleum Corporation (US:OXY) , .
Meilleures augmentations ce trimestre
Nous utilisons la variation de l'allocation du portefeuille car il s'agit de l'indicateur le plus significatif. Les changements peuvent être dus à des transactions ou à des variations de prix des actions.
| Titre | Actions (en millions) |
Valeur ($ en millions) |
% du portefeuille | ΔPortefeuille % |
|---|---|---|---|---|
| 0,00 | 0,18 | 0,6149 | 0,6149 | |
| 0,01 | 0,18 | 0,6010 | 0,6010 | |
| 0,02 | 0,29 | 0,9748 | 0,4038 | |
| 0,02 | 0,22 | 0,7476 | 0,2446 | |
| 0,01 | 0,20 | 0,6591 | 0,1742 | |
| 0,02 | 0,22 | 0,7428 | 0,1733 | |
| 0,00 | 0,20 | 0,6868 | 0,1554 | |
| 0,01 | 0,20 | 0,6795 | 0,1523 | |
| 0,02 | 0,18 | 0,6070 | 0,1523 | |
| 0,01 | 0,19 | 0,6260 | 0,1475 |
Principales baisses ce trimestre
Nous utilisons la variation de l'allocation du portefeuille car il s'agit de l'indicateur le plus significatif. Les changements peuvent être dus à des transactions ou à des variations de prix des actions.
| Titre | Actions (en millions) |
Valeur ($ en millions) |
% du portefeuille | ΔPortefeuille % |
|---|---|---|---|---|
| 0,00 | 0,00 | -0,7398 | ||
| 0,01 | 0,19 | 0,6214 | -0,5782 | |
| 0,01 | 0,18 | 0,5937 | -0,3172 | |
| 0,01 | 0,16 | 0,5470 | -0,3074 | |
| 0,00 | 0,19 | 0,6226 | -0,2837 | |
| 0,01 | 0,18 | 0,6189 | -0,2444 | |
| 0,09 | 0,19 | 0,6232 | -0,1999 | |
| 0,01 | 0,17 | 0,5648 | -0,1966 | |
| 0,01 | 0,19 | 0,6385 | -0,1662 | |
| 0,00 | 0,18 | 0,6139 | -0,1625 |
Déclarations 13F et dépôts de fonds
Ce formulaire a été déposé le 2020-08-26 pour la période de déclaration 2020-06-30. Cliquez sur l'icône du lien pour voir l'historique complet des transactions.
Mettre à niveau pour débloquer les données premium et exporter vers Excel ![]() .
.
| Titre | Type | Prix moyen de l'action | Actions (en millions) |
ΔActions (%) |
ΔActions (%) |
Valeur ($ en millions) |
Portefeuille (%) |
ΔPortefeuille (%) |
|
|---|---|---|---|---|---|---|---|---|---|
| IBRX / ImmunityBio, Inc. | 0,02 | -55,93 | 0,29 | 88,31 | 0,9748 | 0,4038 | |||
| PGEN / Precigen, Inc. | 0,05 | -23,82 | 0,23 | 12,08 | 0,7794 | 0,0122 | |||
| GPS / The Gap, Inc. | 0,02 | -8,75 | 0,22 | 63,24 | 0,7476 | 0,2446 | |||
| NG / NovaGold Resources Inc. | 0,02 | 15,42 | 0,22 | 43,51 | 0,7428 | 0,1733 | |||
| UE / Urban Edge Properties | 0,02 | -2,48 | 0,21 | 31,25 | 0,7059 | 0,1146 | |||
| EBAY / eBay Inc. | 0,00 | -24,65 | 0,21 | 31,65 | 0,6997 | 0,1139 | |||
| AQB / AquaBounty Technologies, Inc. | 0,06 | -31,55 | 0,21 | 35,95 | 0,6985 | 0,1300 | |||
| TSLA / Tesla, Inc. | 0,00 | -47,40 | 0,21 | 8,38 | 0,6955 | -0,0107 | |||
| MHK / Mohawk Industries, Inc. | 0,00 | -13,76 | 0,21 | 15,08 | 0,6933 | 0,0304 | |||
| HRI / Herc Holdings Inc. | 0,01 | -37,47 | 0,21 | -5,94 | 0,6912 | -0,1189 | |||
| ERIE / Erie Indemnity Company | 0,00 | 9,89 | 0,20 | 42,66 | 0,6868 | 0,1554 | |||
| PSMT / PriceSmart, Inc. | 0,00 | 0,63 | 0,20 | 15,34 | 0,6832 | 0,0323 | |||
| US63934E1082 / Navistar International Corp | 0,01 | -17,04 | 0,20 | 42,25 | 0,6795 | 0,1523 | |||
| PEGA / Pegasystems Inc. | 0,00 | -15,45 | 0,20 | 20,24 | 0,6781 | 0,0566 | |||
| MTZ / MasTec, Inc. | 0,00 | -21,57 | 0,20 | 7,49 | 0,6760 | -0,0160 | |||
| AMZN / Amazon.com, Inc. | 0,00 | -12,05 | 0,20 | 24,84 | 0,6756 | 0,0781 | |||
| TTEC / TTEC Holdings, Inc. | 0,00 | -20,06 | 0,20 | 1,02 | 0,6702 | -0,0576 | |||
| SMG / The Scotts Miracle-Gro Company | 0,00 | -14,91 | 0,20 | 11,80 | 0,6694 | 0,0100 | |||
| SLGN / Silgan Holdings Inc. | 0,01 | 4,08 | 0,20 | 16,37 | 0,6687 | 0,0351 | |||
| GWW / W.W. Grainger, Inc. | 0,00 | -4,95 | 0,20 | 20,00 | 0,6671 | 0,0560 | |||
| INTU / Intuit Inc. | 0,00 | -7,19 | 0,20 | 19,28 | 0,6667 | 0,0527 | |||
| TKR / The Timken Company | 0,00 | -20,71 | 0,20 | 11,86 | 0,6659 | 0,0087 | |||
| ORCL / Oracle Corporation | 0,00 | 3,52 | 0,20 | 18,56 | 0,6650 | 0,0467 | |||
| US36164V3050 / GCI Liberty, Inc. | 0,00 | -21,49 | 0,20 | -1,98 | 0,6649 | -0,0818 | |||
| NWL / Newell Brands Inc. | 0,01 | -0,75 | 0,20 | 19,28 | 0,6648 | 0,0483 | |||
| GRMN / Garmin Ltd. | 0,00 | -9,20 | 0,20 | 17,96 | 0,6620 | 0,0451 | |||
| 636220204 / National General Holdings Corp | 0,01 | -19,74 | 0,20 | 4,81 | 0,6603 | -0,0332 | |||
| ATCO / Atlas Corp. | 0,03 | 9,24 | 0,20 | 7,69 | 0,6597 | -0,0129 | |||
| AMKR / Amkor Technology, Inc. | 0,02 | -33,86 | 0,20 | 4,26 | 0,6592 | -0,0350 | |||
| CLR / Continental Resources Inc (OKLA) | 0,01 | -34,79 | 0,20 | 49,62 | 0,6591 | 0,1742 | |||
| COLM / Columbia Sportswear Company | 0,00 | -1,10 | 0,20 | 14,62 | 0,6590 | 0,0240 | |||
| VIRT / Virtu Financial, Inc. | 0,01 | 9,46 | 0,20 | 24,20 | 0,6556 | 0,0740 | |||
| FDX / FedEx Corporation | 0,00 | -0,71 | 0,20 | 14,71 | 0,6547 | 0,0270 | |||
| L / Loews Corporation | 0,01 | 35,70 | 0,20 | 34,48 | 0,6541 | 0,1152 | |||
| JEF / Jefferies Financial Group Inc. | 0,01 | 9,68 | 0,19 | 24,36 | 0,6536 | 0,0770 | |||
| CVA / Covanta Holding Corporation | 0,02 | 16,19 | 0,19 | 30,20 | 0,6527 | 0,1014 | |||
| QVCGA / QVC Group Inc. | 0,02 | -41,55 | 0,19 | -8,92 | 0,6526 | -0,1371 | |||
| TWNK / Hostess Brands Inc - Class A | 0,02 | 4,44 | 0,19 | 19,75 | 0,6525 | 0,0526 | |||
| DKS / DICK'S Sporting Goods, Inc. | 0,00 | -44,04 | 0,19 | 8,43 | 0,6506 | -0,0088 | |||
| MSM / MSC Industrial Direct Co., Inc. | 0,00 | -14,07 | 0,19 | 13,53 | 0,6502 | 0,0214 | |||
| DHR / Danaher Corporation | 0,00 | -13,02 | 0,19 | 10,92 | 0,6501 | 0,0062 | |||
| SAM / The Boston Beer Company, Inc. | 0,00 | -26,63 | 0,19 | 7,22 | 0,6499 | -0,0178 | |||
| UA / Under Armour, Inc. | 0,02 | 12,03 | 0,19 | 22,93 | 0,6494 | 0,0676 | |||
| PAYX / Paychex, Inc. | 0,00 | -5,23 | 0,19 | 14,20 | 0,6487 | 0,0229 | |||
| HES / Hess Corporation | 0,00 | -26,05 | 0,19 | 15,57 | 0,6482 | 0,0281 | |||
| ROL / Rollins, Inc. | 0,00 | 3,71 | 0,19 | 21,52 | 0,6473 | 0,0616 | |||
| WERN / Werner Enterprises, Inc. | 0,00 | -3,69 | 0,19 | 15,66 | 0,6472 | 0,0310 | |||
| HTH / Hilltop Holdings Inc. | 0,01 | -12,17 | 0,19 | 7,26 | 0,6471 | -0,0175 | |||
| WLK / Westlake Corporation | 0,00 | -14,92 | 0,19 | 20,00 | 0,6455 | 0,0514 | |||
| LNG / Cheniere Energy, Inc. | 0,00 | -19,20 | 0,19 | 16,36 | 0,6454 | 0,0359 | |||
| CRM / Salesforce, Inc. | 0,00 | -8,30 | 0,19 | 19,25 | 0,6454 | 0,0500 | |||
| ESI / Element Solutions Inc | 0,02 | -15,78 | 0,19 | 9,71 | 0,6449 | -0,0045 | |||
| HTLD / Heartland Express, Inc. | 0,01 | 3,06 | 0,19 | 15,66 | 0,6447 | 0,0306 | |||
| MNST / Monster Beverage Corporation | 0,00 | -4,02 | 0,19 | 17,90 | 0,6432 | 0,0445 | |||
| LANC / Lancaster Colony Corporation | 0,00 | 29,53 | 0,19 | 38,41 | 0,6431 | 0,1331 | |||
| LEN / Lennar Corporation | 0,00 | -37,08 | 0,19 | 1,60 | 0,6430 | -0,0543 | |||
| NWSA / News Corporation | 0,02 | -0,09 | 0,19 | 31,72 | 0,6427 | 0,1069 | |||
| GLRE / Greenlight Capital Re, Ltd. | 0,03 | 9,25 | 0,19 | 20,13 | 0,6416 | 0,0517 | |||
| FTV / Fortive Corporation | 0,00 | -16,69 | 0,19 | 2,14 | 0,6412 | -0,0498 | |||
| NOMD / Nomad Foods Limited | 0,01 | -9,82 | 0,19 | 4,37 | 0,6410 | -0,0359 | |||
| CFX / Colfax Corp | 0,01 | -29,96 | 0,19 | -1,55 | 0,6405 | -0,0739 | |||
| SPB / Spectrum Brands Holdings, Inc. | 0,00 | -28,13 | 0,19 | -9,52 | 0,6397 | -0,1366 | |||
| AMH / American Homes 4 Rent | 0,01 | -5,79 | 0,19 | 9,20 | 0,6397 | -0,0049 | |||
| BRKR / Bruker Corporation | 0,00 | 7,35 | 0,19 | 21,79 | 0,6394 | 0,0615 | |||
| BRK.B / Berkshire Hathaway Inc. | 0,00 | 19,22 | 0,19 | 16,56 | 0,6389 | 0,0348 | |||
| FCNCA / First Citizens BancShares, Inc. | 0,00 | -5,05 | 0,19 | 15,85 | 0,6385 | 0,0302 | |||
| WEN / The Wendy's Company | 0,01 | -40,34 | 0,19 | -12,44 | 0,6385 | -0,1662 | |||
| CMCSA / Comcast Corporation | 0,00 | 12,28 | 0,19 | 27,52 | 0,6382 | 0,0864 | |||
| IBKR / Interactive Brokers Group, Inc. | 0,00 | 18,38 | 0,19 | 14,46 | 0,6379 | 0,0249 | |||
| GOOG / Alphabet Inc. | 0,00 | -4,29 | 0,19 | 16,67 | 0,6354 | 0,0343 | |||
| LYB / LyondellBasell Industries N.V. | 0,00 | -20,40 | 0,19 | 5,59 | 0,6347 | -0,0281 | |||
| WRB / W. R. Berkley Corporation | 0,00 | 2,14 | 0,19 | 12,50 | 0,6342 | 0,0118 | |||
| RL / Ralph Lauren Corporation | 0,00 | 17,55 | 0,19 | 27,03 | 0,6339 | 0,0869 | |||
| / ViacomCBS Inc | 0,03 | -2,01 | 0,19 | -0,53 | 0,6317 | -0,0684 | |||
| NEU / NewMarket Corporation | 0,00 | 17,21 | 0,19 | 22,88 | 0,6314 | 0,0645 | |||
| QSR / Restaurant Brands International Inc. | 0,00 | -34,00 | 0,19 | -9,62 | 0,6308 | -0,1400 | |||
| LGF.B / Lions Gate Entertainment Corp. | 0,03 | 10,73 | 0,19 | 35,51 | 0,6303 | 0,1185 | |||
| AFG / American Financial Group, Inc. | 0,00 | -0,37 | 0,19 | -10,10 | 0,6303 | -0,1387 | |||
| MMI / Marcus & Millichap, Inc. | 0,01 | 12,91 | 0,19 | 19,87 | 0,6301 | 0,0533 | |||
| EXPE / Expedia Group, Inc. | 0,00 | -29,39 | 0,19 | 3,31 | 0,6292 | -0,0422 | |||
| BRO / Brown & Brown, Inc. | 0,00 | 2,22 | 0,19 | 14,72 | 0,6292 | 0,0272 | |||
| MCY / Mercury General Corporation | 0,00 | 2,73 | 0,19 | 2,75 | 0,6287 | -0,0444 | |||
| JBGS / JBG SMITH Properties | 0,01 | 16,03 | 0,19 | 8,09 | 0,6276 | -0,0133 | |||
| WBT / Welbilt Inc | 0,03 | -16,43 | 0,19 | -0,53 | 0,6275 | -0,0687 | |||
| ELS / Equity LifeStyle Properties, Inc. | 0,00 | -11,13 | 0,19 | -3,63 | 0,6260 | -0,0873 | |||
| BKE / The Buckle, Inc. | 0,01 | 25,91 | 0,19 | 44,19 | 0,6260 | 0,1475 | |||
| DHI / D.R. Horton, Inc. | 0,00 | -35,42 | 0,19 | 5,08 | 0,6257 | -0,0282 | |||
| CTAS / Cintas Corporation | 0,00 | -18,15 | 0,19 | 26,53 | 0,6245 | 0,0784 | |||
| / Weight Watchers International, Inc. | 0,01 | -29,66 | 0,19 | 5,68 | 0,6244 | -0,0266 | |||
| TR / Tootsie Roll Industries, Inc. | 0,01 | 23,37 | 0,19 | 17,09 | 0,6238 | 0,0398 | |||
| US75606N1090 / RealPage Inc | 0,00 | -18,36 | 0,19 | 0,00 | 0,6235 | -0,0609 | |||
| LTRPA / Liberty TripAdvisor Holdings, Inc. | 0,09 | -29,58 | 0,19 | -16,67 | 0,6232 | -0,1999 | |||
| SPG / Simon Property Group, Inc. | 0,00 | -3,28 | 0,19 | 20,13 | 0,6230 | 0,0542 | |||
| PJT / PJT Partners Inc. | 0,00 | -36,10 | 0,19 | -24,49 | 0,6226 | -0,2837 | |||
| META / Meta Platforms, Inc. | 0,00 | -20,06 | 0,19 | 8,82 | 0,6223 | -0,0071 | |||
| EL / The Estée Lauder Companies Inc. | 0,00 | -1,60 | 0,19 | 16,35 | 0,6222 | 0,0344 | |||
| PENN / PENN Entertainment, Inc. | 0,01 | -76,38 | 0,19 | -42,90 | 0,6214 | -0,5782 | |||
| PAG / Penske Automotive Group, Inc. | 0,00 | -28,62 | 0,18 | -1,60 | 0,6204 | -0,0716 | |||
| XPO / XPO, Inc. | 0,00 | -35,72 | 0,18 | 1,66 | 0,6198 | -0,0499 | |||
| BBWI / Bath & Body Works, Inc. | 0,01 | -15,23 | 0,18 | 9,52 | 0,6196 | -0,0017 | |||
| AL / Air Lease Corporation | 0,01 | -40,36 | 0,18 | -21,03 | 0,6189 | -0,2444 | |||
| AN / AutoNation, Inc. | 0,00 | -18,26 | 0,18 | 9,52 | 0,6174 | -0,0033 | |||
| VNO / Vornado Realty Trust | 0,00 | 1,54 | 0,18 | 7,02 | 0,6169 | -0,0168 | |||
| BF.B / Brown-Forman Corporation | 0,00 | 4,04 | 0,18 | 18,83 | 0,6165 | 0,0478 | |||
| SSNC / SS&C Technologies Holdings, Inc. | 0,00 | -20,79 | 0,18 | 1,67 | 0,6165 | -0,0481 | |||
| RJF / Raymond James Financial, Inc. | 0,00 | 14,15 | 0,18 | 24,49 | 0,6165 | 0,0707 | |||
| TEN / Tsakos Energy Navigation Limited | 0,02 | -49,70 | 0,18 | 5,78 | 0,6158 | -0,0258 | |||
| / ViacomCBS Inc | 0,01 | -36,45 | 0,18 | 5,78 | 0,6154 | -0,0249 | |||
| MSGE / Madison Square Garden Entertainment Corp. | 0,00 | 0,18 | 0,6149 | 0,6149 | |||||
| VAC / Marriott Vacations Worldwide Corporation | 0,00 | -41,16 | 0,18 | -13,33 | 0,6139 | -0,1625 | |||
| STZ / Constellation Brands, Inc. | 0,00 | -17,70 | 0,18 | 0,00 | 0,6139 | -0,0589 | |||
| LBRDK / Liberty Broadband Corporation | 0,00 | -9,28 | 0,18 | 1,11 | 0,6137 | -0,0514 | |||
| EQR / Equity Residential | 0,00 | 20,50 | 0,18 | 14,47 | 0,6136 | 0,0256 | |||
| CNDT / Conduent Incorporated | 0,08 | -8,58 | 0,18 | -11,22 | 0,6134 | -0,1437 | |||
| DISCK / Warner Bros.Discovery Inc - Series C | 0,01 | 14,53 | 0,18 | 25,52 | 0,6128 | 0,0764 | |||
| BATRK / Atlanta Braves Holdings, Inc. | 0,01 | -6,78 | 0,18 | -3,70 | 0,6124 | -0,0858 | |||
| LSXMK / Liberty Media Corp. (New Liberty SiriusXM) Series C | 0,01 | -1,19 | 0,18 | 7,69 | 0,6121 | -0,0138 | |||
| LVS / Las Vegas Sands Corp. | 0,00 | 3,15 | 0,18 | 10,98 | 0,6110 | 0,0029 | |||
| LILAK / Liberty Latin America Ltd. | 0,02 | 16,85 | 0,18 | 7,74 | 0,6089 | -0,0145 | |||
| MORN / Morningstar, Inc. | 0,00 | -9,70 | 0,18 | 9,70 | 0,6072 | -0,0032 | |||
| LE / Lands' End, Inc. | 0,02 | -2,40 | 0,18 | 46,34 | 0,6070 | 0,1523 | |||
| DDS / Dillard's, Inc. | 0,01 | 99,77 | 0,18 | 39,53 | 0,6056 | 0,1275 | |||
| DISH / DISH Network Corporation | 0,01 | -26,99 | 0,18 | 25,87 | 0,6051 | 0,0767 | |||
| EXTN / Exterran Corp | 0,03 | 6,57 | 0,18 | 20,00 | 0,6048 | 0,0485 | |||
| CNS / Cohen & Steers, Inc. | 0,00 | -34,56 | 0,18 | -2,19 | 0,6031 | -0,0744 | |||
| FWONK / Formula One Group | 0,01 | -13,01 | 0,18 | 1,13 | 0,6029 | -0,0522 | |||
| DBI / Designer Brands Inc. | 0,03 | -1,25 | 0,18 | 34,59 | 0,6016 | 0,1083 | |||
| CLDR / Cloudera Inc | 0,01 | -38,89 | 0,18 | -1,10 | 0,6012 | -0,0687 | |||
| OXY / Occidental Petroleum Corporation | 0,01 | 0,18 | 0,6010 | 0,6010 | |||||
| PARR / Par Pacific Holdings, Inc. | 0,02 | 1,15 | 0,18 | 28,78 | 0,6007 | 0,0844 | |||
| LBTYK / Liberty Global Ltd. | 0,01 | -11,59 | 0,18 | 21,77 | 0,6007 | 0,0545 | |||
| BEN / Franklin Resources, Inc. | 0,01 | 6,18 | 0,18 | 33,58 | 0,6005 | 0,1051 | |||
| BOKF / BOK Financial Corporation | 0,00 | -19,37 | 0,18 | 6,59 | 0,5990 | -0,0176 | |||
| CHH / Choice Hotels International, Inc. | 0,00 | -19,04 | 0,18 | 4,09 | 0,5987 | -0,0332 | |||
| SATS / EchoStar Corporation | 0,01 | 21,59 | 0,18 | 6,59 | 0,5985 | -0,0210 | |||
| FOXA / Fox Corporation | 0,01 | -2,96 | 0,18 | 10,56 | 0,5984 | 0,0004 | |||
| MAR / Marriott International, Inc. | 0,00 | -11,27 | 0,18 | 1,71 | 0,5976 | -0,0493 | |||
| XRX / Xerox Holdings Corporation | 0,01 | 30,01 | 0,18 | 4,73 | 0,5971 | -0,0291 | |||
| US5535731062 / MSG Networks Inc | 0,02 | 38,24 | 0,18 | 35,11 | 0,5956 | 0,1095 | |||
| RES / RPC, Inc. | 0,06 | -7,97 | 0,18 | 38,28 | 0,5941 | 0,1189 | |||
| GLPI / Gaming and Leisure Properties, Inc. | 0,01 | -42,55 | 0,18 | -28,46 | 0,5937 | -0,3172 | |||
| SCHW / The Charles Schwab Corporation | 0,01 | 6,56 | 0,18 | 6,67 | 0,5919 | -0,0173 | |||
| MSGS / Madison Square Garden Sports Corp. | 0,00 | 55,56 | 0,17 | 8,07 | 0,5864 | -0,0108 | |||
| CVI / CVR Energy, Inc. | 0,01 | 10,13 | 0,17 | 33,85 | 0,5851 | 0,1044 | |||
| H / Hyatt Hotels Corporation | 0,00 | -11,81 | 0,17 | -7,45 | 0,5847 | -0,1103 | |||
| HHC / Howard Hughes Corporation | 0,00 | -3,13 | 0,17 | -0,57 | 0,5824 | -0,0611 | |||
| TMST / TimkenSteel Corporation | 0,04 | -7,77 | 0,17 | 11,11 | 0,5725 | 0,0052 | |||
| AEO / American Eagle Outfitters, Inc. | 0,02 | -8,29 | 0,17 | 25,93 | 0,5717 | 0,0713 | |||
| HST / Host Hotels & Resorts, Inc. | 0,02 | 4,57 | 0,17 | 2,41 | 0,5715 | -0,0440 | |||
| CCL / Carnival Corporation & plc | 0,01 | -34,51 | 0,17 | -18,45 | 0,5648 | -0,1966 | |||
| WTI / W&T Offshore, Inc. | 0,07 | -23,62 | 0,17 | 2,45 | 0,5607 | -0,0417 | |||
| AMCX / AMC Networks Inc. | 0,01 | 27,25 | 0,17 | 22,06 | 0,5595 | 0,0565 | |||
| SRG / Seritage Growth Properties | 0,01 | -20,51 | 0,17 | -0,60 | 0,5587 | -0,0595 | |||
| JWN / Nordstrom, Inc. | 0,01 | 43,89 | 0,16 | 45,54 | 0,5497 | 0,1333 | |||
| URBN / Urban Outfitters, Inc. | 0,01 | 10,71 | 0,16 | 18,12 | 0,5489 | 0,0383 | |||
| RRR / Red Rock Resorts, Inc. | 0,01 | -44,78 | 0,16 | -29,44 | 0,5470 | -0,3074 | |||
| DBRG / DigitalBridge Group, Inc. | 0,07 | -36,80 | 0,16 | -13,37 | 0,5442 | -0,1469 | |||
| IAC / IAC Inc. | 0,00 | -100,00 | 0,00 | -100,00 | -0,7398 |