Statistiques de base
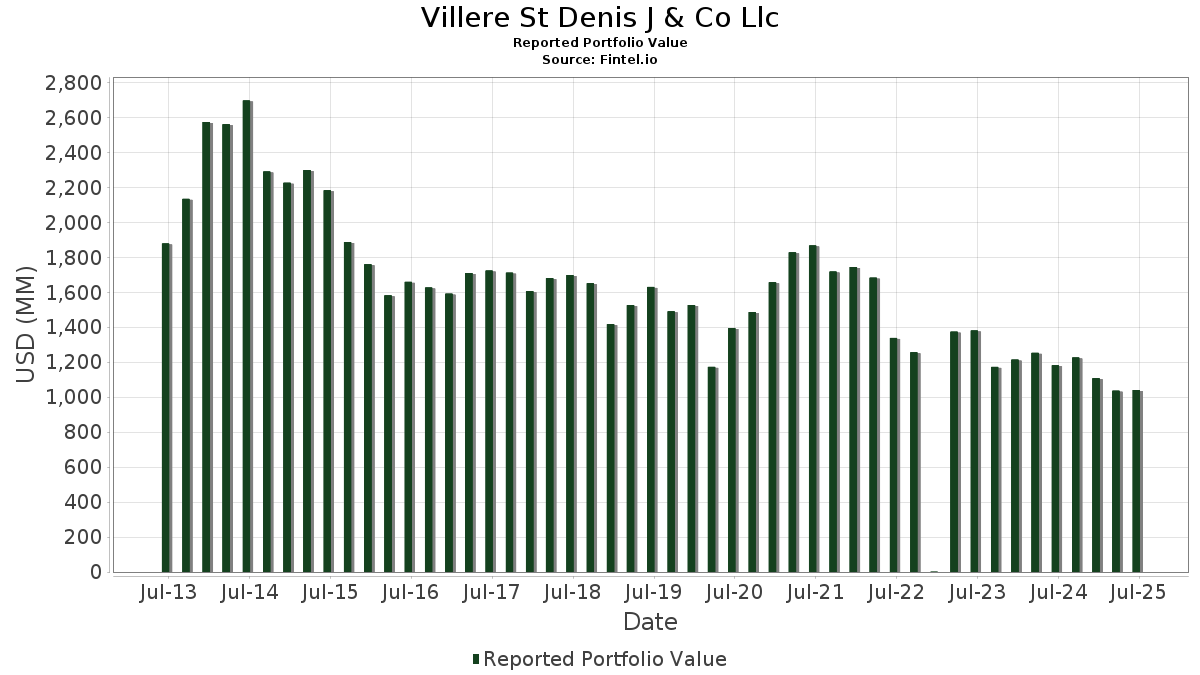
| Valeur du portefeuille | $ 1 040 669 527 |
| Positions actuelles | 81 |
Dernières positions, performances, ASG (à partir des dépôts 13F, 13D)
Villere St Denis J & Co Llc a déclaré un total de 81 positions dans ses derniers dépôts auprès de la SEC. La valeur la plus récente du portefeuille est calculée à 1 040 669 527 USD. Les actifs sous gestion réels (ASG) sont cette valeur plus les liquidités (qui ne sont pas divulguées). Les principales positions de Villere St Denis J & Co Llc sont JPMorgan Chase & Co. (US:JPM) , Visa Inc. (US:V) , Palomar Holdings, Inc. (US:PLMR) , Amazon.com, Inc. (US:AMZN) , and Pool Corporation (US:POOL) . Les nouvelles positions de Villere St Denis J & Co Llc incluent United Parcel Service, Inc. (US:UPS) , ProShares Trust - ProShares Bitcoin ETF (US:BITO) , .
Meilleures augmentations ce trimestre
Nous utilisons la variation de l'allocation du portefeuille car il s'agit de l'indicateur le plus significatif. Les changements peuvent être dus à des transactions ou à des variations de prix des actions.
| Titre | Actions (en millions) |
Valeur ($ en millions) |
% du portefeuille | ΔPortefeuille % |
|---|---|---|---|---|
| 0,16 | 15,87 | 1,5248 | 1,5248 | |
| 0,21 | 60,67 | 5,8298 | 0,7954 | |
| 0,37 | 26,11 | 2,5086 | 0,7163 | |
| 0,05 | 26,26 | 2,5231 | 0,5673 | |
| 0,18 | 38,98 | 3,7460 | 0,5206 | |
| 0,68 | 35,26 | 3,3882 | 0,4821 | |
| 0,08 | 19,98 | 1,9198 | 0,4809 | |
| 0,40 | 20,83 | 2,0015 | 0,4046 | |
| 0,06 | 30,16 | 2,8985 | 0,3541 | |
| 0,27 | 41,33 | 3,9716 | 0,3199 |
Principales baisses ce trimestre
Nous utilisons la variation de l'allocation du portefeuille car il s'agit de l'indicateur le plus significatif. Les changements peuvent être dus à des transactions ou à des variations de prix des actions.
| Titre | Actions (en millions) |
Valeur ($ en millions) |
% du portefeuille | ΔPortefeuille % |
|---|---|---|---|---|
| 0,00 | 0,29 | 0,0283 | -2,5573 | |
| 0,21 | 29,75 | 2,8592 | -0,5148 | |
| 0,13 | 37,08 | 3,5629 | -0,4490 | |
| 2,01 | 26,86 | 2,5807 | -0,4254 | |
| 0,88 | 28,63 | 2,7509 | -0,3065 | |
| 0,15 | 19,50 | 1,8735 | -0,3031 | |
| 0,06 | 36,24 | 3,4826 | -0,2338 | |
| 0,13 | 20,33 | 1,9534 | -0,2291 | |
| 0,59 | 25,62 | 2,4620 | -0,2151 | |
| 0,27 | 26,97 | 2,5920 | -0,2110 |
Déclarations 13F et dépôts de fonds
Ce formulaire a été déposé le 2025-07-24 pour la période de déclaration 2025-06-30. Cliquez sur l'icône du lien pour voir l'historique complet des transactions.
Mettre à niveau pour débloquer les données premium et exporter vers Excel ![]() .
.
| Titre | Type | Prix moyen de l'action | Actions (en millions) |
ΔActions (%) |
ΔActions (%) |
Valeur ($ en millions) |
Portefeuille (%) |
ΔPortefeuille (%) |
|
|---|---|---|---|---|---|---|---|---|---|
| JPM / JPMorgan Chase & Co. | 0,21 | -1,63 | 60,67 | 16,26 | 5,8298 | 0,7954 | |||
| V / Visa Inc. | 0,12 | -3,36 | 44,15 | -2,09 | 4,2425 | -0,1078 | |||
| PLMR / Palomar Holdings, Inc. | 0,27 | -2,96 | 41,33 | 9,19 | 3,9716 | 0,3199 | |||
| AMZN / Amazon.com, Inc. | 0,18 | 1,12 | 38,98 | 16,60 | 3,7460 | 0,5206 | |||
| POOL / Pool Corporation | 0,13 | -2,62 | 37,08 | -10,84 | 3,5629 | -0,4490 | |||
| ROP / Roper Technologies, Inc. | 0,06 | -2,15 | 36,24 | -5,92 | 3,4826 | -0,2338 | |||
| ONON / On Holding AG | 0,68 | -1,23 | 35,26 | 17,05 | 3,3882 | 0,4821 | |||
| FCX / Freeport-McMoRan Inc. | 0,78 | -2,95 | 33,68 | 11,12 | 3,2359 | 0,3123 | |||
| SYK / Stryker Corporation | 0,08 | -2,13 | 33,07 | 4,02 | 3,1781 | 0,1106 | |||
| LGND / Ligand Pharmaceuticals Incorporated | 0,29 | -0,59 | 32,64 | 7,48 | 3,1364 | 0,2068 | |||
| ABT / Abbott Laboratories | 0,24 | -2,13 | 32,55 | 0,35 | 3,1275 | -0,0016 | |||
| IDXX / IDEXX Laboratories, Inc. | 0,06 | -10,45 | 30,16 | 14,37 | 2,8985 | 0,3541 | |||
| CVX / Chevron Corporation | 0,21 | -0,60 | 29,75 | -14,92 | 2,8592 | -0,5148 | |||
| OPCH / Option Care Health, Inc. | 0,88 | -2,80 | 28,63 | -9,67 | 2,7509 | -0,3065 | |||
| UBER / Uber Technologies, Inc. | 0,30 | -27,08 | 28,40 | -6,63 | 2,7294 | -0,2053 | |||
| LMT / Lockheed Martin Corporation | 0,06 | -2,33 | 27,36 | 1,27 | 2,6291 | 0,0226 | |||
| EEFT / Euronet Worldwide, Inc. | 0,27 | -2,15 | 26,97 | -7,16 | 2,5920 | -0,2110 | |||
| AESI / Atlas Energy Solutions Inc. | 2,01 | 15,01 | 26,86 | -13,81 | 2,5807 | -0,4254 | |||
| MSFT / Microsoft Corporation | 0,05 | -2,25 | 26,26 | 29,52 | 2,5231 | 0,5673 | |||
| MCHP / Microchip Technology Incorporated | 0,37 | -3,33 | 26,11 | 40,51 | 2,5086 | 0,7163 | |||
| LINE / Lineage, Inc. | 0,59 | 24,39 | 25,62 | -7,67 | 2,4620 | -0,2151 | |||
| STE / STERIS plc | 0,11 | -1,18 | 25,27 | 4,74 | 2,4285 | 0,1007 | |||
| PGR / The Progressive Corporation | 0,09 | 3,56 | 24,24 | -2,35 | 2,3294 | -0,0656 | |||
| MDLZ / Mondelez International, Inc. | 0,35 | -3,04 | 23,62 | -3,62 | 2,2696 | -0,0947 | |||
| BAC.PRL / Bank of America Corporation - Preferred Stock | 0,02 | -1,99 | 23,55 | -3,70 | 2,2631 | -0,0963 | |||
| CZR / Caesars Entertainment, Inc. | 0,79 | -2,39 | 22,41 | 10,84 | 2,1532 | 0,2029 | |||
| CL / Colgate-Palmolive Company | 0,24 | -2,96 | 22,22 | -5,86 | 2,1352 | -0,1418 | |||
| TDW / Tidewater Inc. | 0,46 | -4,12 | 21,26 | 4,64 | 2,0431 | 0,0827 | |||
| ON / ON Semiconductor Corporation | 0,40 | -2,31 | 20,83 | 25,83 | 2,0015 | 0,4046 | |||
| JNJ / Johnson & Johnson | 0,13 | -2,44 | 20,33 | -10,14 | 1,9534 | -0,2291 | |||
| RSG / Republic Services, Inc. | 0,08 | 31,53 | 19,98 | 33,95 | 1,9198 | 0,4809 | |||
| PEP / PepsiCo, Inc. | 0,15 | -1,87 | 19,50 | -13,58 | 1,8735 | -0,3031 | |||
| AAPL / Apple Inc. | 0,09 | -1,24 | 18,41 | -8,78 | 1,7695 | -0,1781 | |||
| VZ / Verizon Communications Inc. | 0,40 | -3,05 | 17,43 | -7,52 | 1,6752 | -0,1433 | |||
| FIBK / First Interstate BancSystem, Inc. | 0,56 | 4,86 | 16,04 | 5,48 | 1,5415 | 0,0743 | |||
| UPS / United Parcel Service, Inc. | 0,16 | 15,87 | 1,5248 | 1,5248 | |||||
| REYN / Reynolds Consumer Products Inc. | 0,31 | -0,37 | 6,74 | -10,56 | 0,6479 | -0,0793 | |||
| PFE / Pfizer Inc. | 0,14 | -4,29 | 3,49 | -8,45 | 0,3353 | -0,0324 | |||
| TPL / Texas Pacific Land Corporation | 0,00 | 0,00 | 1,19 | -20,27 | 0,1142 | -0,0296 | |||
| TRV / The Travelers Companies, Inc. | 0,00 | 0,00 | 0,88 | 1,15 | 0,0849 | 0,0006 | |||
| XOM / Exxon Mobil Corporation | 0,01 | -3,62 | 0,86 | -12,58 | 0,0828 | -0,0124 | |||
| GOOGL / Alphabet Inc. | 0,00 | 0,00 | 0,85 | 14,00 | 0,0815 | 0,0097 | |||
| SCHF / Schwab Strategic Trust - Schwab International Equity ETF | 0,03 | -7,55 | 0,77 | 3,37 | 0,0736 | 0,0021 | |||
| CLGN / CollPlant Biotechnologies Ltd. | 0,55 | 13,02 | 0,74 | -40,46 | 0,0715 | -0,0490 | |||
| BRK.B / Berkshire Hathaway Inc. | 0,00 | 0,00 | 0,71 | -8,80 | 0,0678 | -0,0068 | |||
| VEA / Vanguard Tax-Managed Funds - Vanguard FTSE Developed Markets ETF | 0,01 | -17,07 | 0,66 | -7,03 | 0,0636 | -0,0051 | |||
| SPY / SPDR S&P 500 ETF | 0,00 | -4,83 | 0,61 | 5,19 | 0,0585 | 0,0026 | |||
| ACOG / Alpha Cognition Inc. | 0,06 | -11,06 | 0,60 | 63,91 | 0,0572 | 0,0222 | |||
| HD / The Home Depot, Inc. | 0,00 | -11,82 | 0,44 | -11,90 | 0,0421 | -0,0058 | |||
| GOOGL / Alphabet Inc. | 0,00 | 0,00 | 0,42 | 13,48 | 0,0405 | 0,0047 | |||
| ESGD / iShares Trust - iShares ESG Aware MSCI EAFE ETF | 0,00 | 0,00 | 0,41 | 9,36 | 0,0394 | 0,0032 | |||
| ESGU / iShares Trust - iShares ESG Aware MSCI USA ETF | 0,00 | 0,00 | 0,41 | 10,96 | 0,0390 | 0,0037 | |||
| NSC / Norfolk Southern Corporation | 0,00 | 0,00 | 0,40 | 8,04 | 0,0387 | 0,0028 | |||
| VBR / Vanguard Index Funds - Vanguard Small-Cap Value ETF | 0,00 | 0,00 | 0,39 | 4,79 | 0,0379 | 0,0016 | |||
| SUSA / iShares Trust - iShares ESG Optimized MSCI USA ETF | 0,00 | 0,00 | 0,38 | 10,47 | 0,0365 | 0,0033 | |||
| IEMG / iShares, Inc. - iShares Core MSCI Emerging Markets ETF | 0,01 | 0,00 | 0,36 | 11,46 | 0,0346 | 0,0034 | |||
| SHEL / Shell plc - Depositary Receipt (Common Stock) | 0,01 | 0,00 | 0,35 | -3,83 | 0,0338 | -0,0015 | |||
| BLK / BlackRock, Inc. | 0,00 | 0,00 | 0,35 | 10,73 | 0,0338 | 0,0032 | |||
| TFI / SPDR Series Trust - SPDR Nuveen ICE Municipal Bond ETF | 0,01 | 0,00 | 0,35 | -0,85 | 0,0335 | -0,0004 | |||
| VTI / Vanguard Index Funds - Vanguard Total Stock Market ETF | 0,00 | -12,30 | 0,35 | -3,08 | 0,0333 | -0,0012 | |||
| FEIM / Frequency Electronics, Inc. | 0,01 | 0,00 | 0,34 | 45,06 | 0,0325 | 0,0100 | |||
| ITOT / iShares Trust - iShares Core S&P Total U.S. Stock Market ETF | 0,00 | 0,00 | 0,34 | 10,49 | 0,0324 | 0,0030 | |||
| NVDA / NVIDIA Corporation | 0,00 | 0,00 | 0,33 | 45,74 | 0,0313 | 0,0097 | |||
| WMT / Walmart Inc. | 0,00 | -4,35 | 0,32 | 6,62 | 0,0310 | 0,0018 | |||
| COST / Costco Wholesale Corporation | 0,00 | 0,00 | 0,31 | 4,41 | 0,0297 | 0,0012 | |||
| JBHT / J.B. Hunt Transport Services, Inc. | 0,00 | -98,87 | 0,29 | -98,90 | 0,0283 | -2,5573 | |||
| GLD / SPDR Gold Trust | 0,00 | 0,00 | 0,28 | 5,70 | 0,0268 | 0,0014 | |||
| SLF / Sun Life Financial Inc. | 0,00 | 0,00 | 0,28 | 15,90 | 0,0267 | 0,0036 | |||
| EMB / iShares Trust - iShares J.P. Morgan USD Emerging Markets Bond ETF | 0,00 | 0,00 | 0,27 | 2,26 | 0,0261 | 0,0005 | |||
| IWS / iShares Trust - iShares Russell Mid-Cap Value ETF | 0,00 | -25,56 | 0,27 | -22,09 | 0,0258 | -0,0074 | |||
| VWO / Vanguard International Equity Index Funds - Vanguard FTSE Emerging Markets ETF | 0,01 | 0,00 | 0,25 | 9,01 | 0,0245 | 0,0020 | |||
| HON / Honeywell International Inc. | 0,00 | -4,57 | 0,24 | 4,76 | 0,0233 | 0,0010 | |||
| LIND / Lindblad Expeditions Holdings, Inc. | 0,02 | 0,00 | 0,23 | 25,81 | 0,0225 | 0,0046 | |||
| EPD / Enterprise Products Partners L.P. - Limited Partnership | 0,01 | 0,00 | 0,23 | -9,13 | 0,0221 | -0,0023 | |||
| FLL / Full House Resorts, Inc. | 0,06 | 50,00 | 0,22 | 31,14 | 0,0211 | 0,0050 | |||
| TMO / Thermo Fisher Scientific Inc. | 0,00 | 0,00 | 0,21 | -18,77 | 0,0205 | -0,0047 | |||
| NEE / NextEra Energy, Inc. | 0,00 | -25,32 | 0,20 | -27,14 | 0,0197 | -0,0073 | |||
| BITO / ProShares Trust - ProShares Bitcoin ETF | 0,01 | 0,20 | 0,0196 | 0,0196 | |||||
| CORZ / Core Scientific, Inc. | 0,01 | 0,00 | 0,17 | 136,11 | 0,0164 | 0,0094 | |||
| GIFI / Gulf Island Fabrication, Inc. | 0,02 | 0,00 | 0,13 | 3,10 | 0,0128 | 0,0003 | |||
| ASYS / Amtech Systems, Inc. | 0,02 | 0,00 | 0,09 | -8,33 | 0,0085 | -0,0008 | |||
| MNST / Monster Beverage Corporation | 0,00 | -100,00 | 0,00 | 0,0000 | |||||
| UTI / Universal Technical Institute, Inc. | 0,00 | -100,00 | 0,00 | 0,0000 | |||||
| NWL / Newell Brands Inc. | 0,00 | -100,00 | 0,00 | 0,0000 | |||||
| OABI / OmniAb, Inc. | 0,00 | -100,00 | 0,00 | 0,0000 |