Statistiques de base
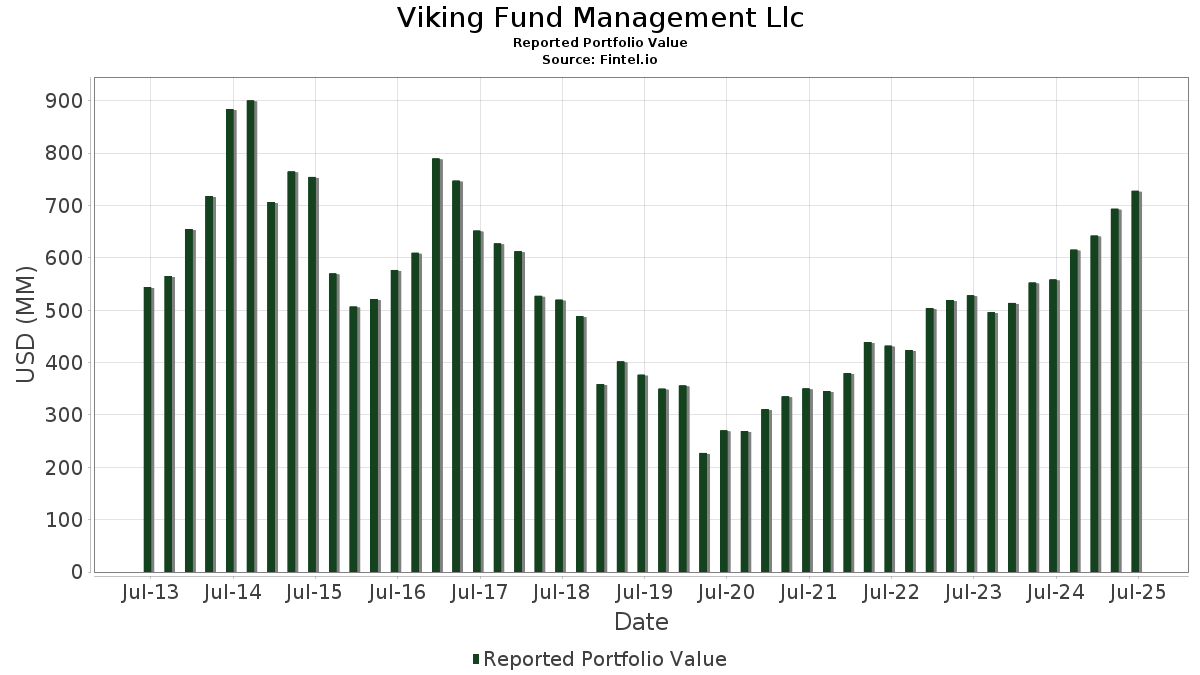
| Valeur du portefeuille | $ 727 980 634 |
| Positions actuelles | 143 |
Dernières positions, performances, ASG (à partir des dépôts 13F, 13D)
Viking Fund Management Llc a déclaré un total de 143 positions dans ses derniers dépôts auprès de la SEC. La valeur la plus récente du portefeuille est calculée à 727 980 634 USD. Les actifs sous gestion réels (ASG) sont cette valeur plus les liquidités (qui ne sont pas divulguées). Les principales positions de Viking Fund Management Llc sont Broadcom Inc. (US:AVGO) , NextEra Energy, Inc. (US:NEE) , TC Energy Corporation (US:TRP) , Chevron Corporation (US:CVX) , and PepsiCo, Inc. (US:PEP) . Les nouvelles positions de Viking Fund Management Llc incluent Cameco Corporation (US:CCJ) , Chesapeake Energy Corporation (US:CHK) , Noble Corporation plc (US:NE) , ING Groep N.V. - Depositary Receipt (Common Stock) (US:ING) , and .
Meilleures augmentations ce trimestre
Nous utilisons la variation de l'allocation du portefeuille car il s'agit de l'indicateur le plus significatif. Les changements peuvent être dus à des transactions ou à des variations de prix des actions.
| Titre | Actions (en millions) |
Valeur ($ en millions) |
% du portefeuille | ΔPortefeuille % |
|---|---|---|---|---|
| 0,11 | 29,77 | 4,0894 | 1,1205 | |
| 0,12 | 13,47 | 1,8510 | 0,9937 | |
| 0,50 | 24,49 | 3,3645 | 0,7645 | |
| 0,02 | 3,62 | 0,4978 | 0,4978 | |
| 0,07 | 10,27 | 1,4107 | 0,3951 | |
| 0,10 | 14,37 | 1,9736 | 0,3758 | |
| 0,06 | 6,99 | 0,9599 | 0,3686 | |
| 0,16 | 7,46 | 1,0241 | 0,3565 | |
| 0,21 | 14,30 | 1,9645 | 0,3316 | |
| 0,14 | 12,34 | 1,6954 | 0,3138 |
Principales baisses ce trimestre
Nous utilisons la variation de l'allocation du portefeuille car il s'agit de l'indicateur le plus significatif. Les changements peuvent être dus à des transactions ou à des variations de prix des actions.
| Titre | Actions (en millions) |
Valeur ($ en millions) |
% du portefeuille | ΔPortefeuille % |
|---|---|---|---|---|
| 0,42 | 29,50 | 4,0528 | -1,0060 | |
| 0,11 | 2,79 | 0,3835 | -0,9081 | |
| 0,32 | 14,75 | 2,0265 | -0,7757 | |
| 0,08 | 14,29 | 1,9633 | -0,7552 | |
| 0,28 | 2,95 | 0,4046 | -0,7234 | |
| 0,08 | 6,41 | 0,8808 | -0,4132 | |
| 0,30 | 7,37 | 1,0122 | -0,3906 | |
| 0,15 | 5,77 | 0,7921 | -0,3388 | |
| 0,03 | 7,06 | 0,9701 | -0,3309 | |
| 0,04 | 2,33 | 0,3204 | -0,2958 |
Déclarations 13F et dépôts de fonds
Ce formulaire a été déposé le 2025-07-11 pour la période de déclaration 2025-06-30. Cliquez sur l'icône du lien pour voir l'historique complet des transactions.
Mettre à niveau pour débloquer les données premium et exporter vers Excel ![]() .
.
| Titre | Type | Prix moyen de l'action | Actions (en millions) |
ΔActions (%) |
ΔActions (%) |
Valeur ($ en millions) |
Portefeuille (%) |
ΔPortefeuille (%) |
|
|---|---|---|---|---|---|---|---|---|---|
| AVGO / Broadcom Inc. | 0,11 | -12,20 | 29,77 | 44,56 | 4,0894 | 1,1205 | |||
| NEE / NextEra Energy, Inc. | 0,42 | -14,14 | 29,50 | -15,92 | 4,0528 | -1,0060 | |||
| TRP / TC Energy Corporation | 0,50 | 31,41 | 24,49 | 35,81 | 3,3645 | 0,7645 | |||
| CVX / Chevron Corporation | 0,15 | 29,06 | 21,62 | 10,47 | 2,9701 | 0,1484 | |||
| PEP / PepsiCo, Inc. | 0,12 | 12,61 | 16,50 | -0,83 | 2,2672 | -0,1322 | |||
| BMY / Bristol-Myers Squibb Company | 0,32 | 0,00 | 14,75 | -24,10 | 2,0265 | -0,7757 | |||
| MS / Morgan Stanley | 0,10 | 7,37 | 14,37 | 29,63 | 1,9736 | 0,3758 | |||
| XEL / Xcel Energy Inc. | 0,21 | 31,25 | 14,30 | 26,27 | 1,9645 | 0,3316 | |||
| ABBV / AbbVie Inc. | 0,08 | -14,44 | 14,29 | -24,20 | 1,9633 | -0,7552 | |||
| GLW / Corning Incorporated | 0,26 | 4,00 | 13,67 | 19,47 | 1,8783 | 0,2283 | |||
| XOM / Exxon Mobil Corporation | 0,12 | 150,00 | 13,47 | 126,62 | 1,8510 | 0,9937 | |||
| C / Citigroup Inc. | 0,14 | 7,41 | 12,34 | 28,79 | 1,6954 | 0,3138 | |||
| JPM / JPMorgan Chase & Co. | 0,04 | 0,00 | 12,18 | 18,19 | 1,6726 | 0,1873 | |||
| QCOM / QUALCOMM Incorporated | 0,07 | 4,17 | 11,94 | 8,00 | 1,6408 | 0,0463 | |||
| PR / Permian Resources Corporation | 0,84 | 2,44 | 11,45 | 0,74 | 1,5735 | -0,0658 | |||
| AEP / American Electric Power Company, Inc. | 0,11 | 0,00 | 11,41 | -5,04 | 1,5678 | -0,1650 | |||
| T / AT&T Inc. | 0,39 | 0,00 | 11,20 | 2,33 | 1,5385 | -0,0393 | |||
| PSX / Phillips 66 | 0,09 | 5,75 | 10,98 | 2,17 | 1,5077 | -0,0411 | |||
| ETR / Entergy Corporation | 0,13 | 16,07 | 10,81 | 12,86 | 1,4843 | 0,1040 | |||
| LRCX / Lam Research Corporation | 0,11 | 0,00 | 10,42 | 33,90 | 1,4307 | 0,3093 | |||
| MO / Altria Group, Inc. | 0,18 | 0,00 | 10,27 | -2,32 | 1,4114 | -0,1050 | |||
| NVDA / NVIDIA Corporation | 0,07 | 0,00 | 10,27 | 45,78 | 1,4107 | 0,3951 | |||
| VZ / Verizon Communications Inc. | 0,24 | 9,26 | 10,21 | 4,23 | 1,4027 | -0,0097 | |||
| HD / The Home Depot, Inc. | 0,03 | 0,00 | 9,53 | 0,04 | 1,3095 | -0,0642 | |||
| PRU / Prudential Financial, Inc. | 0,09 | 4,82 | 9,35 | 0,84 | 1,2840 | -0,0523 | |||
| KVUE / Kenvue Inc. | 0,45 | 11,25 | 9,31 | -2,91 | 1,2794 | -0,1034 | |||
| KMB / Kimberly-Clark Corporation | 0,07 | 0,00 | 9,15 | -9,35 | 1,2574 | -0,1984 | |||
| TGT / Target Corporation | 0,09 | 46,67 | 8,68 | 38,65 | 1,1925 | 0,2898 | |||
| BAC / Bank of America Corporation | 0,18 | 0,00 | 8,52 | 13,39 | 1,1700 | 0,0871 | |||
| EBGEF / Enbridge Inc. - Preferred Stock | 0,16 | 57,42 | 7,46 | 61,02 | 1,0241 | 0,3565 | |||
| BTI / British American Tobacco p.l.c. - Depositary Receipt (Common Stock) | 0,16 | 0,00 | 7,45 | 14,41 | 1,0240 | 0,0846 | |||
| PFE / Pfizer Inc. | 0,30 | -20,83 | 7,37 | -24,28 | 1,0122 | -0,3906 | |||
| BLK / BlackRock, Inc. | 0,01 | -22,22 | 7,34 | -13,78 | 1,0089 | -0,2191 | |||
| APD / Air Products and Chemicals, Inc. | 0,03 | 0,00 | 7,33 | -4,36 | 1,0074 | -0,0981 | |||
| KO / The Coca-Cola Company | 0,10 | 25,00 | 7,08 | 23,49 | 0,9719 | 0,1459 | |||
| LNG / Cheniere Energy, Inc. | 0,03 | -25,64 | 7,06 | -21,74 | 0,9701 | -0,3309 | |||
| DELL / Dell Technologies Inc. | 0,06 | 26,67 | 6,99 | 70,40 | 0,9599 | 0,3686 | |||
| LMT / Lockheed Martin Corporation | 0,01 | 0,00 | 6,95 | 3,69 | 0,9543 | -0,0117 | |||
| EVRG / Evergy, Inc. | 0,10 | 25,00 | 6,89 | 24,96 | 0,9469 | 0,1517 | |||
| CME / CME Group Inc. | 0,03 | 0,00 | 6,89 | 3,89 | 0,9465 | -0,0096 | |||
| GPC / Genuine Parts Company | 0,06 | 0,00 | 6,67 | 1,83 | 0,9165 | -0,0282 | |||
| TXN / Texas Instruments Incorporated | 0,03 | -21,95 | 6,64 | -9,83 | 0,9126 | -0,1495 | |||
| IBM / International Business Machines Corporation | 0,02 | 0,00 | 6,49 | 18,56 | 0,8908 | 0,1022 | |||
| MRK / Merck & Co., Inc. | 0,08 | -19,00 | 6,41 | -28,58 | 0,8808 | -0,4132 | |||
| PM / Philip Morris International Inc. | 0,04 | -25,53 | 6,37 | -14,56 | 0,8756 | -0,1999 | |||
| PAYX / Paychex, Inc. | 0,04 | 0,00 | 6,25 | -5,73 | 0,8592 | -0,0972 | |||
| UPS / United Parcel Service, Inc. | 0,06 | 1,75 | 5,85 | -6,62 | 0,8042 | -0,0996 | |||
| MCD / McDonald's Corporation | 0,02 | 0,00 | 5,84 | -6,47 | 0,8027 | -0,0980 | |||
| ORI / Old Republic International Corporation | 0,15 | -25,00 | 5,77 | -26,49 | 0,7921 | -0,3388 | |||
| UNM / Unum Group | 0,07 | 0,00 | 5,65 | -0,86 | 0,7766 | -0,0455 | |||
| VST / Vistra Corp. | 0,03 | -3,45 | 5,43 | 59,35 | 0,7454 | 0,2545 | |||
| KLAC / KLA Corporation | 0,01 | 0,00 | 5,37 | 31,78 | 0,7383 | 0,1502 | |||
| V / Visa Inc. | 0,01 | 0,00 | 5,33 | 1,31 | 0,7316 | -0,0263 | |||
| AFG / American Financial Group, Inc. | 0,04 | 0,00 | 5,17 | -3,90 | 0,7108 | -0,0655 | |||
| BKR / Baker Hughes Company | 0,13 | 0,00 | 5,06 | -12,77 | 0,6952 | -0,1412 | |||
| LYB / LyondellBasell Industries N.V. | 0,08 | 20,00 | 4,86 | -1,38 | 0,6676 | -0,0428 | |||
| AR / Antero Resources Corporation | 0,12 | -14,29 | 4,83 | -14,63 | 0,6640 | -0,1522 | |||
| GPOR / Gulfport Energy Corporation | 0,02 | 0,00 | 4,83 | 9,26 | 0,6632 | 0,0261 | |||
| TT / Trane Technologies plc | 0,01 | 0,00 | 4,81 | 29,82 | 0,6609 | 0,1266 | |||
| NRG / NRG Energy, Inc. | 0,03 | -12,50 | 4,50 | 47,22 | 0,6176 | 0,1772 | |||
| VRT / Vertiv Holdings Co | 0,04 | -7,89 | 4,49 | 63,84 | 0,6174 | 0,2218 | |||
| TRGP / Targa Resources Corp. | 0,03 | -3,85 | 4,35 | -16,50 | 0,5978 | -0,1536 | |||
| AAPL / Apple Inc. | 0,02 | 0,00 | 4,31 | -7,63 | 0,5919 | -0,0806 | |||
| VLO / Valero Energy Corporation | 0,03 | 0,00 | 4,30 | 1,77 | 0,5909 | -0,0184 | |||
| ITW / Illinois Tool Works Inc. | 0,02 | 0,00 | 4,20 | -0,31 | 0,5774 | -0,0304 | |||
| NET / Cloudflare, Inc. | 0,02 | 0,00 | 4,11 | 73,80 | 0,5649 | 0,2237 | |||
| INTU / Intuit Inc. | 0,01 | 0,00 | 3,94 | 28,32 | 0,5410 | 0,0984 | |||
| MA / Mastercard Incorporated | 0,01 | 0,00 | 3,93 | 2,53 | 0,5403 | -0,0128 | |||
| FSLR / First Solar, Inc. | 0,02 | 9,52 | 3,81 | 43,39 | 0,5230 | 0,1402 | |||
| SBUX / Starbucks Corporation | 0,04 | 0,00 | 3,67 | -6,58 | 0,5035 | -0,0622 | |||
| ALL / The Allstate Corporation | 0,02 | 3,62 | 0,4978 | 0,4978 | |||||
| AROC / Archrock, Inc. | 0,14 | 180,00 | 3,48 | 164,94 | 0,4775 | 0,2884 | |||
| KGS / Kodiak Gas Services, Inc. | 0,09 | 20,27 | 3,05 | 10,51 | 0,4190 | 0,0210 | |||
| MSFT / Microsoft Corporation | 0,01 | 0,00 | 2,98 | 32,50 | 0,4100 | 0,0853 | |||
| WM / Waste Management, Inc. | 0,01 | 0,00 | 2,97 | -1,16 | 0,4086 | -0,0253 | |||
| AES / The AES Corporation | 0,28 | -55,56 | 2,95 | -62,36 | 0,4046 | -0,7234 | |||
| GJR / Strats Trust For Procter & Gambel Security - Preferred Security | 0,02 | 0,00 | 2,87 | -6,52 | 0,3939 | -0,0483 | |||
| CTRA / Coterra Energy Inc. | 0,11 | -64,52 | 2,79 | -68,85 | 0,3835 | -0,9081 | |||
| SLB / Schlumberger Limited | 0,08 | 0,00 | 2,70 | -19,14 | 0,3714 | -0,1106 | |||
| EXC / Exelon Corporation | 0,06 | 0,00 | 2,69 | -5,74 | 0,3698 | -0,0421 | |||
| EE / Excelerate Energy, Inc. | 0,09 | 0,00 | 2,64 | 2,21 | 0,3625 | -0,0096 | |||
| SPGI / S&P Global Inc. | 0,01 | 0,00 | 2,64 | 3,78 | 0,3622 | -0,0041 | |||
| PBA / Pembina Pipeline Corporation | 0,07 | -22,22 | 2,63 | -27,12 | 0,3607 | -0,1587 | |||
| DE / Deere & Company | 0,01 | 0,00 | 2,54 | 8,35 | 0,3492 | 0,0109 | |||
| CYBR / CyberArk Software Ltd. | 0,01 | 100,00 | 2,44 | 140,73 | 0,3353 | 0,1892 | |||
| COP / ConocoPhillips | 0,03 | 12,50 | 2,42 | -3,89 | 0,3328 | -0,0305 | |||
| AMD / Advanced Micro Devices, Inc. | 0,02 | 0,00 | 2,41 | 38,14 | 0,3314 | 0,0796 | |||
| FANG / Diamondback Energy, Inc. | 0,02 | -15,00 | 2,34 | -26,96 | 0,3209 | -0,1401 | |||
| EQT / EQT Corporation | 0,04 | -50,00 | 2,33 | -45,44 | 0,3204 | -0,2958 | |||
| PPC / Pilgrim's Pride Corporation | 0,05 | 1 370,59 | 2,25 | 1 115,68 | 0,3089 | 0,2822 | |||
| LOW / Lowe's Companies, Inc. | 0,01 | 0,00 | 2,22 | -4,89 | 0,3048 | -0,0315 | |||
| KMI / Kinder Morgan, Inc. | 0,07 | 0,00 | 2,21 | 3,09 | 0,3029 | -0,0056 | |||
| MNDY / monday.com Ltd. | 0,01 | 40,00 | 2,20 | 81,15 | 0,3024 | 0,1271 | |||
| DOCN / DigitalOcean Holdings, Inc. | 0,07 | 15,38 | 2,14 | -1,29 | 0,2942 | -0,0187 | |||
| TMO / Thermo Fisher Scientific Inc. | 0,01 | 0,00 | 2,03 | -18,53 | 0,2785 | -0,0802 | |||
| GEV / GE Vernova Inc. | 0,00 | -24,00 | 2,01 | 31,72 | 0,2762 | 0,0562 | |||
| GTLS / Chart Industries, Inc. | 0,01 | 9,09 | 1,98 | 24,45 | 0,2714 | 0,0425 | |||
| UNH / UnitedHealth Group Incorporated | 0,01 | 50,00 | 1,87 | -10,69 | 0,2571 | -0,0449 | |||
| PRIM / Primoris Services Corporation | 0,02 | 100,00 | 1,87 | 171,80 | 0,2570 | 0,1576 | |||
| PNC / The PNC Financial Services Group, Inc. | 0,01 | 0,00 | 1,86 | 6,09 | 0,2561 | 0,0027 | |||
| FDX / FedEx Corporation | 0,01 | 0,00 | 1,59 | -6,74 | 0,2186 | -0,0274 | |||
| EW / Edwards Lifesciences Corporation | 0,02 | 0,00 | 1,56 | 7,94 | 0,2149 | 0,0059 | |||
| CAT / Caterpillar Inc. | 0,00 | 0,00 | 1,55 | 17,66 | 0,2133 | 0,0231 | |||
| FTI / TechnipFMC plc | 0,04 | 0,00 | 1,38 | 8,68 | 0,1892 | 0,0065 | |||
| MOD / Modine Manufacturing Company | 0,01 | 0,00 | 1,28 | 28,39 | 0,1759 | 0,0321 | |||
| TSLA / Tesla, Inc. | 0,00 | 0,00 | 1,27 | 22,59 | 0,1745 | 0,0251 | |||
| CCJ / Cameco Corporation | 0,02 | 1,26 | 0,1733 | 0,1733 | |||||
| CHK / Chesapeake Energy Corporation | 0,01 | 1,17 | 0,1606 | 0,1606 | |||||
| TPL / Texas Pacific Land Corporation | 0,00 | 37,50 | 1,16 | 9,73 | 0,1596 | 0,0068 | |||
| TS / Tenaris S.A. - Depositary Receipt (Common Stock) | 0,03 | 12,00 | 1,05 | 7,16 | 0,1438 | 0,0029 | |||
| CSCO / Cisco Systems, Inc. | 0,01 | -66,67 | 1,04 | -62,54 | 0,1430 | -0,2574 | |||
| NXT / Nextracker Inc. | 0,02 | -40,62 | 1,03 | -23,37 | 0,1419 | -0,0525 | |||
| DINO / HF Sinclair Corporation | 0,03 | -37,50 | 1,03 | -21,90 | 0,1411 | -0,0485 | |||
| CEG / Constellation Energy Corporation | 0,00 | 0,97 | 0,1330 | 0,1330 | |||||
| PWR / Quanta Services, Inc. | 0,00 | -16,67 | 0,95 | 24,02 | 0,1298 | 0,0199 | |||
| NE / Noble Corporation plc | 0,04 | 0,93 | 0,1276 | 0,1276 | |||||
| SHLS / Shoals Technologies Group, Inc. | 0,20 | -9,30 | 0,83 | 16,13 | 0,1138 | 0,0109 | |||
| GNRC / Generac Holdings Inc. | 0,01 | 0,00 | 0,72 | 13,11 | 0,0984 | 0,0071 | |||
| HAL / Halliburton Company | 0,03 | 0,00 | 0,61 | -19,71 | 0,0840 | -0,0257 | |||
| PTEN / Patterson-UTI Energy, Inc. | 0,10 | 0,00 | 0,59 | -27,86 | 0,0815 | -0,0370 | |||
| ARRY / Array Technologies, Inc. | 0,07 | -22,22 | 0,41 | -5,71 | 0,0567 | -0,0065 | |||
| PBR / Petróleo Brasileiro S.A. - Petrobras - Depositary Receipt (Common Stock) | 0,02 | 0,00 | 0,29 | -12,77 | 0,0395 | -0,0080 | |||
| BBY / Best Buy Co., Inc. | 0,00 | 60,00 | 0,27 | 45,65 | 0,0369 | 0,0104 | |||
| XPRO / Expro Group Holdings N.V. | 0,03 | -70,00 | 0,26 | -74,14 | 0,0354 | -0,1079 | |||
| ES / Eversource Energy | 0,00 | 0,00 | 0,25 | 2,42 | 0,0350 | -0,0009 | |||
| USB / U.S. Bancorp | 0,01 | 0,00 | 0,24 | 7,11 | 0,0332 | 0,0007 | |||
| DOW / Dow Inc. | 0,01 | 0,00 | 0,24 | -24,20 | 0,0327 | -0,0126 | |||
| LPG / Dorian LPG Ltd. | 0,01 | 0,00 | 0,22 | 8,96 | 0,0301 | 0,0012 | |||
| D / Dominion Energy, Inc. | 0,00 | 0,00 | 0,20 | 0,51 | 0,0272 | -0,0011 | |||
| RIO / Rio Tinto Group - Depositary Receipt (Common Stock) | 0,00 | -33,33 | 0,17 | -35,56 | 0,0240 | -0,0149 | |||
| POR / Portland General Electric Company | 0,00 | 0,00 | 0,16 | -8,99 | 0,0223 | -0,0034 | |||
| STX / Seagate Technology Holdings plc | 0,00 | -50,00 | 0,14 | -14,79 | 0,0198 | -0,0047 | |||
| RF / Regions Financial Corporation | 0,01 | 0,00 | 0,14 | 8,46 | 0,0194 | 0,0006 | |||
| BKE / The Buckle, Inc. | 0,00 | 0,00 | 0,14 | 19,30 | 0,0187 | 0,0021 | |||
| BCE / BCE Inc. | 0,01 | 0,00 | 0,13 | -2,92 | 0,0183 | -0,0016 | |||
| TFC / Truist Financial Corporation | 0,00 | 0,00 | 0,13 | 4,07 | 0,0177 | -0,0001 | |||
| ING / ING Groep N.V. - Depositary Receipt (Common Stock) | 0,01 | 0,11 | 0,0150 | 0,0150 | |||||
| WHR / Whirlpool Corporation | 0,00 | 0,00 | 0,10 | 12,22 | 0,0139 | 0,0009 | |||
| BHP / BHP Group Limited - Depositary Receipt (Common Stock) | 0,00 | -33,33 | 0,10 | -33,79 | 0,0132 | -0,0078 | |||
| UMC / United Microelectronics Corporation - Depositary Receipt (Common Stock) | 0,01 | 0,09 | 0,0126 | 0,0126 | |||||
| WEN / The Wendy's Company | 0,01 | 0,00 | 0,09 | -22,22 | 0,0125 | -0,0043 | |||
| SOBO / South Bow Corporation | 0,00 | -92,36 | 0,06 | -92,26 | 0,0085 | -0,1070 | |||
| TROW / T. Rowe Price Group, Inc. | 0,00 | 0,00 | 0,06 | 3,64 | 0,0080 | 0,0000 | |||
| PARR / Par Pacific Holdings, Inc. | 0,00 | -100,00 | 0,00 | 0,0000 | |||||
| SNY / Sanofi - Depositary Receipt (Common Stock) | 0,00 | -100,00 | 0,00 | 0,0000 | |||||
| NVS / Novartis AG - Depositary Receipt (Common Stock) | 0,00 | -100,00 | 0,00 | 0,0000 | |||||
| SWKS / Skyworks Solutions, Inc. | 0,00 | -100,00 | 0,00 | 0,0000 |