Statistiques de base
| Valeur du portefeuille | $ 1 163 366 126 |
| Positions actuelles | 133 |
Dernières positions, performances, ASG (à partir des dépôts 13F, 13D)
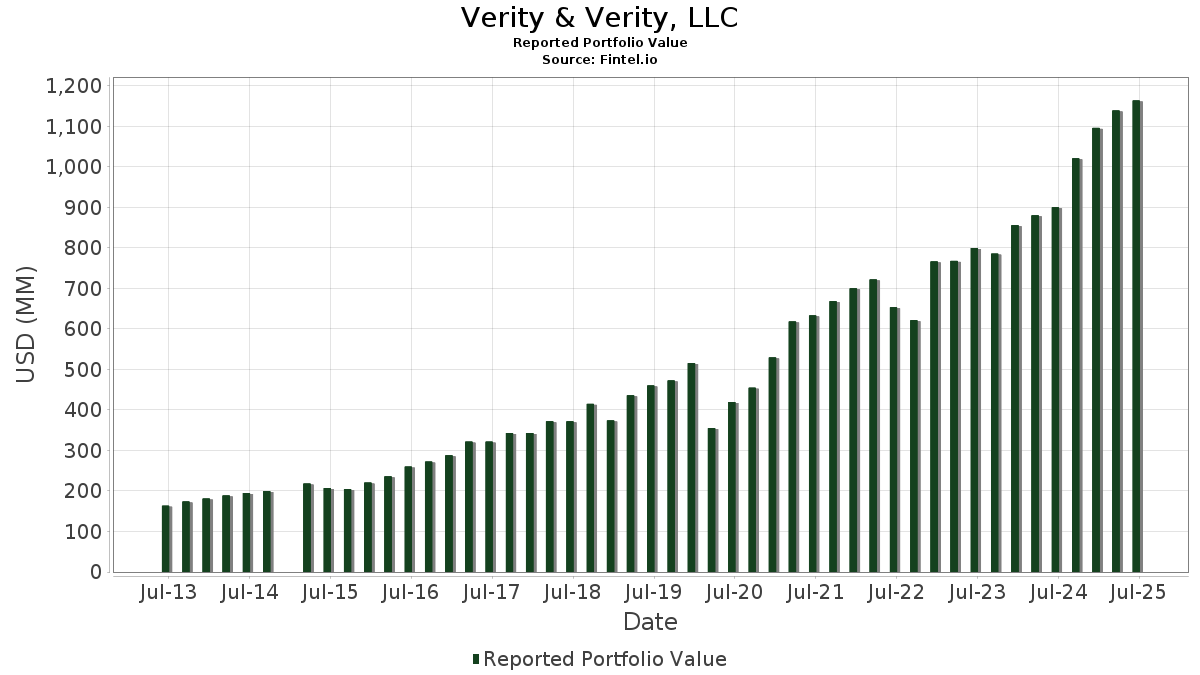
Verity & Verity, LLC a déclaré un total de 133 positions dans ses derniers dépôts auprès de la SEC. La valeur la plus récente du portefeuille est calculée à 1 163 366 126 USD. Les actifs sous gestion réels (ASG) sont cette valeur plus les liquidités (qui ne sont pas divulguées). Les principales positions de Verity & Verity, LLC sont Broadcom Inc. (US:AVGO) , Microsoft Corporation (US:MSFT) , JPMorgan Chase & Co. (US:JPM) , RTX Corporation (US:RTX) , and AbbVie Inc. (US:ABBV) . Les nouvelles positions de Verity & Verity, LLC incluent Atlantic Union Bankshares Corporation (US:AUB) , Zoetis Inc. (US:ZTS) , The Select Sector SPDR Trust - The Utilities Select Sector SPDR Fund (US:XLU) , Oscar Health, Inc. (US:OSCR) , and Eaton Corporation plc (US:ETN) .
Meilleures augmentations ce trimestre
Nous utilisons la variation de l'allocation du portefeuille car il s'agit de l'indicateur le plus significatif. Les changements peuvent être dus à des transactions ou à des variations de prix des actions.
| Titre | Actions (en millions) |
Valeur ($ en millions) |
% du portefeuille | ΔPortefeuille % |
|---|---|---|---|---|
| 0,21 | 58,79 | 5,0536 | 1,8801 | |
| 0,39 | 12,17 | 1,0464 | 1,0464 | |
| 0,13 | 11,55 | 0,9929 | 0,9929 | |
| 0,09 | 9,76 | 0,8387 | 0,8387 | |
| 0,96 | 18,42 | 1,5830 | 0,7557 | |
| 0,08 | 37,85 | 3,2538 | 0,7271 | |
| 0,13 | 16,01 | 1,3762 | 0,5436 | |
| 0,27 | 28,47 | 2,4476 | 0,4252 | |
| 0,12 | 35,96 | 3,0911 | 0,3748 | |
| 0,18 | 18,14 | 1,5590 | 0,3690 |
Principales baisses ce trimestre
Nous utilisons la variation de l'allocation du portefeuille car il s'agit de l'indicateur le plus significatif. Les changements peuvent être dus à des transactions ou à des variations de prix des actions.
| Titre | Actions (en millions) |
Valeur ($ en millions) |
% du portefeuille | ΔPortefeuille % |
|---|---|---|---|---|
| 0,38 | 9,12 | 0,7843 | -1,1473 | |
| 0,26 | 11,53 | 0,9910 | -0,9665 | |
| 0,02 | 0,83 | 0,0709 | -0,7039 | |
| 0,32 | 17,09 | 1,4691 | -0,6657 | |
| 0,28 | 31,46 | 2,7044 | -0,5189 | |
| 0,21 | 30,55 | 2,6264 | -0,4986 | |
| 0,28 | 22,91 | 1,9694 | -0,4755 | |
| 0,17 | 31,96 | 2,7474 | -0,4460 | |
| 0,06 | 10,35 | 0,8892 | -0,3457 | |
| 0,27 | 11,53 | 0,9911 | -0,3206 |
Déclarations 13F et dépôts de fonds
Ce formulaire a été déposé le 2025-08-12 pour la période de déclaration 2025-06-30. Cliquez sur l'icône du lien pour voir l'historique complet des transactions.
Mettre à niveau pour débloquer les données premium et exporter vers Excel ![]() .
.
| Titre | Type | Prix moyen de l'action | Actions (en millions) |
ΔActions (%) |
ΔActions (%) |
Valeur ($ en millions) |
Portefeuille (%) |
ΔPortefeuille (%) |
|
|---|---|---|---|---|---|---|---|---|---|
| AVGO / Broadcom Inc. | 0,21 | -1,18 | 58,79 | 62,70 | 5,0536 | 1,8801 | |||
| MSFT / Microsoft Corporation | 0,08 | -0,71 | 37,85 | 31,57 | 3,2538 | 0,7271 | |||
| JPM / JPMorgan Chase & Co. | 0,12 | -1,63 | 35,96 | 16,26 | 3,0911 | 0,3748 | |||
| RTX / RTX Corporation | 0,24 | -1,66 | 34,61 | 8,40 | 2,9746 | 0,1711 | |||
| ABBV / AbbVie Inc. | 0,17 | -0,78 | 31,96 | -12,10 | 2,7474 | -0,4460 | |||
| GILD / Gilead Sciences, Inc. | 0,28 | -13,37 | 31,46 | -14,28 | 2,7044 | -0,5189 | |||
| CVX / Chevron Corporation | 0,21 | 0,32 | 30,55 | -14,13 | 2,6264 | -0,4986 | |||
| STT / State Street Corporation | 0,27 | 4,10 | 28,47 | 23,65 | 2,4476 | 0,4252 | |||
| AMGN / Amgen Inc. | 0,10 | 0,96 | 27,11 | -9,52 | 2,3299 | -0,3010 | |||
| PEP / PepsiCo, Inc. | 0,20 | 34,06 | 27,05 | 18,05 | 2,3254 | 0,3130 | |||
| AAPL / Apple Inc. | 0,12 | -0,07 | 25,42 | -7,70 | 2,1853 | -0,2336 | |||
| ENB / Enbridge Inc. | 0,55 | -0,65 | 24,93 | 1,62 | 2,1425 | -0,0116 | |||
| TXN / Texas Instruments Incorporated | 0,11 | 0,36 | 23,16 | 15,95 | 1,9905 | 0,2367 | |||
| OKE / ONEOK, Inc. | 0,28 | 0,03 | 22,91 | -17,70 | 1,9694 | -0,4755 | |||
| VZ / Verizon Communications Inc. | 0,53 | -2,33 | 22,91 | -6,83 | 1,9692 | -0,1901 | |||
| PRU / Prudential Financial, Inc. | 0,19 | -0,16 | 20,31 | -3,95 | 1,7457 | -0,1112 | |||
| CSCO / Cisco Systems, Inc. | 0,28 | -1,62 | 19,63 | 10,61 | 1,6871 | 0,1287 | |||
| NEE / NextEra Energy, Inc. | 0,28 | 0,41 | 19,42 | -1,68 | 1,6696 | -0,0652 | |||
| IBM / International Business Machines Corporation | 0,07 | -7,99 | 19,34 | 9,08 | 1,6620 | 0,1053 | |||
| MET / MetLife, Inc. | 0,24 | -1,30 | 19,29 | -1,14 | 1,6578 | -0,0555 | |||
| NNN / NNN REIT, Inc. | 0,44 | -1,36 | 19,20 | -0,14 | 1,6505 | -0,0380 | |||
| VICI / VICI Properties Inc. | 0,57 | 0,18 | 18,48 | 0,12 | 1,5887 | -0,0325 | |||
| OWL / Blue Owl Capital Inc. | 0,96 | 103,95 | 18,42 | 95,51 | 1,5830 | 0,7557 | |||
| UPS / United Parcel Service, Inc. | 0,18 | 45,85 | 18,14 | 33,85 | 1,5590 | 0,3690 | |||
| MO / Altria Group, Inc. | 0,31 | -0,21 | 17,98 | -2,52 | 1,5452 | -0,0744 | |||
| LYB / LyondellBasell Industries N.V. | 0,30 | 4,50 | 17,41 | -14,12 | 1,4961 | -0,2837 | |||
| JNJ / Johnson & Johnson | 0,11 | -0,01 | 17,33 | -7,91 | 1,4900 | -0,1629 | |||
| XOM / Exxon Mobil Corporation | 0,16 | -1,07 | 17,09 | -10,33 | 1,4694 | -0,2047 | |||
| GLW / Corning Incorporated | 0,32 | -38,80 | 17,09 | -29,69 | 1,4691 | -0,6657 | |||
| MDT / Medtronic plc | 0,19 | -1,12 | 16,91 | -4,08 | 1,4537 | -0,0946 | |||
| TGT / Target Corporation | 0,16 | 5,98 | 16,26 | 0,18 | 1,3973 | -0,0277 | |||
| DELL / Dell Technologies Inc. | 0,13 | 25,55 | 16,01 | 68,86 | 1,3762 | 0,5436 | |||
| LMT / Lockheed Martin Corporation | 0,03 | 0,25 | 15,65 | 3,94 | 1,3452 | 0,0229 | |||
| CNQ / Canadian Natural Resources Limited | 0,49 | 1,07 | 15,41 | 3,04 | 1,3243 | 0,0112 | |||
| CMCSA / Comcast Corporation | 0,43 | 1,25 | 15,40 | -2,07 | 1,3239 | -0,0573 | |||
| CINF / Cincinnati Financial Corporation | 0,10 | -0,82 | 15,05 | -0,01 | 1,2939 | -0,0283 | |||
| GPC / Genuine Parts Company | 0,12 | 1,73 | 14,34 | 3,58 | 1,2323 | 0,0168 | |||
| SBUX / Starbucks Corporation | 0,15 | 27,21 | 14,08 | 18,83 | 1,2102 | 0,1697 | |||
| FNF / Fidelity National Financial, Inc. | 0,24 | -0,14 | 13,68 | -13,98 | 1,1756 | -0,2207 | |||
| AJG / Arthur J. Gallagher & Co. | 0,04 | 0,09 | 13,22 | -7,19 | 1,1366 | -0,1146 | |||
| WEC / WEC Energy Group, Inc. | 0,12 | 9,69 | 13,02 | 4,87 | 1,1190 | 0,0289 | |||
| AMP / Ameriprise Financial, Inc. | 0,02 | -0,34 | 12,97 | 9,88 | 1,1152 | 0,0783 | |||
| PSX / Phillips 66 | 0,11 | 1,42 | 12,66 | -2,01 | 1,0881 | -0,0465 | |||
| PG / The Procter & Gamble Company | 0,08 | -1,61 | 12,53 | -8,02 | 1,0768 | -0,1192 | |||
| PLD / Prologis, Inc. | 0,12 | 1,23 | 12,18 | -4,82 | 1,0467 | -0,0767 | |||
| AUB / Atlantic Union Bankshares Corporation | 0,39 | 12,17 | 1,0464 | 1,0464 | |||||
| SO / The Southern Company | 0,13 | -1,29 | 12,03 | -1,43 | 1,0342 | -0,0377 | |||
| PPH / VanEck ETF Trust - VanEck Pharmaceutical ETF | 0,13 | 11,55 | 0,9929 | 0,9929 | |||||
| TFC / Truist Financial Corporation | 0,27 | -26,11 | 11,53 | -22,81 | 0,9911 | -0,3206 | |||
| OGE / OGE Energy Corp. | 0,26 | -46,44 | 11,53 | -48,28 | 0,9910 | -0,9665 | |||
| CMI / Cummins Inc. | 0,04 | -1,65 | 11,46 | 2,75 | 0,9854 | 0,0057 | |||
| HSY / The Hershey Company | 0,06 | -24,18 | 10,35 | -26,43 | 0,8892 | -0,3457 | |||
| QCOM / QUALCOMM Incorporated | 0,06 | 0,60 | 10,26 | 4,30 | 0,8819 | 0,0180 | |||
| CNI / Canadian National Railway Company | 0,09 | 9,76 | 0,8387 | 0,8387 | |||||
| PFE / Pfizer Inc. | 0,38 | -56,64 | 9,12 | -58,52 | 0,7843 | -1,1473 | |||
| HD / The Home Depot, Inc. | 0,02 | -1,24 | 8,94 | -1,20 | 0,7686 | -0,0262 | |||
| ABT / Abbott Laboratories | 0,06 | -1,15 | 7,88 | 1,35 | 0,6775 | -0,0055 | |||
| LOW / Lowe's Companies, Inc. | 0,03 | 0,01 | 7,18 | -4,85 | 0,6170 | -0,0456 | |||
| VYM / Vanguard Whitehall Funds - Vanguard High Dividend Yield ETF | 0,05 | 4,63 | 6,66 | 8,16 | 0,5721 | 0,0317 | |||
| PM / Philip Morris International Inc. | 0,03 | 2,77 | 5,26 | 17,93 | 0,4523 | 0,0604 | |||
| KO / The Coca-Cola Company | 0,06 | -0,09 | 4,59 | -1,29 | 0,3949 | -0,0139 | |||
| BRK.A / Berkshire Hathaway Inc. | 0,00 | 0,00 | 3,64 | -8,72 | 0,3132 | -0,0374 | |||
| EPD / Enterprise Products Partners L.P. - Limited Partnership | 0,10 | -1,63 | 3,14 | -10,63 | 0,2695 | -0,0386 | |||
| ACN / Accenture plc | 0,01 | -2,13 | 2,70 | -6,28 | 0,2322 | -0,0209 | |||
| ORCL / Oracle Corporation | 0,01 | 0,68 | 2,64 | 57,40 | 0,2268 | 0,0796 | |||
| BDX / Becton, Dickinson and Company | 0,02 | 1,03 | 2,61 | -24,02 | 0,2244 | -0,0774 | |||
| WMT / Walmart Inc. | 0,03 | 1,51 | 2,59 | 13,05 | 0,2227 | 0,0215 | |||
| PH / Parker-Hannifin Corporation | 0,00 | 0,61 | 2,43 | 15,63 | 0,2086 | 0,0243 | |||
| VIG / Vanguard Specialized Funds - Vanguard Dividend Appreciation ETF | 0,01 | 4,62 | 2,42 | 10,37 | 0,2076 | 0,0154 | |||
| BRK.B / Berkshire Hathaway Inc. | 0,00 | 0,00 | 1,95 | -8,81 | 0,1674 | -0,0201 | |||
| BX / Blackstone Inc. | 0,01 | 3,19 | 1,81 | 10,45 | 0,1554 | 0,0116 | |||
| AFG / American Financial Group, Inc. | 0,01 | 0,00 | 1,60 | -3,86 | 0,1372 | -0,0087 | |||
| MLPX / Global X Funds - Global X MLP & Energy Infrastructure ETF | 0,02 | 0,00 | 1,51 | -1,82 | 0,1299 | -0,0053 | |||
| V / Visa Inc. | 0,00 | -7,40 | 1,42 | -6,21 | 0,1221 | -0,0109 | |||
| MS / Morgan Stanley | 0,01 | -3,21 | 1,24 | 16,84 | 0,1062 | 0,0134 | |||
| BAC / Bank of America Corporation | 0,03 | 3,07 | 1,20 | 16,88 | 0,1030 | 0,0130 | |||
| CPSS / Consumer Portfolio Services, Inc. | 0,12 | -1,66 | 1,16 | 11,49 | 0,1001 | 0,0084 | |||
| ADP / Automatic Data Processing, Inc. | 0,00 | 8,90 | 1,07 | 9,89 | 0,0918 | 0,0065 | |||
| PPG / PPG Industries, Inc. | 0,01 | -4,41 | 1,03 | -0,58 | 0,0889 | -0,0024 | |||
| MCD / McDonald's Corporation | 0,00 | -5,38 | 1,03 | -11,58 | 0,0887 | -0,0137 | |||
| KVUE / Kenvue Inc. | 0,05 | 12,33 | 1,01 | -1,93 | 0,0872 | -0,0037 | |||
| NDAQ / Nasdaq, Inc. | 0,01 | 7,80 | 1,01 | 27,07 | 0,0872 | 0,0171 | |||
| COST / Costco Wholesale Corporation | 0,00 | 0,00 | 0,98 | 4,72 | 0,0839 | 0,0020 | |||
| KLAC / KLA Corporation | 0,00 | 6,24 | 0,87 | 39,94 | 0,0748 | 0,0202 | |||
| NVDA / NVIDIA Corporation | 0,01 | -2,27 | 0,85 | 42,45 | 0,0730 | 0,0206 | |||
| AXP / American Express Company | 0,00 | -19,99 | 0,83 | -5,05 | 0,0711 | -0,0055 | |||
| ADM / Archer-Daniels-Midland Company | 0,02 | -91,49 | 0,83 | -90,65 | 0,0709 | -0,7039 | |||
| UNH / UnitedHealth Group Incorporated | 0,00 | 16,61 | 0,80 | -30,54 | 0,0691 | -0,0325 | |||
| META / Meta Platforms, Inc. | 0,00 | 9,70 | 0,75 | 40,64 | 0,0646 | 0,0176 | |||
| ITW / Illinois Tool Works Inc. | 0,00 | -1,25 | 0,66 | -1,63 | 0,0572 | -0,0022 | |||
| IVV / iShares Trust - iShares Core S&P 500 ETF | 0,00 | -27,17 | 0,65 | -19,58 | 0,0555 | -0,0150 | |||
| NKE / NIKE, Inc. | 0,01 | 9,26 | 0,58 | 22,18 | 0,0503 | 0,0083 | |||
| WSO / Watsco, Inc. | 0,00 | 0,30 | 0,58 | -12,86 | 0,0502 | -0,0086 | |||
| SYY / Sysco Corporation | 0,01 | 8,46 | 0,58 | 9,49 | 0,0496 | 0,0033 | |||
| SCHD / Schwab Strategic Trust - Schwab U.S. Dividend Equity ETF | 0,02 | 1,50 | 0,57 | -3,87 | 0,0491 | -0,0030 | |||
| ZTS / Zoetis Inc. | 0,00 | 0,55 | 0,0474 | 0,0474 | |||||
| ED / Consolidated Edison, Inc. | 0,01 | 24,55 | 0,55 | 13,07 | 0,0469 | 0,0045 | |||
| INTU / Intuit Inc. | 0,00 | 4,59 | 0,54 | 34,16 | 0,0463 | 0,0110 | |||
| FDS / FactSet Research Systems Inc. | 0,00 | 8,05 | 0,53 | 6,37 | 0,0459 | 0,0018 | |||
| HBAN / Huntington Bancshares Incorporated | 0,03 | -17,53 | 0,50 | -7,98 | 0,0427 | -0,0047 | |||
| NVS / Novartis AG - Depositary Receipt (Common Stock) | 0,00 | 0,46 | 0,0393 | 0,0393 | |||||
| ES / Eversource Energy | 0,01 | 3,11 | 0,42 | 5,60 | 0,0357 | 0,0012 | |||
| DUK / Duke Energy Corporation | 0,00 | -22,09 | 0,41 | -24,49 | 0,0352 | -0,0125 | |||
| SCHK / Schwab Strategic Trust - Schwab 1000 Index ETF | 0,01 | 0,00 | 0,40 | 10,74 | 0,0346 | 0,0027 | |||
| AFL / Aflac Incorporated | 0,00 | -19,52 | 0,39 | -23,76 | 0,0331 | -0,0112 | |||
| GOOG / Alphabet Inc. | 0,00 | -35,51 | 0,38 | -26,77 | 0,0330 | -0,0130 | |||
| POOL / Pool Corporation | 0,00 | 7,43 | 0,38 | -1,54 | 0,0329 | -0,0013 | |||
| TT / Trane Technologies plc | 0,00 | 0,00 | 0,37 | 29,72 | 0,0319 | 0,0068 | |||
| AMZN / Amazon.com, Inc. | 0,00 | 2,19 | 0,37 | 17,95 | 0,0316 | 0,0042 | |||
| SCHX / Schwab Strategic Trust - Schwab U.S. Large-Cap ETF | 0,01 | 0,00 | 0,35 | 10,90 | 0,0298 | 0,0023 | |||
| TPR / Tapestry, Inc. | 0,00 | 0,90 | 0,34 | 25,64 | 0,0296 | 0,0056 | |||
| WFC / Wells Fargo & Company | 0,00 | 0,00 | 0,34 | 11,55 | 0,0291 | 0,0025 | |||
| GE / General Electric Company | 0,00 | 0,96 | 0,33 | 30,00 | 0,0280 | 0,0060 | |||
| ET / Energy Transfer LP - Limited Partnership | 0,02 | 0,00 | 0,32 | -2,41 | 0,0279 | -0,0013 | |||
| MRK / Merck & Co., Inc. | 0,00 | 10,11 | 0,32 | -2,70 | 0,0279 | -0,0015 | |||
| XLU / The Select Sector SPDR Trust - The Utilities Select Sector SPDR Fund | 0,00 | 0,31 | 0,0270 | 0,0270 | |||||
| BFB / Brown-Forman Corp. - Class B | 0,01 | 10,36 | 0,31 | -12,54 | 0,0264 | -0,0044 | |||
| ADI / Analog Devices, Inc. | 0,00 | 0,00 | 0,29 | 18,07 | 0,0253 | 0,0034 | |||
| KMI / Kinder Morgan, Inc. | 0,01 | 2,84 | 0,29 | 5,84 | 0,0250 | 0,0009 | |||
| EMR / Emerson Electric Co. | 0,00 | 0,00 | 0,29 | 21,70 | 0,0246 | 0,0039 | |||
| BN / Brookfield Corporation | 0,00 | 0,00 | 0,28 | 18,49 | 0,0242 | 0,0033 | |||
| VSCO / Victoria's Secret & Co. | 0,01 | 0,00 | 0,27 | -0,37 | 0,0230 | -0,0006 | |||
| USB / U.S. Bancorp | 0,01 | 0,27 | 0,0230 | 0,0230 | |||||
| OSCR / Oscar Health, Inc. | 0,01 | 0,26 | 0,0220 | 0,0220 | |||||
| CAT / Caterpillar Inc. | 0,00 | -4,10 | 0,25 | 12,89 | 0,0219 | 0,0021 | |||
| CFG / Citizens Financial Group, Inc. | 0,01 | -3,72 | 0,25 | 5,49 | 0,0215 | 0,0006 | |||
| XLI / The Select Sector SPDR Trust - The Industrial Select Sector SPDR Fund | 0,00 | 0,00 | 0,25 | 12,27 | 0,0213 | 0,0020 | |||
| DE / Deere & Company | 0,00 | 0,00 | 0,23 | 8,65 | 0,0195 | 0,0011 | |||
| UL / Unilever PLC - Depositary Receipt (Common Stock) | 0,00 | 0,00 | 0,21 | 2,88 | 0,0184 | 0,0001 | |||
| ETN / Eaton Corporation plc | 0,00 | 0,21 | 0,0178 | 0,0178 | |||||
| IUSG / iShares Trust - iShares Core S&P U.S. Growth ETF | 0,00 | 0,20 | 0,0175 | 0,0175 | |||||
| FAST / Fastenal Company | 0,00 | 70,99 | 0,20 | -7,31 | 0,0175 | -0,0018 | |||
| NMFC / New Mountain Finance Corporation | 0,01 | 0,00 | 0,11 | -4,55 | 0,0091 | -0,0006 | |||
| FIS / Fidelity National Information Services, Inc. | 0,00 | -100,00 | 0,00 | 0,0000 | |||||
| FDX / FedEx Corporation | 0,00 | -100,00 | 0,00 | 0,0000 | |||||
| OMC / Omnicom Group Inc. | 0,00 | -100,00 | 0,00 | 0,0000 | |||||
| IYT / iShares Trust - iShares U.S. Transportation ETF | 0,00 | -100,00 | 0,00 | 0,0000 | |||||
| DFS / Discover Financial Services | 0,00 | -100,00 | 0,00 | 0,0000 |