Statistiques de base
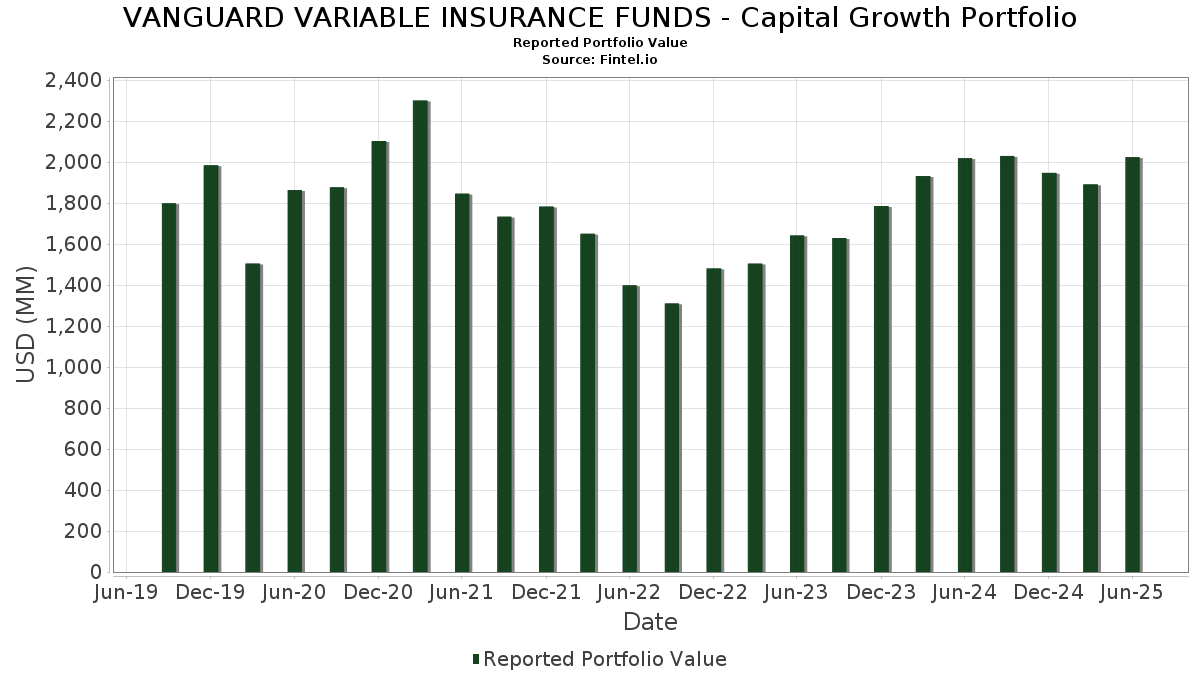
| Valeur du portefeuille | $ 2 023 896 518 |
| Positions actuelles | 125 |
Dernières positions, performances, ASG (à partir des dépôts 13F, 13D)
VANGUARD VARIABLE INSURANCE FUNDS - Capital Growth Portfolio a déclaré un total de 125 positions dans ses derniers dépôts auprès de la SEC. La valeur la plus récente du portefeuille est calculée à 2 023 896 518 USD. Les actifs sous gestion réels (ASG) sont cette valeur plus les liquidités (qui ne sont pas divulguées). Les principales positions de VANGUARD VARIABLE INSURANCE FUNDS - Capital Growth Portfolio sont Eli Lilly and Company (US:LLY) , Microsoft Corporation (US:MSFT) , KLA Corporation (US:KLAC) , Boston Scientific Corporation (US:BSX) , and Micron Technology, Inc. (US:MU) . Les nouvelles positions de VANGUARD VARIABLE INSURANCE FUNDS - Capital Growth Portfolio incluent US Foods Holding Corp. (US:USFD) , Universal Music Group N.V. (NL:UMG) , Netflix, Inc. (US:NFLX) , Edwards Lifesciences Corporation (US:EW) , and Philip Morris International Inc. (US:PM) .
Meilleures augmentations ce trimestre
Nous utilisons la variation de l'allocation du portefeuille car il s'agit de l'indicateur le plus significatif. Les changements peuvent être dus à des transactions ou à des variations de prix des actions.
| Titre | Actions (en millions) |
Valeur ($ en millions) |
% du portefeuille | ΔPortefeuille % |
|---|---|---|---|---|
| 80,19 | 80,18 | 3,9572 | 3,9572 | |
| 0,29 | 26,27 | 1,2964 | 0,8320 | |
| 0,37 | 58,63 | 2,8935 | 0,7689 | |
| 0,22 | 47,92 | 2,3652 | 0,7463 | |
| 0,16 | 77,20 | 3,8099 | 0,7323 | |
| 0,53 | 65,61 | 3,2378 | 0,4953 | |
| 0,08 | 70,49 | 3,4791 | 0,4375 | |
| 0,13 | 42,82 | 2,1133 | 0,2679 | |
| 0,03 | 7,63 | 0,3765 | 0,2466 | |
| 0,08 | 9,52 | 0,4699 | 0,2386 |
Principales baisses ce trimestre
Nous utilisons la variation de l'allocation du portefeuille car il s'agit de l'indicateur le plus significatif. Les changements peuvent être dus à des transactions ou à des variations de prix des actions.
| Titre | Actions (en millions) |
Valeur ($ en millions) |
% du portefeuille | ΔPortefeuille % |
|---|---|---|---|---|
| 0,20 | 157,83 | 7,7894 | -2,6976 | |
| 0,18 | 50,56 | 2,4951 | -1,0280 | |
| 1,19 | 31,04 | 1,5318 | -0,6302 | |
| 0,08 | 31,61 | 1,5599 | -0,6079 | |
| 0,04 | 9,58 | 0,4726 | -0,4800 | |
| 0,22 | 50,08 | 2,4714 | -0,3655 | |
| 0,04 | 2,12 | 0,1044 | -0,3634 | |
| 0,32 | 14,85 | 0,7331 | -0,3008 | |
| 0,33 | 37,27 | 1,8392 | -0,2689 | |
| 0,04 | 16,79 | 0,8284 | -0,2598 |
Déclarations 13F et dépôts de fonds
Ce formulaire a été déposé le 2025-08-27 pour la période de déclaration 2025-06-30. Cliquez sur l'icône du lien pour voir l'historique complet des transactions.
Mettre à niveau pour débloquer les données premium et exporter vers Excel ![]() .
.
| Titre | Type | Prix moyen de l'action | Actions (en millions) |
ΔActions (%) |
ΔActions (%) |
Valeur ($ en millions) |
Portefeuille (%) |
ΔPortefeuille (%) |
|
|---|---|---|---|---|---|---|---|---|---|
| LLY / Eli Lilly and Company | 0,20 | -15,77 | 157,83 | -20,50 | 7,7894 | -2,6976 | |||
| Vanguard Market Liquidity Fund / STIV (N/A) | 80,19 | 80,18 | 3,9572 | 3,9572 | |||||
| MSFT / Microsoft Corporation | 0,16 | 0,00 | 77,20 | 32,51 | 3,8099 | 0,7323 | |||
| KLAC / KLA Corporation | 0,08 | -7,08 | 70,49 | 22,43 | 3,4791 | 0,4375 | |||
| BSX / Boston Scientific Corporation | 0,63 | -5,09 | 67,86 | 1,05 | 3,3492 | -0,1983 | |||
| MU / Micron Technology, Inc. | 0,53 | -10,91 | 65,61 | 26,37 | 3,2378 | 0,4953 | |||
| NVDA / NVIDIA Corporation | 0,37 | 0,00 | 58,63 | 45,78 | 2,8935 | 0,7689 | |||
| AMGN / Amgen Inc. | 0,18 | -15,42 | 50,56 | -24,20 | 2,4951 | -1,0280 | |||
| FDX / FedEx Corporation | 0,22 | 0,00 | 50,08 | -6,76 | 2,4714 | -0,3655 | |||
| AZN / AstraZeneca PLC - Depositary Receipt (Common Stock) | 0,70 | 5,30 | 49,05 | 0,11 | 2,4207 | -0,1675 | |||
| SIE / Siemens Aktiengesellschaft | 0,19 | -6,06 | 48,77 | 4,47 | 2,4070 | -0,0590 | |||
| TXN / Texas Instruments Incorporated | 0,23 | -14,13 | 48,46 | -0,79 | 2,3915 | -0,1885 | |||
| ORCL / Oracle Corporation | 0,22 | 0,00 | 47,92 | 56,38 | 2,3652 | 0,7463 | |||
| GOOGL / Alphabet Inc. | 0,27 | 0,00 | 47,52 | 13,96 | 2,3453 | 0,1425 | |||
| TSLA / Tesla, Inc. | 0,13 | 0,00 | 42,82 | 22,57 | 2,1133 | 0,2679 | |||
| BABA / Alibaba Group Holding Limited - Depositary Receipt (Common Stock) | 0,33 | 8,88 | 37,27 | -6,62 | 1,8392 | -0,2689 | |||
| ADBE / Adobe Inc. | 0,08 | -23,64 | 31,61 | -22,98 | 1,5599 | -0,6079 | |||
| SONY / Sony Group Corporation - Depositary Receipt (Common Stock) | 1,19 | -26,03 | 31,04 | -24,16 | 1,5318 | -0,6302 | |||
| BIIB / Biogen Inc. | 0,24 | 0,00 | 29,87 | -8,22 | 1,4739 | -0,2450 | |||
| INTC / Intel Corporation | 1,30 | 12,48 | 29,06 | 10,94 | 1,4339 | 0,0505 | |||
| WFC / Wells Fargo & Company | 0,36 | -16,84 | 28,96 | -7,19 | 1,4294 | -0,2191 | |||
| GOOG / Alphabet Inc. | 0,16 | 0,00 | 27,76 | 13,55 | 1,3701 | 0,0785 | |||
| JPM / JPMorgan Chase & Co. | 0,09 | 8,59 | 27,11 | 28,34 | 1,3378 | 0,2221 | |||
| SCHW / The Charles Schwab Corporation | 0,29 | 156,37 | 26,27 | 198,83 | 1,2964 | 0,8320 | |||
| V / Visa Inc. | 0,07 | 20,68 | 25,28 | 22,26 | 1,2476 | 0,1553 | |||
| ROST / Ross Stores, Inc. | 0,20 | 0,00 | 25,09 | -0,17 | 1,2385 | -0,0893 | |||
| NVS / Novartis AG - Depositary Receipt (Common Stock) | 0,20 | 0,00 | 24,34 | 8,55 | 1,2013 | 0,0167 | |||
| TJX / The TJX Companies, Inc. | 0,19 | 0,00 | 23,77 | 1,39 | 1,1732 | -0,0654 | |||
| INTU / Intuit Inc. | 0,03 | 0,00 | 22,53 | 28,28 | 1,1117 | 0,1841 | |||
| UAL / United Airlines Holdings, Inc. | 0,28 | -9,49 | 22,34 | 4,38 | 1,1023 | -0,0280 | |||
| NTAP / NetApp, Inc. | 0,21 | 0,00 | 22,14 | 21,30 | 1,0927 | 0,1285 | |||
| AMZN / Amazon.com, Inc. | 0,10 | 0,00 | 21,57 | 15,31 | 1,0643 | 0,0764 | |||
| LUV / Southwest Airlines Co. | 0,65 | 0,00 | 20,98 | -3,39 | 1,0353 | -0,1118 | |||
| GSK / GSK plc - Depositary Receipt (Common Stock) | 0,52 | 16,17 | 19,78 | 15,16 | 0,9760 | 0,0688 | |||
| AIR / Airbus SE | 0,09 | 0,00 | 19,38 | 18,80 | 0,9566 | 0,0948 | |||
| RJF / Raymond James Financial, Inc. | 0,11 | 17,33 | 17,34 | 29,55 | 0,8557 | 0,1487 | |||
| HES / Hess Corporation | 0,12 | 0,00 | 17,23 | -13,27 | 0,8506 | -0,1991 | |||
| TMO / Thermo Fisher Scientific Inc. | 0,04 | 0,00 | 16,79 | -18,51 | 0,8284 | -0,2598 | |||
| ADI / Analog Devices, Inc. | 0,07 | 0,00 | 15,61 | 18,03 | 0,7706 | 0,0717 | |||
| BIDU / Baidu, Inc. - Depositary Receipt (Common Stock) | 0,18 | 0,00 | 15,20 | -6,81 | 0,7500 | -0,1115 | |||
| RCL / Royal Caribbean Cruises Ltd. | 0,05 | 0,00 | 14,97 | 52,42 | 0,7387 | 0,2200 | |||
| BMY / Bristol-Myers Squibb Company | 0,32 | 0,00 | 14,85 | -24,10 | 0,7331 | -0,3008 | |||
| DAL / Delta Air Lines, Inc. | 0,29 | 0,00 | 14,34 | 12,80 | 0,7078 | 0,0362 | |||
| DIS / The Walt Disney Company | 0,11 | 0,00 | 13,80 | 25,64 | 0,6812 | 0,1009 | |||
| CAT / Caterpillar Inc. | 0,03 | 0,00 | 13,28 | 17,71 | 0,6552 | 0,0594 | |||
| MAT / Mattel, Inc. | 0,62 | 0,00 | 12,13 | 1,49 | 0,5987 | -0,0327 | |||
| TDG / TransDigm Group Incorporated | 0,01 | 0,00 | 11,33 | 9,93 | 0,5591 | 0,0147 | |||
| QCOM / QUALCOMM Incorporated | 0,07 | 0,00 | 11,26 | 3,67 | 0,5557 | -0,0180 | |||
| XOM / Exxon Mobil Corporation | 0,10 | 0,00 | 10,37 | -9,35 | 0,5118 | -0,0926 | |||
| ROG / Roche Holding AG | 0,03 | 0,00 | 9,72 | -0,83 | 0,4799 | -0,0380 | |||
| MMC / Marsh & McLennan Companies, Inc. | 0,04 | -40,73 | 9,58 | -46,90 | 0,4726 | -0,4800 | |||
| HPE / Hewlett Packard Enterprise Company | 0,47 | 0,00 | 9,55 | 32,53 | 0,4713 | 0,0907 | |||
| AAPL / Apple Inc. | 0,05 | 0,00 | 9,54 | -7,64 | 0,4708 | -0,0748 | |||
| NTRS / Northern Trust Corporation | 0,08 | 69,14 | 9,52 | 117,37 | 0,4699 | 0,2386 | |||
| META / Meta Platforms, Inc. | 0,01 | 35,79 | 9,52 | 73,90 | 0,4699 | 0,1807 | |||
| BMRN / BioMarin Pharmaceutical Inc. | 0,17 | 0,00 | 9,17 | -22,24 | 0,4528 | -0,1705 | |||
| HPQ / HP Inc. | 0,36 | 0,00 | 8,86 | -11,66 | 0,4374 | -0,0926 | |||
| AAL / American Airlines Group Inc. | 0,75 | 0,00 | 8,43 | 6,34 | 0,4161 | -0,0027 | |||
| ONC / BeOne Medicines AG - Depositary Receipt (Common Stock) | 0,03 | 0,00 | 8,23 | -11,06 | 0,4062 | -0,0826 | |||
| CSCO / Cisco Systems, Inc. | 0,12 | 0,00 | 8,16 | 12,43 | 0,4027 | 0,0193 | |||
| FLUT / Flutter Entertainment plc | 0,03 | 140,54 | 7,63 | 210,25 | 0,3765 | 0,2466 | |||
| COP / ConocoPhillips | 0,08 | 93,81 | 7,30 | 65,62 | 0,3605 | 0,1275 | |||
| WHR / Whirlpool Corporation | 0,07 | 0,00 | 7,19 | 12,52 | 0,3549 | 0,0173 | |||
| UNP / Union Pacific Corporation | 0,03 | -29,83 | 6,76 | -31,66 | 0,3338 | -0,1890 | |||
| ELAN / Elanco Animal Health Incorporated | 0,47 | 0,00 | 6,75 | 35,99 | 0,3331 | 0,0709 | |||
| SYY / Sysco Corporation | 0,09 | 0,00 | 6,75 | 0,93 | 0,3331 | -0,0201 | |||
| TXT / Textron Inc. | 0,08 | 0,00 | 6,19 | 11,13 | 0,3055 | 0,0113 | |||
| GLEN / Glencore plc | 1,58 | 54,53 | 6,16 | 64,52 | 0,3039 | 0,1062 | |||
| DLTR / Dollar Tree, Inc. | 0,06 | 75,37 | 5,92 | 131,42 | 0,2923 | 0,1571 | |||
| MA / Mastercard Incorporated | 0,01 | 121,28 | 5,84 | 126,86 | 0,2884 | 0,1523 | |||
| AMAT / Applied Materials, Inc. | 0,03 | 0,00 | 5,82 | 26,16 | 0,2873 | 0,0435 | |||
| PYPL / PayPal Holdings, Inc. | 0,08 | 0,00 | 5,73 | 13,92 | 0,2828 | 0,0170 | |||
| PGR / The Progressive Corporation | 0,02 | 0,00 | 5,63 | -5,71 | 0,2779 | -0,0376 | |||
| ALK / Alaska Air Group, Inc. | 0,11 | 0,00 | 5,35 | 0,53 | 0,2640 | -0,0171 | |||
| LIN / Linde plc | 0,01 | 73,02 | 5,11 | 74,36 | 0,2524 | 0,0974 | |||
| GLW / Corning Incorporated | 0,10 | 0,00 | 5,06 | 14,87 | 0,2498 | 0,0170 | |||
| UPS / United Parcel Service, Inc. | 0,05 | 0,00 | 4,61 | -8,25 | 0,2274 | -0,0378 | |||
| CME / CME Group Inc. | 0,02 | 0,00 | 4,60 | 3,88 | 0,2272 | -0,0069 | |||
| NSC / Norfolk Southern Corporation | 0,02 | 128,00 | 4,38 | 146,45 | 0,2160 | 0,1222 | |||
| CVS / CVS Health Corporation | 0,06 | 0,00 | 4,30 | 1,82 | 0,2124 | -0,0109 | |||
| USFD / US Foods Holding Corp. | 0,06 | 4,30 | 0,2121 | 0,2121 | |||||
| TER / Teradyne, Inc. | 0,05 | 155,14 | 4,24 | 177,75 | 0,2095 | 0,1287 | |||
| OTIS / Otis Worldwide Corporation | 0,04 | 98,82 | 4,18 | 90,74 | 0,2065 | 0,0906 | |||
| ZBH / Zimmer Biomet Holdings, Inc. | 0,05 | 0,00 | 4,15 | -19,40 | 0,2048 | -0,0672 | |||
| ENTG / Entegris, Inc. | 0,05 | 0,00 | 4,14 | -7,80 | 0,2042 | -0,0329 | |||
| UMG / Universal Music Group N.V. | 0,13 | 4,07 | 0,2007 | 0,2007 | |||||
| ERIC / Telefonaktiebolaget LM Ericsson (publ) - Depositary Receipt (Common Stock) | 0,48 | -55,89 | 4,06 | -51,80 | 0,2004 | -0,2446 | |||
| NFLX / Netflix, Inc. | 0,00 | 4,02 | 0,1983 | 0,1983 | |||||
| FIS / Fidelity National Information Services, Inc. | 0,05 | 0,00 | 3,99 | 9,02 | 0,1969 | 0,0036 | |||
| EOG / EOG Resources, Inc. | 0,03 | 0,00 | 3,91 | -6,73 | 0,1930 | -0,0285 | |||
| ADSK / Autodesk, Inc. | 0,01 | 0,00 | 3,90 | 18,25 | 0,1925 | 0,0183 | |||
| SYK / Stryker Corporation | 0,01 | 0,00 | 3,32 | 6,30 | 0,1640 | -0,0012 | |||
| IFNNY / Infineon Technologies AG - Depositary Receipt (Common Stock) | 0,08 | 0,00 | 3,32 | 28,04 | 0,1636 | 0,0268 | |||
| EW / Edwards Lifesciences Corporation | 0,04 | 3,24 | 0,1598 | 0,1598 | |||||
| PANW / Palo Alto Networks, Inc. | 0,02 | 0,00 | 3,19 | 19,95 | 0,1576 | 0,0169 | |||
| CARR / Carrier Global Corporation | 0,04 | 0,00 | 3,17 | 15,45 | 0,1564 | 0,0114 | |||
| SPOT / Spotify Technology S.A. | 0,00 | 0,00 | 3,15 | 39,51 | 0,1553 | 0,0361 | |||
| AVGO / Broadcom Inc. | 0,01 | 0,00 | 3,14 | 64,68 | 0,1551 | 0,0543 | |||
| GD / General Dynamics Corporation | 0,01 | 0,00 | 3,12 | 7,00 | 0,1540 | -0,0001 | |||
| ALB / Albemarle Corporation | 0,05 | 0,00 | 3,08 | -12,98 | 0,1522 | -0,0350 | |||
| PM / Philip Morris International Inc. | 0,02 | 2,88 | 0,1420 | 0,1420 | |||||
| ABT / Abbott Laboratories | 0,02 | 0,00 | 2,86 | 2,55 | 0,1410 | -0,0062 | |||
| FCX / Freeport-McMoRan Inc. | 0,07 | 0,00 | 2,84 | 14,52 | 0,1401 | 0,0091 | |||
| MDT / Medtronic plc | 0,03 | 0,00 | 2,73 | -2,99 | 0,1347 | -0,0139 | |||
| C / Citigroup Inc. | 0,03 | 0,00 | 2,70 | 19,91 | 0,1332 | 0,0143 | |||
| DD / DuPont de Nemours, Inc. | 0,04 | 0,00 | 2,65 | -8,16 | 0,1305 | -0,0216 | |||
| EBAY / eBay Inc. | 0,04 | 0,00 | 2,64 | 9,93 | 0,1301 | 0,0034 | |||
| ROK / Rockwell Automation, Inc. | 0,01 | 2,59 | 0,1279 | 0,1279 | |||||
| DOW / Dow Inc. | 0,10 | 432,30 | 2,55 | 304,13 | 0,1257 | 0,0923 | |||
| CSX / CSX Corporation | 0,08 | 0,00 | 2,54 | 10,89 | 0,1251 | 0,0043 | |||
| NKE / NIKE, Inc. | 0,04 | 0,00 | 2,49 | 11,93 | 0,1227 | 0,0053 | |||
| CRM / Salesforce, Inc. | 0,01 | 2,45 | 0,1211 | 0,1211 | |||||
| A / Agilent Technologies, Inc. | 0,02 | 0,00 | 2,36 | 0,90 | 0,1165 | -0,0071 | |||
| CTVA / Corteva, Inc. | 0,03 | 0,00 | 2,29 | 18,49 | 0,1129 | 0,0109 | |||
| DHR / Danaher Corporation | 0,01 | 2,25 | 0,1111 | 0,1111 | |||||
| MRVL / Marvell Technology, Inc. | 0,03 | 0,00 | 2,17 | 25,66 | 0,1073 | 0,0159 | |||
| UNH / UnitedHealth Group Incorporated | 0,01 | 2,15 | 0,1062 | 0,1062 | |||||
| BAC / Bank of America Corporation | 0,04 | -78,93 | 2,12 | -76,12 | 0,1044 | -0,3634 | |||
| ALC / Alcon Inc. | 0,02 | -66,20 | 2,10 | -54,77 | 0,1037 | -0,1180 | |||
| TMUS / T-Mobile US, Inc. | 0,01 | 0,00 | 2,07 | -10,69 | 0,1023 | -0,0203 | |||
| OKTA / Okta, Inc. | 0,02 | 2,00 | 0,0987 | 0,0987 | |||||
| JBHT / J.B. Hunt Transport Services, Inc. | 0,01 | 0,00 | 1,74 | -2,96 | 0,0858 | -0,0088 | |||
| QSR / Restaurant Brands International Inc. | 0,02 | 0,00 | 1,33 | -0,53 | 0,0654 | -0,0050 | |||
| RIG / Transocean Ltd. | 0,28 | 0,00 | 0,72 | -18,27 | 0,0355 | -0,0110 | |||
| Vanguard Market Liquidity Fund / STIV (N/A) | 0,00 | 0,01 | 0,0004 | 0,0004 |