Statistiques de base
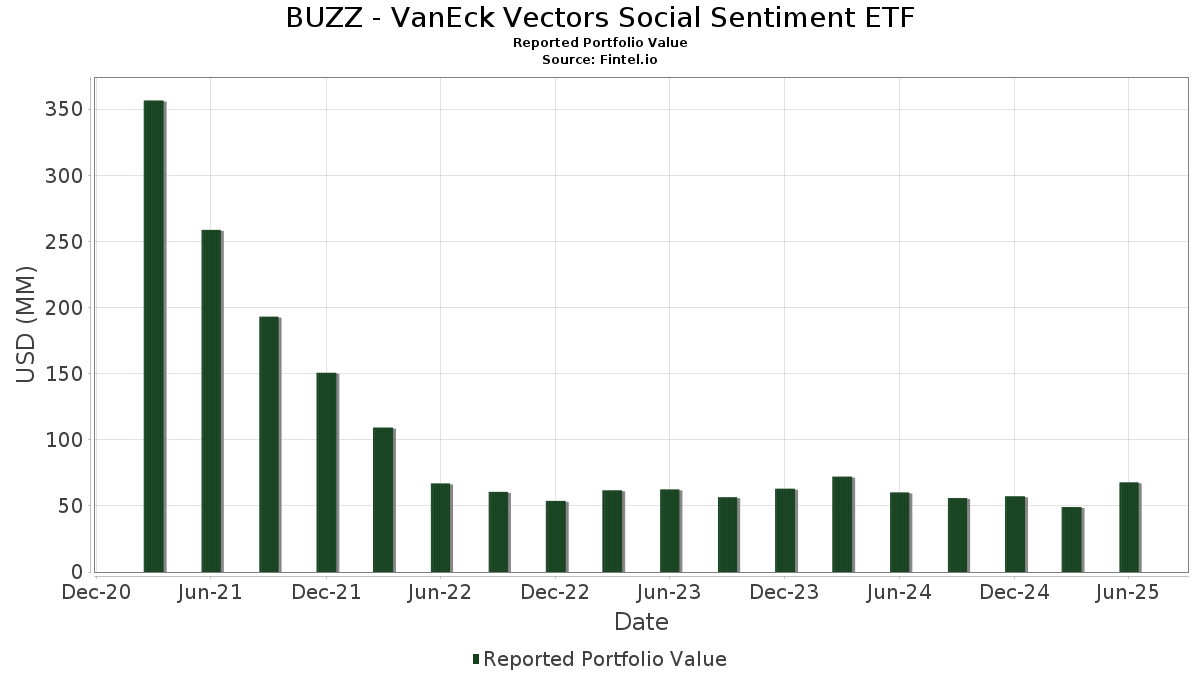
| Valeur du portefeuille | $ 67 718 411 |
| Positions actuelles | 76 |
Dernières positions, performances, ASG (à partir des dépôts 13F, 13D)
BUZZ - VanEck Vectors Social Sentiment ETF a déclaré un total de 76 positions dans ses derniers dépôts auprès de la SEC. La valeur la plus récente du portefeuille est calculée à 67 718 411 USD. Les actifs sous gestion réels (ASG) sont cette valeur plus les liquidités (qui ne sont pas divulguées). Les principales positions de BUZZ - VanEck Vectors Social Sentiment ETF sont Coinbase Global, Inc. (US:COIN) , Rocket Lab Corporation (US:RKLB) , Robinhood Markets, Inc. (US:HOOD) , AST SpaceMobile, Inc. (US:ASTS) , and SoFi Technologies, Inc. (US:SOFI) . Les nouvelles positions de BUZZ - VanEck Vectors Social Sentiment ETF incluent PepsiCo, Inc. (US:PEP) , Halozyme Therapeutics, Inc. (US:HALO) , .
Meilleures augmentations ce trimestre
Nous utilisons la variation de l'allocation du portefeuille car il s'agit de l'indicateur le plus significatif. Les changements peuvent être dus à des transactions ou à des variations de prix des actions.
| Titre | Actions (en millions) |
Valeur ($ en millions) |
% du portefeuille | ΔPortefeuille % |
|---|---|---|---|---|
| 0,02 | 1,94 | 2,9418 | 2,1190 | |
| 0,07 | 1,76 | 2,6793 | 1,8545 | |
| 0,01 | 1,78 | 2,7095 | 1,7935 | |
| 0,01 | 1,02 | 1,5565 | 1,5565 | |
| 0,02 | 1,16 | 1,7582 | 1,3579 | |
| 0,01 | 1,18 | 1,7968 | 1,3227 | |
| 0,01 | 2,65 | 4,0215 | 1,1633 | |
| 0,05 | 2,30 | 3,5004 | 0,9359 | |
| 0,00 | 0,56 | 0,8545 | 0,8545 | |
| 0,07 | 2,33 | 3,5383 | 0,7911 |
Principales baisses ce trimestre
Nous utilisons la variation de l'allocation du portefeuille car il s'agit de l'indicateur le plus significatif. Les changements peuvent être dus à des transactions ou à des variations de prix des actions.
| Titre | Actions (en millions) |
Valeur ($ en millions) |
% du portefeuille | ΔPortefeuille % |
|---|---|---|---|---|
| 0,01 | 0,55 | 0,8389 | -3,1012 | |
| 0,04 | 0,20 | 0,2994 | -1,6216 | |
| 0,01 | 0,22 | 0,3375 | -1,0764 | |
| 0,40 | 0,84 | 1,2781 | -1,0523 | |
| 0,00 | 0,34 | 0,5184 | -0,7359 | |
| 0,00 | 0,46 | 0,7046 | -0,7190 | |
| 0,00 | 1,43 | 2,1727 | -0,7012 | |
| 0,05 | 0,70 | 1,0693 | -0,6939 | |
| 0,00 | 0,20 | 0,2984 | -0,6305 | |
| 0,00 | 1,20 | 1,8299 | -0,5717 |
Déclarations 13F et dépôts de fonds
Ce formulaire a été déposé le 2025-08-21 pour la période de déclaration 2025-06-30. Cliquez sur l'icône du lien pour voir l'historique complet des transactions.
Mettre à niveau pour débloquer les données premium et exporter vers Excel ![]() .
.
| Titre | Type | Prix moyen de l'action | Actions (en millions) |
ΔActions (%) |
ΔActions (%) |
Valeur ($ en millions) |
Portefeuille (%) |
ΔPortefeuille (%) |
|
|---|---|---|---|---|---|---|---|---|---|
| COIN / Coinbase Global, Inc. | 0,01 | -5,11 | 2,65 | 93,07 | 4,0215 | 1,1633 | |||
| RKLB / Rocket Lab Corporation | 0,07 | -11,65 | 2,33 | 76,84 | 3,5383 | 0,7911 | |||
| HOOD / Robinhood Markets, Inc. | 0,02 | -37,15 | 2,31 | 41,42 | 3,5069 | 0,1032 | |||
| ASTS / AST SpaceMobile, Inc. | 0,05 | -8,84 | 2,30 | 87,32 | 3,5004 | 0,9359 | |||
| SOFI / SoFi Technologies, Inc. | 0,12 | -1,50 | 2,23 | 54,30 | 3,3800 | 0,3723 | |||
| AMD / Advanced Micro Devices, Inc. | 0,02 | 6,67 | 2,18 | 47,40 | 3,3117 | 0,2268 | |||
| SMCI / Super Micro Computer, Inc. | 0,04 | 16,13 | 2,06 | 66,24 | 3,1260 | 0,5451 | |||
| GME / GameStop Corp. | 0,08 | 27,75 | 2,01 | 39,62 | 3,0468 | 0,0514 | |||
| NVDA / NVIDIA Corporation | 0,01 | 2,71 | 1,98 | 49,66 | 3,0133 | 0,2512 | |||
| MSTR / Strategy Inc | 0,00 | -10,67 | 1,94 | 25,27 | 2,9441 | -0,2816 | |||
| UBER / Uber Technologies, Inc. | 0,02 | 283,15 | 1,94 | 391,37 | 2,9418 | 2,1190 | |||
| AAPL / Apple Inc. | 0,01 | 35,62 | 1,88 | 25,25 | 2,8486 | -0,2722 | |||
| AMZN / Amazon.com, Inc. | 0,01 | 17,17 | 1,87 | 35,14 | 2,8455 | -0,0450 | |||
| PLTR / Palantir Technologies Inc. | 0,01 | -24,11 | 1,84 | 22,56 | 2,7889 | -0,3338 | |||
| GOOGL / Alphabet Inc. | 0,01 | 25,04 | 1,83 | 42,54 | 2,7739 | 0,1023 | |||
| US8575093013 / State Street Navigator Securities Lending Government Money Market Portfolio | 1,82 | 58,34 | 1,82 | 58,35 | 2,7666 | 0,3687 | |||
| TSLA / Tesla, Inc. | 0,01 | -2,81 | 1,81 | 19,13 | 2,7536 | -0,4186 | |||
| UNH / UnitedHealth Group Incorporated | 0,01 | 581,53 | 1,78 | 306,15 | 2,7095 | 1,7935 | |||
| U / Unity Software Inc. | 0,07 | 260,88 | 1,76 | 346,33 | 2,6793 | 1,8545 | |||
| HIMS / Hims & Hers Health, Inc. | 0,03 | -28,89 | 1,59 | 20,03 | 2,4124 | -0,3474 | |||
| INTC / Intel Corporation | 0,07 | 17,61 | 1,57 | 15,95 | 2,3860 | -0,4367 | |||
| META / Meta Platforms, Inc. | 0,00 | -18,98 | 1,43 | 3,77 | 2,1727 | -0,7012 | |||
| MSFT / Microsoft Corporation | 0,00 | -21,08 | 1,20 | 4,51 | 1,8299 | -0,5717 | |||
| DIS / The Walt Disney Company | 0,01 | 314,02 | 1,18 | 420,70 | 1,7968 | 1,3227 | |||
| BAC / Bank of America Corporation | 0,02 | 431,55 | 1,16 | 502,60 | 1,7582 | 1,3579 | |||
| PEP / PepsiCo, Inc. | 0,01 | 1,02 | 1,5565 | 1,5565 | |||||
| RDDT / Reddit, Inc. | 0,01 | 72,93 | 1,01 | 148,53 | 1,5417 | 0,6893 | |||
| BA / The Boeing Company | 0,00 | 139,54 | 0,97 | 194,82 | 1,4691 | 0,7840 | |||
| DMYI.U / dMY Technology Group, Inc. III Units, each consisting of one share of Class A common stock and one-f | 0,02 | 3,41 | 0,96 | 101,68 | 1,4585 | 0,4643 | |||
| WMT / Walmart Inc. | 0,01 | 60,17 | 0,95 | 78,57 | 1,4437 | 0,3331 | |||
| LCID / Lucid Group, Inc. | 0,40 | -13,67 | 0,84 | -24,71 | 1,2781 | -1,0523 | |||
| MU / Micron Technology, Inc. | 0,01 | 116,66 | 0,78 | 207,06 | 1,1908 | 0,6590 | |||
| RIVN / Rivian Automotive, Inc. | 0,05 | -24,59 | 0,70 | -16,80 | 1,0693 | -0,6939 | |||
| NFLX / Netflix, Inc. | 0,00 | 76,27 | 0,70 | 153,09 | 1,0577 | 0,4842 | |||
| AVGO / Broadcom Inc. | 0,00 | -38,65 | 0,65 | 0,94 | 0,9835 | -0,3529 | |||
| LULU / lululemon athletica inc. | 0,00 | 0,56 | 0,8545 | 0,8545 | |||||
| CELH / Celsius Holdings, Inc. | 0,01 | -77,56 | 0,55 | -70,79 | 0,8389 | -3,1012 | |||
| NKE / NIKE, Inc. | 0,01 | -23,90 | 0,54 | -14,76 | 0,8251 | -0,5045 | |||
| M1Z / Nu Holdings Ltd. | 0,04 | 45,33 | 0,53 | 94,83 | 0,8028 | 0,2370 | |||
| CVNA / Carvana Co. | 0,00 | -48,42 | 0,51 | -16,88 | 0,7790 | -0,5072 | |||
| SNOW / Snowflake Inc. | 0,00 | -11,77 | 0,49 | 34,97 | 0,7515 | -0,0120 | |||
| F / Ford Motor Company | 0,05 | 43,06 | 0,49 | 55,21 | 0,7474 | 0,0846 | |||
| CRWD / CrowdStrike Holdings, Inc. | 0,00 | 24,01 | 0,48 | 79,62 | 0,7233 | 0,1691 | |||
| JPM / JPMorgan Chase & Co. | 0,00 | -42,53 | 0,46 | -32,11 | 0,7046 | -0,7190 | |||
| RBLX / Roblox Corporation | 0,00 | 31,60 | 0,35 | 138,10 | 0,5324 | 0,2248 | |||
| COST / Costco Wholesale Corporation | 0,00 | -13,90 | 0,35 | -9,82 | 0,5308 | -0,2775 | |||
| MRVL / Marvell Technology, Inc. | 0,00 | 27,70 | 0,35 | 60,93 | 0,5262 | 0,0764 | |||
| DKNG / DraftKings Inc. | 0,01 | -42,81 | 0,35 | -26,07 | 0,5258 | -0,4512 | |||
| APP / AppLovin Corporation | 0,00 | -57,07 | 0,34 | -43,26 | 0,5184 | -0,7359 | |||
| SNAP / Snap Inc. | 0,04 | 27,85 | 0,32 | 27,67 | 0,4917 | -0,0373 | |||
| PFE / Pfizer Inc. | 0,01 | 4,05 | 0,30 | -0,33 | 0,4574 | -0,1732 | |||
| WBD / Warner Bros. Discovery, Inc. | 0,03 | -21,91 | 0,29 | 8,27 | 0,4386 | -0,0418 | |||
| LLY / Eli Lilly and Company | 0,00 | 110,86 | 0,29 | 99,31 | 0,4369 | 0,1356 | |||
| MRNA / Moderna, Inc. | 0,01 | -6,50 | 0,28 | -9,06 | 0,4283 | -0,2177 | |||
| SHOP / Shopify Inc. | 0,00 | 4,21 | 0,27 | 13,39 | 0,4121 | -0,0169 | |||
| SPOT / Spotify Technology S.A. | 0,00 | 0,27 | 0,4091 | 0,4091 | |||||
| PYPL / PayPal Holdings, Inc. | 0,00 | -49,52 | 0,26 | -42,57 | 0,3943 | -0,5468 | |||
| ORCL / Oracle Corporation | 0,00 | -7,23 | 0,26 | 45,71 | 0,3875 | 0,0209 | |||
| CRM / Salesforce, Inc. | 0,00 | -25,18 | 0,25 | -39,08 | 0,3827 | -0,3553 | |||
| TGTX / TG Therapeutics, Inc. | 0,01 | 0,25 | 0,3816 | 0,3816 | |||||
| CAVA / CAVA Group, Inc. | 0,00 | 32,69 | 0,24 | 29,67 | 0,3594 | -0,0219 | |||
| FSLR / First Solar, Inc. | 0,00 | 6,53 | 0,24 | -21,67 | 0,3570 | -0,1529 | |||
| MCD / McDonald's Corporation | 0,00 | 49,51 | 0,22 | 40,25 | 0,3390 | 0,0063 | |||
| T / AT&T Inc. | 0,01 | -67,99 | 0,22 | -67,26 | 0,3375 | -1,0764 | |||
| RKT / Rocket Companies, Inc. | 0,02 | -78,25 | 0,22 | -72,29 | 0,3300 | -0,4156 | |||
| MELI / MercadoLibre, Inc. | 0,00 | -2,50 | 0,20 | 30,13 | 0,3096 | -0,0157 | |||
| AFRM / Affirm Holdings, Inc. | 0,00 | -28,38 | 0,20 | -18,55 | 0,3072 | -0,1374 | |||
| GRAB / Grab Holdings Limited | 0,04 | -80,74 | 0,20 | -78,61 | 0,2994 | -1,6216 | |||
| PANW / Palo Alto Networks, Inc. | 0,00 | -36,25 | 0,20 | -61,87 | 0,2984 | -0,6305 | |||
| HD / The Home Depot, Inc. | 0,00 | -35,75 | 0,18 | -41,86 | 0,2662 | -0,2778 | |||
| GS / The Goldman Sachs Group, Inc. | 0,00 | 0,17 | 0,2591 | 0,2591 | |||||
| ADBE / Adobe Inc. | 0,00 | -11,00 | 0,17 | -10,33 | 0,2521 | -0,1333 | |||
| ENPH / Enphase Energy, Inc. | 0,00 | 61,10 | 0,17 | -7,30 | 0,2517 | -0,0668 | |||
| BROS / Dutch Bros Inc. | 0,00 | -32,22 | 0,16 | -24,88 | 0,2392 | -0,1982 | |||
| HALO / Halozyme Therapeutics, Inc. | 0,00 | 0,16 | 0,2386 | 0,2386 | |||||
| IBM / International Business Machines Corporation | 0,00 | -68,82 | 0,15 | -51,90 | 0,2310 | -0,2190 | |||
| PR / Permian Resources Corporation | 0,00 | -100,00 | 0,00 | -100,00 | -0,4433 |