Statistiques de base
| Valeur du portefeuille | $ 791 775 |
| Positions actuelles | 71 |
Dernières positions, performances, ASG (à partir des dépôts 13F, 13D)
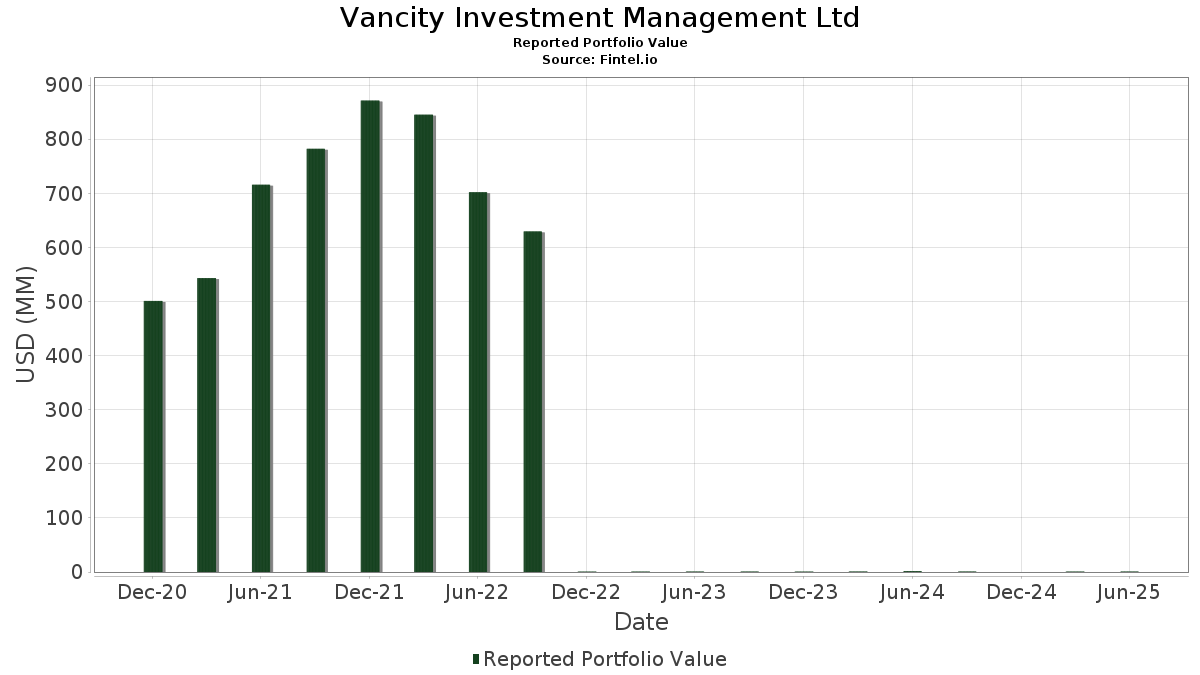
Vancity Investment Management Ltd a déclaré un total de 71 positions dans ses derniers dépôts auprès de la SEC. La valeur la plus récente du portefeuille est calculée à 791 775 USD. Les actifs sous gestion réels (ASG) sont cette valeur plus les liquidités (qui ne sont pas divulguées). Les principales positions de Vancity Investment Management Ltd sont Microsoft Corporation (US:MSFT) , Visa Inc. (US:V) , ServiceNow, Inc. (US:NOW) , Amazon.com, Inc. (US:AMZN) , and S&P Global Inc. (US:SPGI) . Les nouvelles positions de Vancity Investment Management Ltd incluent AAON, Inc. (US:AAON) , Nu Holdings Ltd. (US:NU) , Verizon Communications Inc. (US:VZ) , The Procter & Gamble Company (US:PG) , and .
Meilleures augmentations ce trimestre
Nous utilisons la variation de l'allocation du portefeuille car il s'agit de l'indicateur le plus significatif. Les changements peuvent être dus à des transactions ou à des variations de prix des actions.
| Titre | Actions (en millions) |
Valeur ($ en millions) |
% du portefeuille | ΔPortefeuille % |
|---|---|---|---|---|
| 0,03 | 0,03 | 4,0253 | 4,0253 | |
| 0,19 | 0,09 | 11,6480 | 1,9475 | |
| 0,04 | 0,04 | 5,2607 | 0,6443 | |
| 0,00 | 0,00 | 0,5939 | 0,5379 | |
| 0,05 | 0,02 | 2,5890 | 0,3913 | |
| 0,12 | 0,02 | 2,8647 | 0,3623 | |
| 0,06 | 0,01 | 1,1475 | 0,3571 | |
| 0,06 | 0,01 | 1,5328 | 0,3067 | |
| 0,05 | 0,03 | 3,2468 | 0,2183 | |
| 0,04 | 0,00 | 0,5959 | 0,1449 |
Principales baisses ce trimestre
Nous utilisons la variation de l'allocation du portefeuille car il s'agit de l'indicateur le plus significatif. Les changements peuvent être dus à des transactions ou à des variations de prix des actions.
| Titre | Actions (en millions) |
Valeur ($ en millions) |
% du portefeuille | ΔPortefeuille % |
|---|---|---|---|---|
| 0,67 | 0,03 | 4,1764 | -1,2962 | |
| 0,16 | 0,03 | 4,2617 | -1,1927 | |
| 0,29 | 0,03 | 4,0907 | -0,9899 | |
| 0,05 | 0,02 | 2,2196 | -0,6058 | |
| 0,09 | 0,02 | 2,4276 | -0,5908 | |
| 0,00 | 0,00 | 0,0472 | -0,5661 | |
| 0,00 | 0,00 | 0,0330 | -0,5361 | |
| 0,11 | 0,02 | 2,7562 | -0,4468 | |
| 0,01 | 0,03 | 3,4986 | -0,4417 | |
| 0,13 | 0,05 | 5,7534 | -0,3893 |
Déclarations 13F et dépôts de fonds
Ce formulaire a été déposé le 2025-08-14 pour la période de déclaration 2025-06-30. Cliquez sur l'icône du lien pour voir l'historique complet des transactions.
Mettre à niveau pour débloquer les données premium et exporter vers Excel ![]() .
.
| Titre | Type | Prix moyen de l'action | Actions (en millions) |
ΔActions (%) |
ΔActions (%) |
Valeur ($ en millions) |
Portefeuille (%) |
ΔPortefeuille (%) |
|
|---|---|---|---|---|---|---|---|---|---|
| MSFT / Microsoft Corporation | 0,19 | -1,65 | 0,09 | 31,43 | 11,6480 | 1,9475 | |||
| V / Visa Inc. | 0,13 | 0,34 | 0,05 | 2,27 | 5,7534 | -0,3893 | |||
| NOW / ServiceNow, Inc. | 0,04 | -4,22 | 0,04 | 24,24 | 5,2607 | 0,6443 | |||
| AMZN / Amazon.com, Inc. | 0,17 | -4,48 | 0,04 | 11,76 | 4,8156 | 0,0702 | |||
| SPGI / S&P Global Inc. | 0,07 | 2,49 | 0,04 | 5,71 | 4,7292 | -0,0966 | |||
| AAPL / Apple Inc. | 0,16 | -8,19 | 0,03 | -15,38 | 4,2617 | -1,1927 | |||
| CPRT / Copart, Inc. | 0,67 | -4,48 | 0,03 | -15,38 | 4,1764 | -1,2962 | |||
| BRO / Brown & Brown, Inc. | 0,29 | -1,95 | 0,03 | -13,51 | 4,0907 | -0,9899 | |||
| COST / Costco Wholesale Corporation | 0,03 | 0,03 | 4,0253 | 4,0253 | |||||
| GOOG / Alphabet Inc. | 0,17 | -3,79 | 0,03 | 11,11 | 3,8439 | 0,0249 | |||
| AZO / AutoZone, Inc. | 0,01 | -1,02 | 0,03 | -3,57 | 3,4986 | -0,4417 | |||
| MCO / Moody's Corporation | 0,05 | 8,03 | 0,03 | 13,64 | 3,2468 | 0,2183 | |||
| ICE / Intercontinental Exchange, Inc. | 0,12 | 16,82 | 0,02 | 22,22 | 2,8647 | 0,3623 | |||
| DHR / Danaher Corporation | 0,11 | -3,08 | 0,02 | -8,70 | 2,7562 | -0,4468 | |||
| TXN / Texas Instruments Incorporated | 0,10 | -7,91 | 0,02 | 5,00 | 2,7412 | -0,0550 | |||
| TT / Trane Technologies plc | 0,05 | -1,51 | 0,02 | 25,00 | 2,5890 | 0,3913 | |||
| MMC / Marsh & McLennan Companies, Inc. | 0,09 | -2,57 | 0,02 | -13,64 | 2,4276 | -0,5908 | |||
| ELV / Elevance Health, Inc. | 0,05 | -4,65 | 0,02 | -15,00 | 2,2196 | -0,6058 | |||
| AMT / American Tower Corporation | 0,08 | -6,69 | 0,02 | -5,56 | 2,2081 | -0,3206 | |||
| MSCI / MSCI Inc. | 0,03 | -0,96 | 0,02 | 6,67 | 2,0304 | -0,1512 | |||
| CDW / CDW Corporation | 0,08 | -8,46 | 0,01 | 0,00 | 1,8589 | -0,1189 | |||
| LIN / Linde plc | 0,03 | 2,17 | 0,01 | 7,69 | 1,7807 | -0,0968 | |||
| GOOGL / Alphabet Inc. | 0,08 | 4,06 | 0,01 | 18,18 | 1,7053 | 0,1446 | |||
| FERG / Ferguson Enterprises Inc. | 0,06 | -0,15 | 0,01 | 50,00 | 1,5328 | 0,3067 | |||
| ADBE / Adobe Inc. | 0,03 | -4,85 | 0,01 | 0,00 | 1,5249 | -0,1995 | |||
| SE / Sea Limited - Depositary Receipt (Common Stock) | 0,06 | -1,65 | 0,01 | 25,00 | 1,3077 | 0,1303 | |||
| EW / Edwards Lifesciences Corporation | 0,12 | -4,44 | 0,01 | 0,00 | 1,2198 | -0,0642 | |||
| MA / Mastercard Incorporated | 0,02 | -6,78 | 0,01 | 0,00 | 1,2039 | -0,1634 | |||
| NVDA / NVIDIA Corporation | 0,06 | 8,10 | 0,01 | 80,00 | 1,1475 | 0,3571 | |||
| KMX / CarMax, Inc. | 0,13 | -3,52 | 0,01 | -20,00 | 1,1118 | -0,3382 | |||
| CME / CME Group Inc. | 0,03 | -2,95 | 0,01 | 0,00 | 1,0993 | -0,0840 | |||
| APD / Air Products and Chemicals, Inc. | 0,02 | -1,51 | 0,00 | -20,00 | 0,6074 | -0,0924 | |||
| LAMR / Lamar Advertising Company | 0,04 | 34,44 | 0,00 | 33,33 | 0,5959 | 0,1449 | |||
| MELI / MercadoLibre, Inc. | 0,00 | 760,77 | 0,00 | 0,5939 | 0,5379 | ||||
| WINA / Winmark Corporation | 0,01 | -6,63 | 0,00 | 0,00 | 0,4854 | 0,0105 | |||
| FIVE / Five Below, Inc. | 0,01 | -11,54 | 0,00 | 0,1733 | 0,0518 | ||||
| GWRE / Guidewire Software, Inc. | 0,01 | -11,78 | 0,00 | 0,00 | 0,1492 | 0,0030 | |||
| TTEK / Tetra Tech, Inc. | 0,03 | 10,36 | 0,00 | 0,1484 | 0,0297 | ||||
| BLD / TopBuild Corp. | 0,00 | 3,90 | 0,00 | 0,00 | 0,1437 | 0,0024 | |||
| WTS / Watts Water Technologies, Inc. | 0,00 | 6,03 | 0,00 | 0,1403 | 0,0212 | ||||
| KNSL / Kinsale Capital Group, Inc. | 0,00 | 5,42 | 0,00 | 0,00 | 0,1332 | -0,0048 | |||
| WK / Workiva Inc. | 0,02 | 36,72 | 0,00 | 0,1332 | 0,0160 | ||||
| DAR / Darling Ingredients Inc. | 0,03 | -1,50 | 0,00 | 0,1331 | 0,0124 | ||||
| WM / Waste Management, Inc. | 0,00 | 9,85 | 0,00 | 0,1311 | 0,0001 | ||||
| FSS / Federal Signal Corporation | 0,01 | -3,64 | 0,00 | 0,1282 | 0,0284 | ||||
| SITE / SiteOne Landscape Supply, Inc. | 0,01 | 4,72 | 0,00 | 0,1041 | -0,0044 | ||||
| SSD / Simpson Manufacturing Co., Inc. | 0,01 | 3,04 | 0,00 | 0,1038 | -0,0068 | ||||
| FWRG / First Watch Restaurant Group, Inc. | 0,05 | 11,70 | 0,00 | 0,1029 | -0,0010 | ||||
| NSA / National Storage Affiliates Trust | 0,02 | 0,00 | 0,00 | 0,0989 | -0,0333 | ||||
| PODD / Insulet Corporation | 0,00 | 6,19 | 0,00 | 0,0946 | 0,0139 | ||||
| GLOB / Globant S.A. | 0,01 | 7,45 | 0,00 | 0,0938 | -0,0290 | ||||
| GO / Grocery Outlet Holding Corp. | 0,06 | -17,62 | 0,00 | 0,0919 | -0,0444 | ||||
| ECL / Ecolab Inc. | 0,00 | 7,85 | 0,00 | 0,0898 | 0,0048 | ||||
| LECO / Lincoln Electric Holdings, Inc. | 0,00 | -4,99 | 0,00 | 0,0877 | -0,0038 | ||||
| NVMI / Nova Ltd. | 0,00 | 7,19 | 0,00 | 0,0840 | 0,0271 | ||||
| KAI / Kadant Inc. | 0,00 | -5,06 | 0,00 | 0,0692 | -0,0148 | ||||
| HD / The Home Depot, Inc. | 0,00 | 9,15 | 0,00 | 0,0668 | 0,0003 | ||||
| FND / Floor & Decor Holdings, Inc. | 0,01 | 11,12 | 0,00 | 0,0530 | -0,0018 | ||||
| ITW / Illinois Tool Works Inc. | 0,00 | 12,05 | 0,00 | 0,0494 | 0,0014 | ||||
| XYL / Xylem Inc. | 0,00 | -92,28 | 0,00 | -100,00 | 0,0472 | -0,5661 | |||
| FCPT / Four Corners Property Trust, Inc. | 0,01 | -11,53 | 0,00 | 0,0462 | -0,0144 | ||||
| BOH / Bank of Hawaii Corporation | 0,01 | 0,00 | 0,00 | 0,0448 | -0,0048 | ||||
| OTIS / Otis Worldwide Corporation | 0,00 | 18,83 | 0,00 | 0,0446 | 0,0021 | ||||
| MPWR / Monolithic Power Systems, Inc. | 0,00 | 10,73 | 0,00 | 0,0419 | 0,0093 | ||||
| AAON / AAON, Inc. | 0,00 | 0,00 | 0,0374 | 0,0374 | |||||
| AVGO / Broadcom Inc. | 0,00 | -96,18 | 0,00 | -100,00 | 0,0330 | -0,5361 | |||
| TMO / Thermo Fisher Scientific Inc. | 0,00 | -77,79 | 0,00 | -100,00 | 0,0327 | -0,1633 | |||
| NU / Nu Holdings Ltd. | 0,02 | 0,00 | 0,0279 | 0,0279 | |||||
| VZ / Verizon Communications Inc. | 0,00 | 0,00 | 0,0272 | 0,0272 | |||||
| PG / The Procter & Gamble Company | 0,00 | 0,00 | 0,0260 | 0,0260 | |||||
| TJX / The TJX Companies, Inc. | 0,00 | -3,28 | 0,00 | 0,0253 | -0,0027 | ||||
| XPEL / XPEL, Inc. | 0,00 | -100,00 | 0,00 | 0,0000 | |||||
| CRM / Salesforce, Inc. | 0,00 | -100,00 | 0,00 | 0,0000 | |||||
| STVN / Stevanato Group S.p.A. | 0,00 | -100,00 | 0,00 | 0,0000 | |||||
| MCD / McDonald's Corporation | 0,00 | -100,00 | 0,00 | 0,0000 | |||||
| DE / Deere & Company | 0,00 | -100,00 | 0,00 | 0,0000 | |||||
| EA / Electronic Arts Inc. | 0,00 | -100,00 | 0,00 | 0,0000 | |||||
| SBUX / Starbucks Corporation | 0,00 | -100,00 | 0,00 | 0,0000 | -0,0843 |