Statistiques de base
| Valeur du portefeuille | $ 3 359 957 |
| Positions actuelles | 63 |
Dernières positions, performances, ASG (à partir des dépôts 13F, 13D)
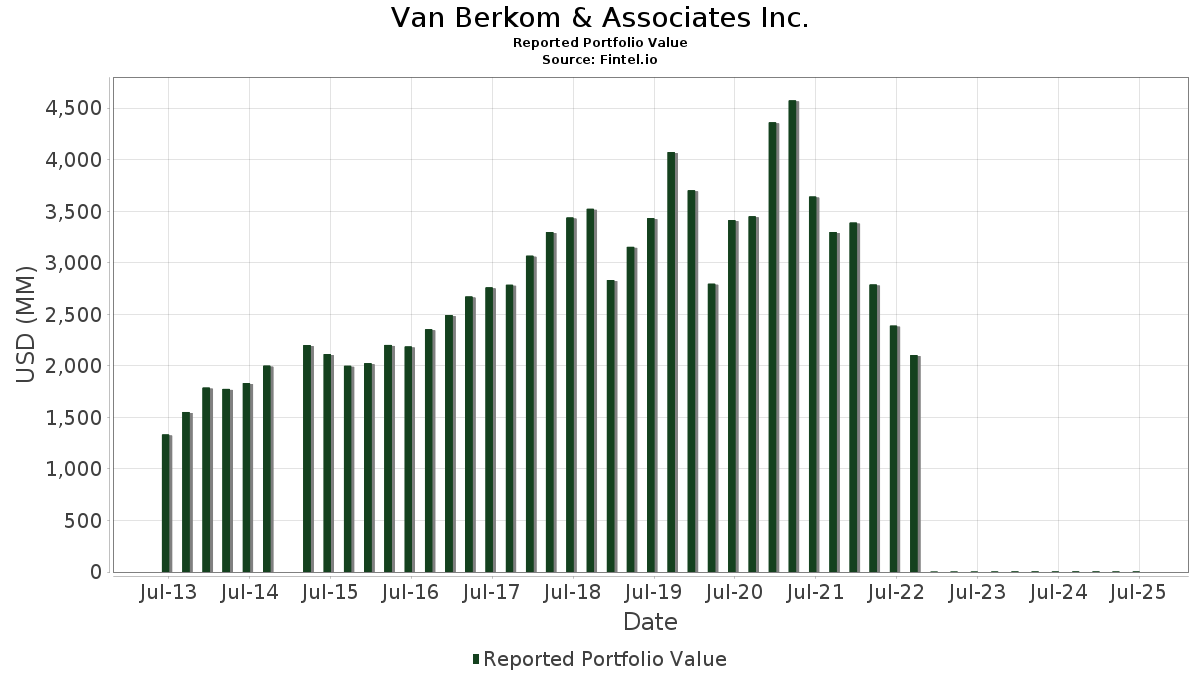
Van Berkom & Associates Inc. a déclaré un total de 63 positions dans ses derniers dépôts auprès de la SEC. La valeur la plus récente du portefeuille est calculée à 3 359 957 USD. Les actifs sous gestion réels (ASG) sont cette valeur plus les liquidités (qui ne sont pas divulguées). Les principales positions de Van Berkom & Associates Inc. sont Laureate Education, Inc. (US:LAUR) , The Ensign Group, Inc. (US:ENSG) , Victory Capital Holdings, Inc. (US:VCTR) , StoneX Group Inc. (US:SNEX) , and Euronet Worldwide, Inc. (US:EEFT) . Les nouvelles positions de Van Berkom & Associates Inc. incluent RadNet, Inc. (US:RDNT) , . Les principales industries de Van Berkom & Associates Inc. sont "Apparel And Other Finished Products Made From Fabrics And Similar Materials" (sic 23) , "Leather And Leather Products" (sic 31) , and "Wholesale Trade-durable Goods" (sic 50) .
Meilleures augmentations ce trimestre
Nous utilisons la variation de l'allocation du portefeuille car il s'agit de l'indicateur le plus significatif. Les changements peuvent être dus à des transactions ou à des variations de prix des actions.
| Titre | Actions (en millions) |
Valeur ($ en millions) |
% du portefeuille | ΔPortefeuille % |
|---|---|---|---|---|
| 0,91 | 0,05 | 1,3866 | 1,3502 | |
| 2,06 | 0,07 | 2,2077 | 1,1539 | |
| 0,56 | 0,07 | 1,9979 | 0,7558 | |
| 0,44 | 0,07 | 2,1884 | 0,6664 | |
| 2,90 | 0,07 | 1,9860 | 0,5342 | |
| 0,77 | 0,06 | 1,7321 | 0,4520 | |
| 0,63 | 0,09 | 2,6367 | 0,4124 | |
| 2,85 | 0,08 | 2,2422 | 0,3757 | |
| 0,98 | 0,08 | 2,2755 | 0,3273 | |
| 0,42 | 0,07 | 2,0361 | 0,2990 |
Principales baisses ce trimestre
Nous utilisons la variation de l'allocation du portefeuille car il s'agit de l'indicateur le plus significatif. Les changements peuvent être dus à des transactions ou à des variations de prix des actions.
| Titre | Actions (en millions) |
Valeur ($ en millions) |
% du portefeuille | ΔPortefeuille % |
|---|---|---|---|---|
| 0,01 | 0,00 | 0,0165 | -1,6638 | |
| 3,21 | 0,04 | 1,1879 | -0,5848 | |
| 0,45 | 0,08 | 2,4469 | -0,5053 | |
| 1,07 | 0,08 | 2,3072 | -0,4667 | |
| 0,44 | 0,05 | 1,3807 | -0,4641 | |
| 1,28 | 0,08 | 2,2558 | -0,3733 | |
| 0,51 | 0,10 | 2,8579 | -0,3519 | |
| 1,03 | 0,10 | 3,1175 | -0,3460 | |
| 1,04 | 0,09 | 2,5976 | -0,3114 | |
| 0,13 | 0,06 | 1,8611 | -0,2727 |
Déclarations 13D/G
Il s'agit d'une liste des déclarations 13D et 13G déposées au cours de la dernière année (le cas échéant). Cliquez sur l'icône du lien pour voir l'historique complet des transactions. Les lignes vertes indiquent de nouvelles positions. Les lignes rouges indiquent des positions fermées.
| Date de dépôt | Formulaire | Titre | Actions précédentes |
Actions actuelles |
ΔActions % | % de participation |
% ΔParticipation | |
|---|---|---|---|---|---|---|---|---|
| 2025-02-10 | PNTG / The Pennant Group, Inc. | 2 186 754 | 6,40 | |||||
| 2025-02-06 | CRNC / Cerence Inc. | 3 936 930 | 0 | -100,00 | 0,00 | -100,00 |
Déclarations 13F et dépôts de fonds
Ce formulaire a été déposé le 2025-08-12 pour la période de déclaration 2025-06-30. Cliquez sur l'icône du lien pour voir l'historique complet des transactions.
Mettre à niveau pour débloquer les données premium et exporter vers Excel ![]() .
.
| Titre | Type | Prix moyen de l'action | Actions (en millions) |
ΔActions (%) |
ΔActions (%) |
Valeur ($ en millions) |
Portefeuille (%) |
ΔPortefeuille (%) |
|
|---|---|---|---|---|---|---|---|---|---|
| LAUR / Laureate Education, Inc. | 4,96 | -2,57 | 0,12 | 11,54 | 3,4544 | 0,1081 | |||
| ENSG / The Ensign Group, Inc. | 0,75 | -6,12 | 0,12 | 11,65 | 3,4486 | 0,1238 | |||
| VCTR / Victory Capital Holdings, Inc. | 1,78 | -0,94 | 0,11 | 8,65 | 3,3807 | 0,0338 | |||
| SNEX / StoneX Group Inc. | 1,20 | -15,03 | 0,11 | 1,87 | 3,2468 | -0,2083 | |||
| EEFT / Euronet Worldwide, Inc. | 1,03 | 2,36 | 0,10 | -2,80 | 3,1175 | -0,3460 | |||
| HLNE / Hamilton Lane Incorporated | 0,68 | 3,32 | 0,10 | -2,04 | 2,8808 | -0,2665 | |||
| LOPE / Grand Canyon Education, Inc. | 0,51 | -12,05 | 0,10 | -3,03 | 2,8579 | -0,3519 | |||
| AWI / Armstrong World Industries, Inc. | 0,55 | -9,08 | 0,09 | 4,71 | 2,6753 | -0,0783 | |||
| FSS / Federal Signal Corporation | 0,84 | -19,96 | 0,09 | 17,11 | 2,6506 | 0,1811 | |||
| MMS / Maximus, Inc. | 1,27 | -0,77 | 0,09 | 2,33 | 2,6442 | -0,1486 | |||
| SHAK / Shake Shack Inc. | 0,63 | -19,79 | 0,09 | 27,54 | 2,6367 | 0,4124 | |||
| ORA / Ormat Technologies, Inc. | 1,04 | -18,60 | 0,09 | -3,33 | 2,5976 | -0,3114 | |||
| IRDM / Iridium Communications Inc. | 2,86 | -0,77 | 0,09 | 10,26 | 2,5709 | 0,0395 | |||
| OZK / Bank OZK | 1,81 | -1,26 | 0,08 | 6,33 | 2,5291 | -0,0225 | |||
| PNTG / The Pennant Group, Inc. | 2,83 | -0,76 | 0,08 | 18,31 | 2,5124 | 0,2109 | |||
| CCCS / CCC Intelligent Solutions Holdings Inc. | 8,74 | 12,79 | 0,08 | 17,14 | 2,4487 | 0,2007 | |||
| PCTY / Paylocity Holding Corporation | 0,45 | -7,53 | 0,08 | -9,89 | 2,4469 | -0,5053 | |||
| PLNT / Planet Fitness, Inc. | 0,74 | -0,66 | 0,08 | 12,50 | 2,4140 | 0,0911 | |||
| NMIH / NMI Holdings, Inc. | 1,90 | -9,49 | 0,08 | 6,67 | 2,3879 | -0,0445 | |||
| IBP / Installed Building Products, Inc. | 0,44 | 3,28 | 0,08 | 8,22 | 2,3804 | 0,0157 | |||
| RLI / RLI Corp. | 1,07 | -0,18 | 0,08 | -10,47 | 2,3072 | -0,4667 | |||
| PRIM / Primoris Services Corporation | 0,98 | -7,17 | 0,08 | 26,67 | 2,2755 | 0,3273 | |||
| GMED / Globus Medical, Inc. | 1,28 | 14,82 | 0,08 | -7,41 | 2,2558 | -0,3733 | |||
| SGI / Somnigroup International Inc. | 1,11 | -4,12 | 0,08 | 8,70 | 2,2513 | 0,0219 | |||
| FIVN / Five9, Inc. | 2,85 | 32,90 | 0,08 | 29,31 | 2,2422 | 0,3757 | |||
| TTEK / Tetra Tech, Inc. | 2,06 | 83,86 | 0,07 | 131,25 | 2,2077 | 1,1539 | |||
| CRL / Charles River Laboratories International, Inc. | 0,49 | 8,92 | 0,07 | 8,96 | 2,1990 | 0,0379 | |||
| SPXC / SPX Technologies, Inc. | 0,44 | 19,15 | 0,07 | 55,32 | 2,1884 | 0,6664 | |||
| HLI / Houlihan Lokey, Inc. | 0,40 | -1,35 | 0,07 | 10,94 | 2,1230 | 0,0390 | |||
| GTLS / Chart Industries, Inc. | 0,42 | 10,88 | 0,07 | 25,93 | 2,0361 | 0,2990 | |||
| FCN / FTI Consulting, Inc. | 0,42 | -3,40 | 0,07 | -4,29 | 2,0006 | -0,2698 | |||
| ESAB / ESAB Corporation | 0,56 | 67,72 | 0,07 | 76,32 | 1,9979 | 0,7558 | |||
| PRVA / Privia Health Group, Inc. | 2,90 | 44,08 | 0,07 | 46,67 | 1,9860 | 0,5342 | |||
| WSC / WillScot Holdings Corporation | 2,41 | 20,96 | 0,07 | 20,00 | 1,9648 | 0,1865 | |||
| CHE / Chemed Corporation | 0,13 | 18,92 | 0,06 | -6,06 | 1,8611 | -0,2727 | |||
| FND / Floor & Decor Holdings, Inc. | 0,77 | 54,67 | 0,06 | 48,72 | 1,7321 | 0,4520 | |||
| YETI / YETI Holdings, Inc. | 1,80 | -0,79 | 0,06 | -6,67 | 1,6917 | -0,2404 | |||
| DV / DoubleVerify Holdings, Inc. | 3,64 | 4,52 | 0,05 | 17,39 | 1,6235 | 0,1266 | |||
| APG / APi Group Corporation | 0,91 | 2 785,76 | 0,05 | 4 500,00 | 1,3866 | 1,3502 | |||
| HQY / HealthEquity, Inc. | 0,44 | -31,88 | 0,05 | -19,30 | 1,3807 | -0,4641 | |||
| BLKB / Blackbaud, Inc. | 0,67 | 28,28 | 0,04 | 31,25 | 1,2796 | 0,2395 | |||
| GO / Grocery Outlet Holding Corp. | 3,21 | -18,62 | 0,04 | -29,09 | 1,1879 | -0,5848 | |||
| DOCN / DigitalOcean Holdings, Inc. | 1,18 | 20,93 | 0,03 | 3,13 | 0,9995 | -0,0431 | |||
| SLAB / Silicon Laboratories Inc. | 0,18 | -37,99 | 0,03 | -18,18 | 0,8073 | -0,2658 | |||
| ATS / ATS Corporation | 0,27 | 16,17 | 0,01 | 60,00 | 0,2551 | 0,0694 | |||
| ATAT / Atour Lifestyle Holdings Limited - Depositary Receipt (Common Stock) | 0,06 | 19,38 | 0,00 | 100,00 | 0,0596 | 0,0126 | |||
| PTC / PTC Inc. | 0,01 | 9,43 | 0,00 | 0,00 | 0,0469 | 0,0053 | |||
| ROAD / Construction Partners, Inc. | 0,01 | 1,45 | 0,00 | 0,0443 | 0,0124 | ||||
| EPAM / EPAM Systems, Inc. | 0,01 | 46,52 | 0,00 | 0,0431 | 0,0128 | ||||
| FA / First Advantage Corporation | 0,09 | -7,95 | 0,00 | 0,00 | 0,0421 | 0,0002 | |||
| DT / Dynatrace, Inc. | 0,02 | 0,00 | 0,00 | 0,00 | 0,0354 | 0,0028 | |||
| GLOB / Globant S.A. | 0,01 | 81,89 | 0,00 | 0,0337 | 0,0078 | ||||
| TECH / Bio-Techne Corporation | 0,02 | 36,46 | 0,00 | 0,0327 | 0,0032 | ||||
| YUMC / Yum China Holdings, Inc. | 0,02 | 6,72 | 0,00 | -100,00 | 0,0286 | -0,0050 | |||
| ENTG / Entegris, Inc. | 0,01 | 0,00 | 0,00 | 0,0257 | -0,0044 | ||||
| KLIC / Kulicke and Soffa Industries, Inc. | 0,02 | 17,99 | 0,00 | 0,0237 | 0,0030 | ||||
| VIPS / Vipshop Holdings Limited - Depositary Receipt (Common Stock) | 0,04 | 31,28 | 0,00 | 0,0175 | 0,0025 | ||||
| BC / Brunswick Corporation | 0,01 | -98,97 | 0,00 | -100,00 | 0,0165 | -1,6638 | |||
| GRAB / Grab Holdings Limited | 0,10 | -29,09 | 0,00 | 0,0149 | -0,0055 | ||||
| RDNT / RadNet, Inc. | 0,01 | 0,00 | 0,0098 | 0,0098 | |||||
| STVN / Stevanato Group S.p.A. | 0,00 | 0,00 | 0,00 | 0,0018 | 0,0002 | ||||
| SMIN / iShares Trust - iShares MSCI India Small-Cap ETF | 0,00 | 12,99 | 0,00 | 0,0009 | 0,0002 | ||||
| SCJ / iShares, Inc. - iShares MSCI Japan Small-Cap ETF | 0,00 | 0,00 | 0,0007 | 0,0007 | |||||
| THRM / Gentherm Incorporated | 0,00 | -100,00 | 0,00 | 0,0000 | |||||
| MCHI / iShares Trust - iShares MSCI China ETF | 0,00 | -100,00 | 0,00 | 0,0000 | -0,0009 |