Statistiques de base
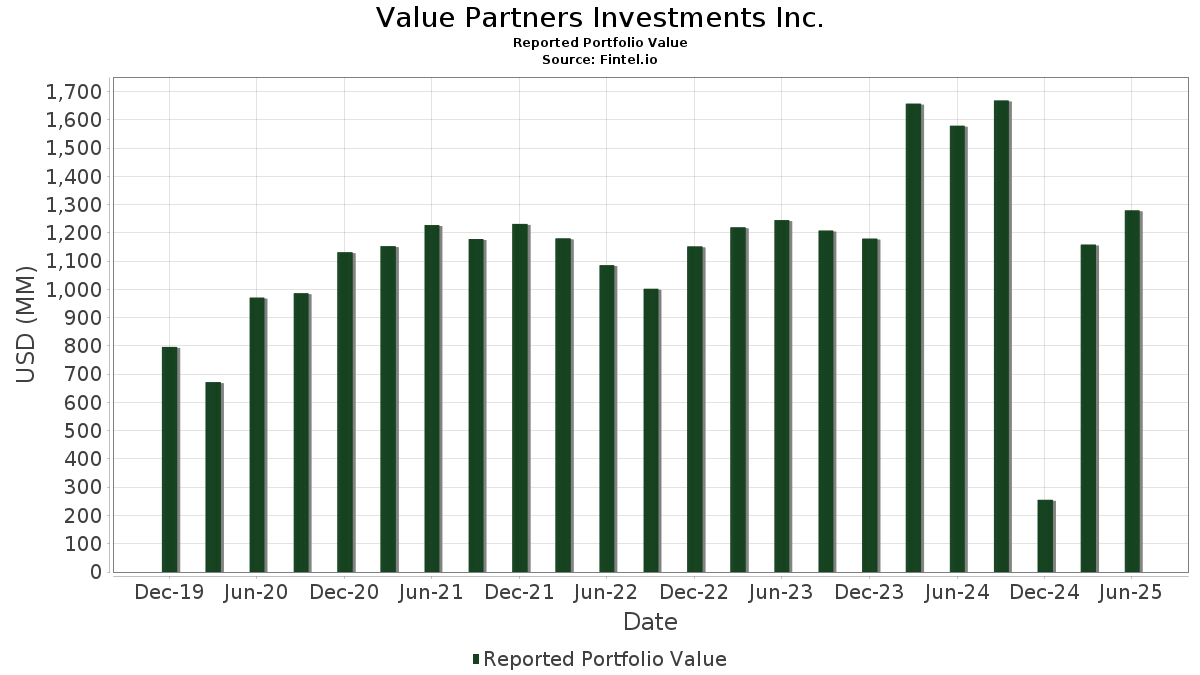
| Valeur du portefeuille | $ 1 279 105 917 |
| Positions actuelles | 101 |
Dernières positions, performances, ASG (à partir des dépôts 13F, 13D)
Value Partners Investments Inc. a déclaré un total de 101 positions dans ses derniers dépôts auprès de la SEC. La valeur la plus récente du portefeuille est calculée à 1 279 105 917 USD. Les actifs sous gestion réels (ASG) sont cette valeur plus les liquidités (qui ne sont pas divulguées). Les principales positions de Value Partners Investments Inc. sont Alphabet Inc. (US:GOOGL) , Open Text Corporation (US:OTEX) , Sun Life Financial Inc. (US:SLF) , Rogers Communications Inc. (US:RCI) , and The Bank of Nova Scotia (US:BNS) . Les nouvelles positions de Value Partners Investments Inc. incluent Amazon.com, Inc. (US:AMZN) , Accenture plc (US:ACN) , .
Meilleures augmentations ce trimestre
Nous utilisons la variation de l'allocation du portefeuille car il s'agit de l'indicateur le plus significatif. Les changements peuvent être dus à des transactions ou à des variations de prix des actions.
| Titre | Actions (en millions) |
Valeur ($ en millions) |
% du portefeuille | ΔPortefeuille % |
|---|---|---|---|---|
| 1,52 | 48,49 | 3,7909 | 3,7664 | |
| 0,22 | 47,62 | 3,7228 | 3,7228 | |
| 2,56 | 74,71 | 5,8408 | 0,7497 | |
| 0,49 | 86,77 | 6,7834 | 0,7349 | |
| 0,87 | 61,53 | 4,8103 | 0,5716 | |
| 1,12 | 74,22 | 5,8028 | 0,2575 | |
| 1,12 | 61,87 | 4,8367 | 0,2288 | |
| 0,33 | 43,05 | 3,3653 | 0,2189 | |
| 0,18 | 41,25 | 3,2246 | 0,2003 | |
| 0,01 | 2,50 | 0,1953 | 0,1953 |
Principales baisses ce trimestre
Nous utilisons la variation de l'allocation du portefeuille car il s'agit de l'indicateur le plus significatif. Les changements peuvent être dus à des transactions ou à des variations de prix des actions.
| Titre | Actions (en millions) |
Valeur ($ en millions) |
% du portefeuille | ΔPortefeuille % |
|---|---|---|---|---|
| 0,57 | 39,01 | 3,0501 | -4,8533 | |
| 0,04 | 3,09 | 0,2417 | -3,6316 | |
| 0,58 | 58,33 | 4,5603 | -0,9103 | |
| 0,21 | 35,58 | 2,7818 | -0,3940 | |
| 0,08 | 41,11 | 3,2138 | -0,2871 | |
| 0,23 | 10,14 | 0,7924 | -0,2246 | |
| 0,06 | 22,28 | 1,7416 | -0,1879 | |
| 0,55 | 57,61 | 4,5040 | -0,1502 | |
| 0,02 | 4,74 | 0,3707 | -0,1326 | |
| 0,13 | 7,81 | 0,6104 | -0,1000 |
Déclarations 13F et dépôts de fonds
Ce formulaire a été déposé le 2025-07-07 pour la période de déclaration 2025-06-30. Cliquez sur l'icône du lien pour voir l'historique complet des transactions.
Mettre à niveau pour débloquer les données premium et exporter vers Excel ![]() .
.
| Titre | Type | Prix moyen de l'action | Actions (en millions) |
ΔActions (%) |
ΔActions (%) |
Valeur ($ en millions) |
Portefeuille (%) |
ΔPortefeuille (%) |
|
|---|---|---|---|---|---|---|---|---|---|
| GOOGL / Alphabet Inc. | 0,49 | 8,82 | 86,77 | 23,87 | 6,7834 | 0,7349 | |||
| OTEX / Open Text Corporation | 2,56 | 9,77 | 74,71 | 26,72 | 5,8408 | 0,7497 | |||
| SLF / Sun Life Financial Inc. | 1,12 | -0,30 | 74,22 | 15,59 | 5,8028 | 0,2575 | |||
| RCI / Rogers Communications Inc. | 2,30 | -0,39 | 68,18 | 10,32 | 5,3307 | -0,0067 | |||
| BNS / The Bank of Nova Scotia | 1,12 | -0,30 | 61,87 | 15,94 | 4,8367 | 0,2288 | |||
| CM / Canadian Imperial Bank of Commerce | 0,87 | -0,37 | 61,53 | 25,35 | 4,8103 | 0,5716 | |||
| UPS / United Parcel Service, Inc. | 0,58 | 0,44 | 58,33 | -7,92 | 4,5603 | -0,9103 | |||
| CNI / Canadian National Railway Company | 0,55 | 0,12 | 57,61 | 6,89 | 4,5040 | -0,1502 | |||
| BMO / Bank of Montreal | 0,51 | -0,25 | 56,07 | 15,43 | 4,3832 | 0,1888 | |||
| EA / Electronic Arts Inc. | 0,32 | -0,19 | 50,83 | 10,17 | 3,9737 | -0,0102 | |||
| MFC / Manulife Financial Corporation | 1,52 | 16 609,63 | 48,49 | 17 034,28 | 3,7909 | 3,7664 | |||
| AMZN / Amazon.com, Inc. | 0,22 | 47,62 | 3,7228 | 3,7228 | |||||
| RY / Royal Bank of Canada | 0,33 | 1,27 | 43,05 | 18,14 | 3,3653 | 0,2189 | |||
| MGA / Magna International Inc. | 1,08 | -0,35 | 41,79 | 13,01 | 3,2670 | 0,0739 | |||
| FDX / FedEx Corporation | 0,18 | 26,45 | 41,25 | 17,78 | 3,2246 | 0,2003 | |||
| MSFT / Microsoft Corporation | 0,08 | -23,38 | 41,11 | 1,40 | 3,2138 | -0,2871 | |||
| CP / Canadian Pacific Kansas City Limited | 0,52 | -0,31 | 40,94 | 12,53 | 3,2006 | 0,0589 | |||
| CVS / CVS Health Corporation | 0,57 | -58,09 | 39,01 | -57,37 | 3,0501 | -4,8533 | |||
| HSY / The Hershey Company | 0,21 | -0,18 | 35,58 | -3,25 | 2,7818 | -0,3940 | |||
| HD / The Home Depot, Inc. | 0,06 | -0,23 | 22,28 | -0,30 | 1,7416 | -0,1879 | |||
| SAP / SAP SE - Depositary Receipt (Common Stock) | 0,04 | 1,42 | 12,19 | 14,76 | 0,9531 | 0,0358 | |||
| HDB / HDFC Bank Limited - Depositary Receipt (Common Stock) | 0,15 | -0,09 | 11,28 | 15,18 | 0,8815 | 0,0361 | |||
| YUMC / Yum China Holdings, Inc. | 0,23 | 0,31 | 10,14 | -13,94 | 0,7924 | -0,2246 | |||
| FMX / Fomento Económico Mexicano, S.A.B. de C.V. - Depositary Receipt (Common Stock) | 0,10 | 0,11 | 9,86 | 5,55 | 0,7706 | -0,0358 | |||
| UBS / UBS Group AG | 0,26 | -0,39 | 8,79 | 9,88 | 0,6872 | -0,0037 | |||
| NVO / Novo Nordisk A/S - Depositary Receipt (Common Stock) | 0,13 | 39,14 | 8,69 | 38,15 | 0,6798 | 0,1363 | |||
| MDT / Medtronic plc | 0,10 | 0,16 | 8,33 | -2,94 | 0,6512 | -0,0898 | |||
| TTE / TotalEnergies SE - Depositary Receipt (Common Stock) | 0,13 | 0,11 | 7,81 | -5,09 | 0,6104 | -0,1000 | |||
| V / Visa Inc. | 0,02 | 9,10 | 5,77 | 10,29 | 0,4510 | -0,0007 | |||
| FTS / Fortis Inc. | 0,11 | -1,09 | 5,24 | 3,38 | 0,4093 | -0,0280 | |||
| UNH / UnitedHealth Group Incorporated | 0,02 | 36,78 | 4,74 | -18,64 | 0,3707 | -0,1326 | |||
| TGT / Target Corporation | 0,04 | 18,92 | 4,34 | 12,32 | 0,3394 | 0,0056 | |||
| MDLZ / Mondelez International, Inc. | 0,06 | 0,00 | 4,31 | -0,71 | 0,3373 | -0,0379 | |||
| PEP / PepsiCo, Inc. | 0,03 | 25,63 | 4,23 | 10,52 | 0,3309 | 0,0002 | |||
| TMO / Thermo Fisher Scientific Inc. | 0,01 | 46,17 | 4,16 | 18,85 | 0,3253 | 0,0229 | |||
| GIS / General Mills, Inc. | 0,07 | 23,73 | 3,78 | 7,11 | 0,2957 | -0,0092 | |||
| SPGI / S&P Global Inc. | 0,01 | -6,67 | 3,69 | -3,25 | 0,2886 | -0,0408 | |||
| AMT / American Tower Corporation | 0,02 | -7,50 | 3,69 | -6,13 | 0,2886 | -0,0510 | |||
| DPZ / Domino's Pizza, Inc. | 0,01 | 10,69 | 3,68 | 8,32 | 0,2880 | -0,0057 | |||
| CPB / The Campbell's Company | 0,12 | 30,00 | 3,59 | -0,28 | 0,2804 | -0,0302 | |||
| GE / General Electric Company | 0,01 | 5,85 | 3,57 | 35,81 | 0,2787 | 0,0520 | |||
| VZ / Verizon Communications Inc. | 0,08 | -6,52 | 3,56 | -10,92 | 0,2781 | -0,0667 | |||
| CMCSA / Comcast Corporation | 0,09 | -9,52 | 3,27 | -12,58 | 0,2559 | -0,0674 | |||
| MA / Mastercard Incorporated | 0,01 | 6,17 | 3,19 | 8,60 | 0,2497 | -0,0043 | |||
| TD / The Toronto-Dominion Bank | 0,04 | -94,37 | 3,09 | -93,11 | 0,2417 | -3,6316 | |||
| AVGO / Broadcom Inc. | 0,01 | 2,63 | 3,08 | 68,64 | 0,2409 | 0,0831 | |||
| INTU / Intuit Inc. | 0,00 | 5,14 | 3,04 | 34,53 | 0,2377 | 0,0426 | |||
| DEO / Diageo plc - Depositary Receipt (Common Stock) | 0,03 | -0,10 | 3,01 | -3,95 | 0,2357 | -0,0354 | |||
| INFY / Infosys Limited - Depositary Receipt (Common Stock) | 0,16 | 0,00 | 3,00 | 1,45 | 0,2347 | -0,0209 | |||
| CTAS / Cintas Corporation | 0,01 | 2,46 | 2,95 | 10,85 | 0,2308 | 0,0008 | |||
| WAB / Westinghouse Air Brake Technologies Corporation | 0,01 | 7,82 | 2,80 | 24,20 | 0,2191 | 0,0242 | |||
| MCO / Moody's Corporation | 0,01 | 6,18 | 2,76 | 14,13 | 0,2154 | 0,0069 | |||
| SHW / The Sherwin-Williams Company | 0,01 | 7,79 | 2,69 | 5,73 | 0,2107 | -0,0094 | |||
| AMAT / Applied Materials, Inc. | 0,01 | 5,74 | 2,69 | 33,07 | 0,2105 | 0,0358 | |||
| MMC / Marsh & McLennan Companies, Inc. | 0,01 | 8,18 | 2,60 | -3,31 | 0,2032 | -0,0289 | |||
| MCK / McKesson Corporation | 0,00 | -18,54 | 2,57 | -11,52 | 0,2006 | -0,0498 | |||
| MSCI / MSCI Inc. | 0,00 | 6,07 | 2,53 | 7,92 | 0,1981 | -0,0046 | |||
| LLY / Eli Lilly and Company | 0,00 | 10,75 | 2,51 | 4,28 | 0,1962 | -0,0116 | |||
| ACN / Accenture plc | 0,01 | 2,50 | 0,1953 | 0,1953 | |||||
| CARR / Carrier Global Corporation | 0,03 | 6,23 | 2,44 | 22,39 | 0,1906 | 0,0185 | |||
| ODFL / Old Dominion Freight Line, Inc. | 0,01 | 6,49 | 2,31 | 4,19 | 0,1807 | -0,0108 | |||
| ZTS / Zoetis Inc. | 0,01 | 7,15 | 2,24 | 1,22 | 0,1749 | -0,0159 | |||
| BRK.B / Berkshire Hathaway Inc. | 0,00 | 10,34 | 2,17 | 0,42 | 0,1700 | -0,0170 | |||
| BKFOF / Brookfield Corporation - Preferred Stock | 0,04 | 16,34 | 2,16 | 37,16 | 0,1692 | 0,0330 | |||
| ICE / Intercontinental Exchange, Inc. | 0,01 | -7,08 | 2,15 | -1,42 | 0,1681 | -0,0202 | |||
| EBGEF / Enbridge Inc. - Preferred Stock | 0,05 | 1,80 | 2,04 | 3,98 | 0,1593 | -0,0099 | |||
| BIP / Brookfield Infrastructure Partners L.P. - Limited Partnership | 0,05 | 99,45 | 1,58 | 123,94 | 0,1236 | 0,0627 | |||
| WPM / Wheaton Precious Metals Corp. | 0,02 | 11,50 | 1,47 | 28,85 | 0,1153 | 0,0164 | |||
| CNQ / Canadian Natural Resources Limited | 0,05 | 7,61 | 1,44 | 9,53 | 0,1123 | -0,0009 | |||
| TFII / TFI International Inc. | 0,02 | 38,05 | 1,38 | 59,65 | 0,1080 | 0,0332 | |||
| AME / AMETEK, Inc. | 0,01 | 12,60 | 1,36 | 18,10 | 0,1067 | 0,0069 | |||
| MRK / Merck & Co., Inc. | 0,02 | 5,94 | 1,22 | -6,83 | 0,0950 | -0,0176 | |||
| BSY / Bentley Systems, Incorporated | 0,02 | -25,12 | 1,09 | 2,54 | 0,0851 | -0,0066 | |||
| HON / Honeywell International Inc. | 0,00 | 17,87 | 1,08 | 29,45 | 0,0842 | 0,0123 | |||
| TRI / Thomson Reuters Corporation | 0,01 | 11,91 | 1,07 | 30,05 | 0,0836 | 0,0126 | |||
| LOW / Lowe's Companies, Inc. | 0,00 | 8,44 | 1,05 | 2,94 | 0,0821 | -0,0060 | |||
| NVS / Novartis AG - Depositary Receipt (Common Stock) | 0,01 | 18,28 | 1,01 | 28,19 | 0,0793 | 0,0110 | |||
| AON / Aon plc | 0,00 | 19,77 | 1,00 | 6,83 | 0,0783 | -0,0026 | |||
| UL / Unilever PLC - Depositary Receipt (Common Stock) | 0,02 | 9,77 | 0,94 | 12,64 | 0,0732 | 0,0014 | |||
| TXN / Texas Instruments Incorporated | 0,00 | 11,21 | 0,92 | 28,15 | 0,0716 | 0,0099 | |||
| DHR / Danaher Corporation | 0,00 | 57,17 | 0,85 | 51,43 | 0,0663 | 0,0179 | |||
| HEI / HEICO Corporation | 0,00 | 12,87 | 0,84 | 38,25 | 0,0653 | 0,0131 | |||
| CSCO / Cisco Systems, Inc. | 0,01 | -7,96 | 0,82 | 3,27 | 0,0643 | -0,0045 | |||
| TSM / Taiwan Semiconductor Manufacturing Company Limited - Depositary Receipt (Common Stock) | 0,00 | 0,77 | 0,0602 | 0,0602 | |||||
| DE / Deere & Company | 0,00 | 9,99 | 0,75 | 19,08 | 0,0586 | 0,0042 | |||
| AAPL / Apple Inc. | 0,00 | 5,02 | 0,72 | -3,12 | 0,0559 | -0,0079 | |||
| TSLA / Tesla, Inc. | 0,00 | 0,00 | 0,71 | 22,30 | 0,0558 | 0,0054 | |||
| ROP / Roper Technologies, Inc. | 0,00 | 11,83 | 0,71 | 7,29 | 0,0552 | -0,0016 | |||
| LIN / Linde plc | 0,00 | 21,99 | 0,70 | 22,73 | 0,0549 | 0,0055 | |||
| KLAC / KLA Corporation | 0,00 | 21,04 | 0,66 | 59,23 | 0,0519 | 0,0159 | |||
| MEOH / Methanex Corporation | 0,02 | 150,12 | 0,64 | 135,56 | 0,0498 | 0,0264 | |||
| BDX / Becton, Dickinson and Company | 0,00 | 24,34 | 0,62 | -6,80 | 0,0483 | -0,0089 | |||
| VLTO / Veralto Corporation | 0,01 | 33,22 | 0,60 | 37,84 | 0,0470 | 0,0093 | |||
| META / Meta Platforms, Inc. | 0,00 | 10,09 | 0,51 | 40,82 | 0,0402 | 0,0086 | |||
| IGSB / iShares Trust - iShares 1-5 Year Investment Grade Corporate Bond ETF | 0,01 | 0,00 | 0,36 | 0,28 | 0,0281 | -0,0028 | |||
| SU / Suncor Energy Inc. | 0,01 | 19,86 | 0,32 | 15,58 | 0,0250 | 0,0011 | |||
| WM / Waste Management, Inc. | 0,00 | 34,50 | 0,32 | 32,64 | 0,0248 | 0,0042 | |||
| IEI / iShares Trust - iShares 3-7 Year Treasury Bond ETF | 0,00 | 0,00 | 0,31 | 0,65 | 0,0242 | -0,0024 | |||
| TRP / TC Energy Corporation | 0,01 | 18,16 | 0,28 | 22,08 | 0,0221 | 0,0021 | |||
| AQN / Algonquin Power & Utilities Corp. | 0,05 | 26,39 | 0,27 | 40,00 | 0,0214 | 0,0046 | |||
| TU / TELUS Corporation | 0,02 | 53,12 | 0,26 | 71,43 | 0,0207 | 0,0073 | |||
| MCHP / Microchip Technology Incorporated | 0,00 | -100,00 | 0,00 | 0,0000 | |||||
| VET / Vermilion Energy Inc. | 0,00 | -100,00 | 0,00 | 0,0000 |