Statistiques de base
| Valeur du portefeuille | $ 154 799 283 |
| Positions actuelles | 45 |
Dernières positions, performances, ASG (à partir des dépôts 13F, 13D)
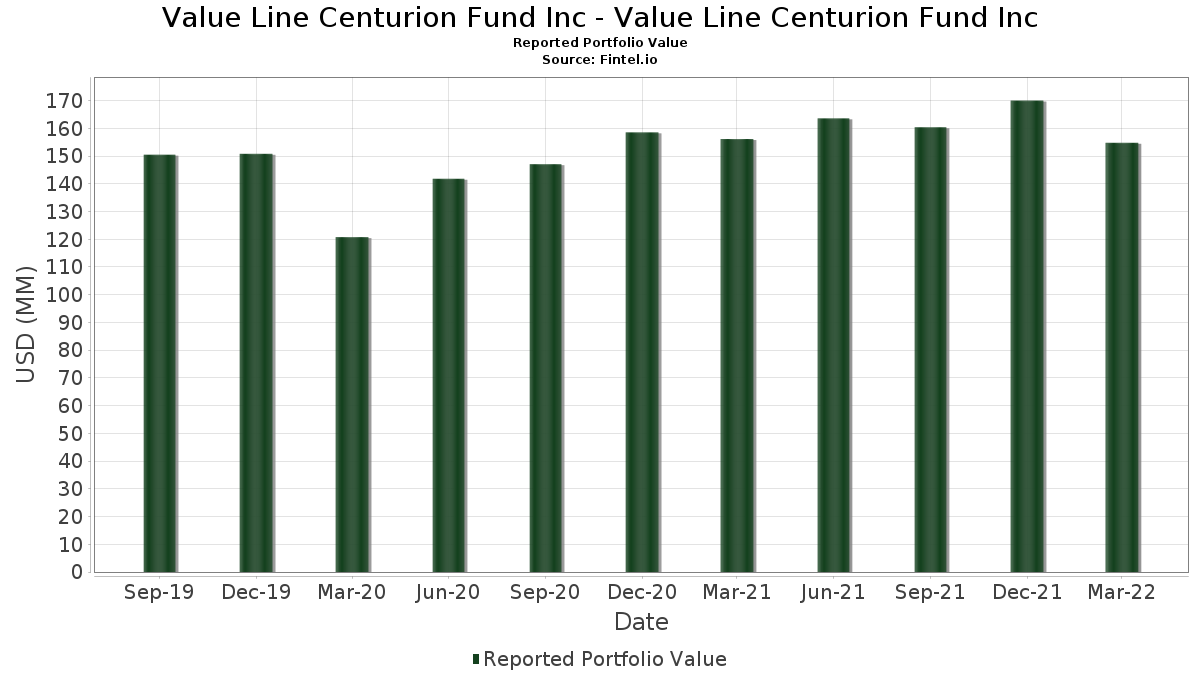
Value Line Centurion Fund Inc - Value Line Centurion Fund Inc a déclaré un total de 45 positions dans ses derniers dépôts auprès de la SEC. La valeur la plus récente du portefeuille est calculée à 154 799 283 USD. Les actifs sous gestion réels (ASG) sont cette valeur plus les liquidités (qui ne sont pas divulguées). Les principales positions de Value Line Centurion Fund Inc - Value Line Centurion Fund Inc sont State Street Institutional Investment Trust - State Street Institutional US Govt Money Market Fnd Premier Cls (US:GVMXX) , Roper Technologies, Inc. (US:ROP) , Waste Connections, Inc. (US:WCN) , AutoZone, Inc. (US:AZO) , and Fiserv, Inc. (US:FISV) . Les nouvelles positions de Value Line Centurion Fund Inc - Value Line Centurion Fund Inc incluent S&P Global Inc. (US:SPGI) , .
Meilleures augmentations ce trimestre
Nous utilisons la variation de l'allocation du portefeuille car il s'agit de l'indicateur le plus significatif. Les changements peuvent être dus à des transactions ou à des variations de prix des actions.
| Titre | Actions (en millions) |
Valeur ($ en millions) |
% du portefeuille | ΔPortefeuille % |
|---|---|---|---|---|
| 29,97 | 29,97 | 19,2850 | 17,2856 | |
| 0,01 | 3,15 | 2,0244 | 2,0244 | |
| 0,04 | 2,37 | 1,5231 | 0,3792 | |
| 0,01 | 2,68 | 1,7264 | 0,3659 | |
| 0,00 | 5,72 | 3,6833 | 0,2445 | |
| 0,02 | 7,27 | 4,6789 | 0,2415 | |
| 0,01 | 1,64 | 1,0523 | 0,2403 | |
| 0,01 | 2,43 | 1,5606 | 0,2395 | |
| 0,05 | 5,19 | 3,3403 | 0,2271 | |
| 0,01 | 2,18 | 1,4054 | 0,1987 |
Principales baisses ce trimestre
Nous utilisons la variation de l'allocation du portefeuille car il s'agit de l'indicateur le plus significatif. Les changements peuvent être dus à des transactions ou à des variations de prix des actions.
| Titre | Actions (en millions) |
Valeur ($ en millions) |
% du portefeuille | ΔPortefeuille % |
|---|---|---|---|---|
| 0,00 | 3,71 | 2,3854 | -2,9837 | |
| 0,01 | 2,36 | 1,5204 | -2,4467 | |
| 0,00 | 0,00 | -2,1048 | ||
| 0,03 | 2,80 | 1,8031 | -1,8958 | |
| 0,01 | 1,17 | 0,7535 | -1,3770 | |
| 0,00 | 0,46 | 0,2948 | -1,2120 | |
| 0,14 | 4,82 | 3,1007 | -1,1981 | |
| 0,00 | 0,69 | 0,4452 | -1,1748 | |
| 0,02 | 3,43 | 2,2062 | -0,8382 | |
| 0,01 | 1,89 | 1,2174 | -0,7721 |
Déclarations 13F et dépôts de fonds
Ce formulaire a été déposé le 2022-05-27 pour la période de déclaration 2022-03-31. Cliquez sur l'icône du lien pour voir l'historique complet des transactions.
Mettre à niveau pour débloquer les données premium et exporter vers Excel ![]() .
.
| Titre | Type | Prix moyen de l'action | Actions (en millions) |
ΔActions (%) |
ΔActions (%) |
Valeur ($ en millions) |
Portefeuille (%) |
ΔPortefeuille (%) |
|
|---|---|---|---|---|---|---|---|---|---|
| GVMXX / State Street Institutional Investment Trust - State Street Institutional US Govt Money Market Fnd Premier Cls | 29,97 | 778,27 | 29,97 | 778,49 | 19,2850 | 17,2856 | |||
| ROP / Roper Technologies, Inc. | 0,02 | 0,00 | 7,27 | -3,99 | 4,6789 | 0,2415 | |||
| WCN / Waste Connections, Inc. | 0,04 | -16,57 | 5,98 | -14,46 | 3,8469 | -0,2484 | |||
| AZO / AutoZone, Inc. | 0,00 | 0,00 | 5,72 | -2,47 | 3,6833 | 0,2445 | |||
| FISV / Fiserv, Inc. | 0,05 | 0,00 | 5,19 | -2,31 | 3,3403 | 0,2271 | |||
| IDXX / IDEXX Laboratories, Inc. | 0,01 | 0,00 | 5,09 | -16,92 | 3,2733 | -0,3141 | |||
| IT / Gartner, Inc. | 0,02 | 0,00 | 5,03 | -11,03 | 3,2344 | -0,0756 | |||
| ANSS / ANSYS, Inc. | 0,02 | 0,00 | 5,02 | -20,81 | 3,2291 | -0,4837 | |||
| EFX / Equifax Inc. | 0,02 | 0,00 | 4,86 | -19,03 | 3,1272 | -0,3891 | |||
| ROL / Rollins, Inc. | 0,14 | -35,90 | 4,82 | -34,33 | 3,1007 | -1,1981 | |||
| AME / AMETEK, Inc. | 0,04 | 0,00 | 4,66 | -9,42 | 2,9990 | -0,0159 | |||
| TJX / The TJX Companies, Inc. | 0,07 | 0,00 | 4,41 | -20,20 | 2,8375 | -0,4004 | |||
| RSG / Republic Services, Inc. | 0,03 | 0,00 | 4,24 | -4,98 | 2,7280 | 0,1137 | |||
| CDNS / Cadence Design Systems, Inc. | 0,03 | 0,00 | 4,11 | -11,74 | 2,6453 | -0,0840 | |||
| MTD / Mettler-Toledo International Inc. | 0,00 | -50,00 | 3,71 | -59,55 | 2,3854 | -2,9837 | |||
| HEI / HEICO Corporation | 0,02 | -38,02 | 3,43 | -34,01 | 2,2062 | -0,8382 | |||
| CSL / Carlisle Companies Incorporated | 0,01 | 0,00 | 3,39 | -0,91 | 2,1835 | 0,1775 | |||
| SPGI / S&P Global Inc. | 0,01 | 3,15 | 2,0244 | 2,0244 | |||||
| ECL / Ecolab Inc. | 0,02 | 0,00 | 3,00 | -24,75 | 1,9311 | -0,4052 | |||
| CHD / Church & Dwight Co., Inc. | 0,03 | -54,22 | 2,80 | -55,62 | 1,8031 | -1,8958 | |||
| NOC / Northrop Grumman Corporation | 0,01 | 0,00 | 2,68 | 15,55 | 1,7264 | 0,3659 | |||
| ORLY / O'Reilly Automotive, Inc. | 0,00 | 0,00 | 2,60 | -3,02 | 1,6746 | 0,1025 | |||
| TYL / Tyler Technologies, Inc. | 0,01 | 0,00 | 2,49 | -17,29 | 1,6004 | -0,1616 | |||
| FICO / Fair Isaac Corporation | 0,01 | 0,00 | 2,43 | 7,54 | 1,5606 | 0,2395 | |||
| WRB / W. R. Berkley Corporation | 0,04 | 50,00 | 2,37 | 21,26 | 1,5231 | 0,3792 | |||
| TDY / Teledyne Technologies Incorporated | 0,01 | -67,74 | 2,36 | -65,10 | 1,5204 | -2,4467 | |||
| TDG / TransDigm Group Incorporated | 0,00 | 0,00 | 2,35 | 2,40 | 1,5091 | 0,1672 | |||
| AFG / American Financial Group, Inc. | 0,01 | 0,00 | 2,18 | 6,07 | 1,4054 | 0,1987 | |||
| RNR / RenaissanceRe Holdings Ltd. | 0,01 | 0,00 | 2,14 | -6,39 | 1,3768 | 0,0376 | |||
| AMT / American Tower Corporation | 0,01 | 0,00 | 2,01 | -14,15 | 1,2931 | -0,0778 | |||
| JJSF / J&J Snack Foods Corp. | 0,01 | -43,26 | 1,89 | -44,29 | 1,2174 | -0,7721 | |||
| CHE / Chemed Corporation | 0,00 | -34,00 | 1,67 | -36,82 | 1,0755 | -0,4741 | |||
| JKHY / Jack Henry & Associates, Inc. | 0,01 | 0,00 | 1,64 | 17,97 | 1,0523 | 0,2403 | |||
| CTAS / Cintas Corporation | 0,00 | 0,00 | 1,49 | -4,06 | 0,9579 | 0,0492 | |||
| BLL / Ball Corp. | 0,01 | 0,00 | 1,30 | -6,49 | 0,8338 | 0,0217 | |||
| TTC / The Toro Company | 0,01 | -62,36 | 1,17 | -67,79 | 0,7535 | -1,3770 | |||
| EXPO / Exponent, Inc. | 0,01 | -33,33 | 1,17 | -38,34 | 0,7508 | -0,3570 | |||
| COO / The Cooper Companies, Inc. | 0,00 | 0,00 | 1,09 | -0,37 | 0,6985 | 0,0604 | |||
| DPZ / Domino's Pizza, Inc. | 0,00 | -65,31 | 0,69 | -75,01 | 0,4452 | -1,1748 | |||
| ELS / Equity LifeStyle Properties, Inc. | 0,01 | 0,00 | 0,61 | -12,84 | 0,3937 | -0,0172 | |||
| GIB / CGI Inc. | 0,01 | -33,64 | 0,58 | -40,18 | 0,3749 | -0,1954 | |||
| IEX / IDEX Corporation | 0,00 | 0,00 | 0,58 | -18,79 | 0,3701 | -0,0453 | |||
| OTEX / Open Text Corporation | 0,01 | -65,71 | 0,51 | -69,42 | 0,3274 | -0,6462 | |||
| ACGL / Arch Capital Group Ltd. | 0,01 | 0,00 | 0,49 | 8,83 | 0,3178 | 0,0521 | |||
| ATR / AptarGroup, Inc. | 0,00 | -81,43 | 0,46 | -82,19 | 0,2948 | -1,2120 | |||
| INFO / Harbor ETF Trust - Harbor PanAgora Dynamic Large Cap Core ETF | 0,00 | -100,00 | 0,00 | -100,00 | -2,1048 |