Statistiques de base
| Valeur du portefeuille | $ 133 600 474 |
| Positions actuelles | 115 |
Dernières positions, performances, ASG (à partir des dépôts 13F, 13D)
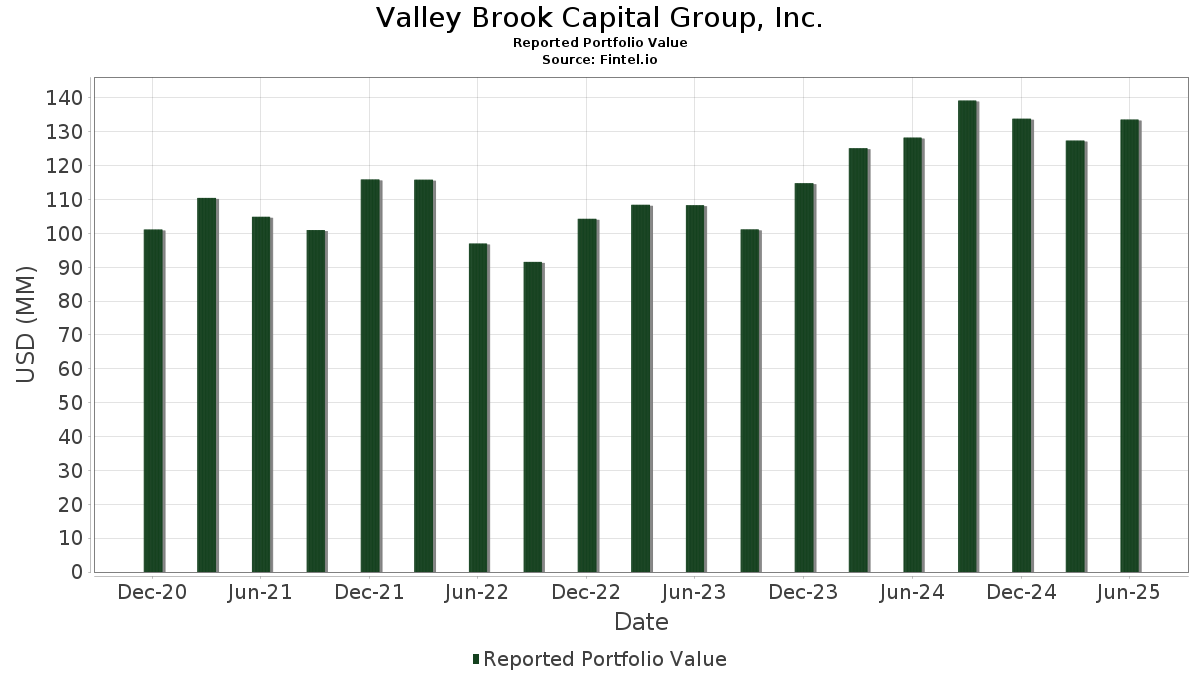
Valley Brook Capital Group, Inc. a déclaré un total de 115 positions dans ses derniers dépôts auprès de la SEC. La valeur la plus récente du portefeuille est calculée à 133 600 474 USD. Les actifs sous gestion réels (ASG) sont cette valeur plus les liquidités (qui ne sont pas divulguées). Les principales positions de Valley Brook Capital Group, Inc. sont Microsoft Corporation (US:MSFT) , Apple Inc. (US:AAPL) , JPMorgan Chase & Co. (US:JPM) , The Home Depot, Inc. (US:HD) , and Direxion Shares ETF Trust - Direxion Daily NVDA Bear 1X Shares (US:NVDD) . Les nouvelles positions de Valley Brook Capital Group, Inc. incluent Constellation Energy Corporation (US:CEG) , The Gabelli Utility Trust (US:GUT) , .
Meilleures augmentations ce trimestre
Nous utilisons la variation de l'allocation du portefeuille car il s'agit de l'indicateur le plus significatif. Les changements peuvent être dus à des transactions ou à des variations de prix des actions.
| Titre | Actions (en millions) |
Valeur ($ en millions) |
% du portefeuille | ΔPortefeuille % |
|---|---|---|---|---|
| 0,02 | 12,28 | 9,1946 | 1,7704 | |
| 0,02 | 4,46 | 3,3405 | 1,0976 | |
| 0,03 | 4,49 | 3,3583 | 0,7059 | |
| 0,02 | 5,04 | 3,7748 | 0,4545 | |
| 0,00 | 2,24 | 1,6751 | 0,3137 | |
| 0,02 | 3,36 | 2,5151 | 0,3105 | |
| 0,00 | 1,22 | 0,9111 | 0,2794 | |
| 0,00 | 1,00 | 0,7453 | 0,2222 | |
| 0,00 | 1,20 | 0,8985 | 0,2090 | |
| 0,01 | 2,95 | 2,2071 | 0,1877 |
Principales baisses ce trimestre
Nous utilisons la variation de l'allocation du portefeuille car il s'agit de l'indicateur le plus significatif. Les changements peuvent être dus à des transactions ou à des variations de prix des actions.
| Titre | Actions (en millions) |
Valeur ($ en millions) |
% du portefeuille | ΔPortefeuille % |
|---|---|---|---|---|
| 0,04 | 8,91 | 6,6682 | -1,6964 | |
| 0,02 | 4,23 | 3,1666 | -0,6025 | |
| 0,00 | 1,28 | 0,9545 | -0,3638 | |
| 0,01 | 4,63 | 3,4619 | -0,2549 | |
| 0,01 | 3,13 | 2,3406 | -0,2279 | |
| 0,01 | 1,50 | 1,1257 | -0,2099 | |
| 0,01 | 1,68 | 1,2605 | -0,1747 | |
| 0,01 | 1,03 | 0,7735 | -0,1742 | |
| 0,01 | 1,99 | 1,4904 | -0,1660 | |
| 0,01 | 1,07 | 0,7988 | -0,1643 |
Déclarations 13F et dépôts de fonds
Ce formulaire a été déposé le 2025-07-25 pour la période de déclaration 2025-06-30. Cliquez sur l'icône du lien pour voir l'historique complet des transactions.
Mettre à niveau pour débloquer les données premium et exporter vers Excel ![]() .
.
| Titre | Type | Prix moyen de l'action | Actions (en millions) |
ΔActions (%) |
ΔActions (%) |
Valeur ($ en millions) |
Portefeuille (%) |
ΔPortefeuille (%) |
|
|---|---|---|---|---|---|---|---|---|---|
| MSFT / Microsoft Corporation | 0,02 | -1,98 | 12,28 | 29,89 | 9,1946 | 1,7704 | |||
| AAPL / Apple Inc. | 0,04 | -9,48 | 8,91 | -16,40 | 6,6682 | -1,6964 | |||
| JPM / JPMorgan Chase & Co. | 0,02 | 0,88 | 5,04 | 19,25 | 3,7748 | 0,4545 | |||
| HD / The Home Depot, Inc. | 0,01 | -2,36 | 4,63 | -2,30 | 3,4619 | -0,2549 | |||
| NVDD / Direxion Shares ETF Trust - Direxion Daily NVDA Bear 1X Shares | 0,03 | -8,91 | 4,49 | 32,80 | 3,3583 | 0,7059 | |||
| AVGO / Broadcom Inc. | 0,02 | -5,13 | 4,46 | 56,18 | 3,3405 | 1,0976 | |||
| ABBV / AbbVie Inc. | 0,02 | -0,55 | 4,23 | -11,89 | 3,1666 | -0,6025 | |||
| AMZN / Amazon.com, Inc. | 0,02 | 3,76 | 3,36 | 19,66 | 2,5151 | 0,3105 | |||
| UNP / Union Pacific Corporation | 0,01 | -1,88 | 3,13 | -4,43 | 2,3406 | -0,2279 | |||
| RTX / RTX Corporation | 0,02 | -0,75 | 2,98 | 9,42 | 2,2275 | 0,0924 | |||
| CAT / Caterpillar Inc. | 0,01 | -2,63 | 2,95 | 14,62 | 2,2071 | 0,1877 | |||
| WMT / Walmart Inc. | 0,03 | -0,45 | 2,65 | 10,85 | 1,9819 | 0,1073 | |||
| DE / Deere & Company | 0,00 | -3,31 | 2,54 | 4,74 | 1,9024 | -0,0020 | |||
| V / Visa Inc. | 0,01 | -0,99 | 2,52 | 0,32 | 1,8864 | -0,0858 | |||
| COST / Costco Wholesale Corporation | 0,00 | 1,44 | 2,45 | 6,17 | 1,8305 | 0,0224 | |||
| META / Meta Platforms, Inc. | 0,00 | 0,76 | 2,24 | 29,01 | 1,6751 | 0,3137 | |||
| MCD / McDonald's Corporation | 0,01 | 0,89 | 1,99 | -5,64 | 1,4904 | -0,1660 | |||
| PNC / The PNC Financial Services Group, Inc. | 0,01 | -1,49 | 1,96 | 4,48 | 1,4650 | -0,0056 | |||
| GOOG / Alphabet Inc. | 0,01 | 1,79 | 1,82 | 15,57 | 1,3618 | 0,1261 | |||
| JNJ / Johnson & Johnson | 0,01 | 0,00 | 1,68 | -7,88 | 1,2605 | -0,1747 | |||
| ADP / Automatic Data Processing, Inc. | 0,00 | -0,80 | 1,53 | 0,13 | 1,1461 | -0,0543 | |||
| XOM / Exxon Mobil Corporation | 0,01 | -2,48 | 1,50 | -11,64 | 1,1257 | -0,2099 | |||
| BRK.B / Berkshire Hathaway Inc. | 0,00 | 4,91 | 1,48 | -4,26 | 1,1101 | -0,1065 | |||
| GJR / Strats Trust For Procter & Gambel Security - Preferred Security | 0,01 | 0,00 | 1,46 | -6,46 | 1,0951 | -0,1334 | |||
| ABT / Abbott Laboratories | 0,01 | 0,00 | 1,44 | 2,56 | 1,0781 | -0,0246 | |||
| ITW / Illinois Tool Works Inc. | 0,01 | 0,17 | 1,42 | -0,14 | 1,0641 | -0,0533 | |||
| CRM / Salesforce, Inc. | 0,00 | 5,52 | 1,36 | 7,28 | 1,0143 | 0,0223 | |||
| TMO / Thermo Fisher Scientific Inc. | 0,00 | -6,81 | 1,28 | -24,06 | 0,9545 | -0,3638 | |||
| LLY / Eli Lilly and Company | 0,00 | 1,26 | 1,25 | -4,44 | 0,9347 | -0,0909 | |||
| TJX / The TJX Companies, Inc. | 0,01 | 0,71 | 1,24 | 2,06 | 0,9258 | -0,0251 | |||
| NFLX / Netflix, Inc. | 0,00 | 5,33 | 1,22 | 51,37 | 0,9111 | 0,2794 | |||
| GE / General Electric Company | 0,00 | 6,27 | 1,20 | 36,67 | 0,8985 | 0,2090 | |||
| AMGN / Amgen Inc. | 0,00 | -0,12 | 1,18 | -10,49 | 0,8812 | -0,1511 | |||
| LMT / Lockheed Martin Corporation | 0,00 | -4,87 | 1,09 | -1,36 | 0,8129 | -0,0515 | |||
| MA / Mastercard Incorporated | 0,00 | 3,13 | 1,07 | 5,71 | 0,8046 | 0,0065 | |||
| PEP / PepsiCo, Inc. | 0,01 | -1,22 | 1,07 | -12,97 | 0,7988 | -0,1643 | |||
| HON / Honeywell International Inc. | 0,00 | -5,56 | 1,05 | 3,86 | 0,7853 | -0,0076 | |||
| CVX / Chevron Corporation | 0,01 | 0,01 | 1,03 | -14,42 | 0,7735 | -0,1742 | |||
| NEE / NextEra Energy, Inc. | 0,01 | -3,37 | 1,00 | -5,37 | 0,7515 | -0,0814 | |||
| CRWD / CrowdStrike Holdings, Inc. | 0,00 | 3,44 | 1,00 | 49,40 | 0,7453 | 0,2222 | |||
| MPC / Marathon Petroleum Corporation | 0,01 | -0,76 | 0,98 | 13,15 | 0,7348 | 0,0538 | |||
| CARR / Carrier Global Corporation | 0,01 | -2,02 | 0,98 | 13,19 | 0,7324 | 0,0534 | |||
| FTXP / Foothills Exploration, Inc. | 0,00 | 1,94 | 0,94 | 34,33 | 0,7060 | 0,1548 | |||
| GOOGL / Alphabet Inc. | 0,00 | 3,97 | 0,85 | 18,47 | 0,6388 | 0,0734 | |||
| SO / The Southern Company | 0,01 | 0,62 | 0,77 | 0,52 | 0,5780 | -0,0252 | |||
| EMR / Emerson Electric Co. | 0,01 | 0,00 | 0,76 | 21,69 | 0,5713 | 0,0786 | |||
| CB / Chubb Limited | 0,00 | -0,96 | 0,75 | -4,97 | 0,5584 | -0,0579 | |||
| CSX / CSX Corporation | 0,02 | -2,20 | 0,73 | 8,52 | 0,5434 | 0,0179 | |||
| APD / Air Products and Chemicals, Inc. | 0,00 | 1,04 | 0,69 | -3,37 | 0,5151 | -0,0440 | |||
| PSX / Phillips 66 | 0,01 | -3,35 | 0,69 | -6,54 | 0,5135 | -0,0631 | |||
| GAB / The Gabelli Equity Trust Inc. | 0,12 | 2,66 | 0,67 | 8,53 | 0,5046 | 0,0166 | |||
| LRCX / Lam Research Corporation | 0,01 | 1,96 | 0,66 | 36,51 | 0,4925 | 0,1142 | |||
| NKE / NIKE, Inc. | 0,01 | -2,69 | 0,64 | 8,81 | 0,4812 | 0,0178 | |||
| NOW / ServiceNow, Inc. | 0,00 | 5,97 | 0,64 | 36,91 | 0,4779 | 0,1116 | |||
| TSM / Taiwan Semiconductor Manufacturing Company Limited - Depositary Receipt (Common Stock) | 0,00 | 26,83 | 0,62 | 73,06 | 0,4664 | 0,1837 | |||
| PSI / Invesco Exchange-Traded Fund Trust - Invesco Semiconductors ETF | 0,01 | -6,05 | 0,62 | 18,93 | 0,4661 | 0,0549 | |||
| NVS / Novartis AG - Depositary Receipt (Common Stock) | 0,00 | 0,00 | 0,60 | 8,70 | 0,4492 | 0,0152 | |||
| VZ / Verizon Communications Inc. | 0,01 | -4,27 | 0,58 | -8,66 | 0,4347 | -0,0645 | |||
| ASML / ASML Holding N.V. - Depositary Receipt (Common Stock) | 0,00 | 22,82 | 0,56 | 48,42 | 0,4229 | 0,1243 | |||
| TRGP / Targa Resources Corp. | 0,00 | -0,79 | 0,55 | -13,90 | 0,4085 | -0,0888 | |||
| ETN / Eaton Corporation plc | 0,00 | -0,33 | 0,54 | 30,81 | 0,4008 | 0,0797 | |||
| VST / Vistra Corp. | 0,00 | 14,41 | 0,52 | 88,64 | 0,3859 | 0,1715 | |||
| TRV / The Travelers Companies, Inc. | 0,00 | 0,00 | 0,51 | 1,18 | 0,3841 | -0,0141 | |||
| OTIS / Otis Worldwide Corporation | 0,01 | 0,00 | 0,50 | -4,02 | 0,3754 | -0,0349 | |||
| ADBE / Adobe Inc. | 0,00 | -7,33 | 0,49 | -6,50 | 0,3663 | -0,0446 | |||
| PANW / Palo Alto Networks, Inc. | 0,00 | -2,09 | 0,48 | 17,36 | 0,3597 | 0,0384 | |||
| TXN / Texas Instruments Incorporated | 0,00 | 0,00 | 0,48 | 15,42 | 0,3590 | 0,0331 | |||
| ES / Eversource Energy | 0,01 | 0,00 | 0,48 | 2,36 | 0,3585 | -0,0085 | |||
| SHW / The Sherwin-Williams Company | 0,00 | 2,42 | 0,45 | 0,90 | 0,3369 | -0,0140 | |||
| FTEC / Fidelity Covington Trust - Fidelity MSCI Information Technology Index ETF | 0,00 | 0,67 | 0,45 | 23,20 | 0,3341 | 0,0495 | |||
| ACN / Accenture plc | 0,00 | 0,00 | 0,44 | -4,15 | 0,3289 | -0,0312 | |||
| PPA / Invesco Exchange-Traded Fund Trust - Invesco Aerospace & Defense ETF | 0,00 | 1,64 | 0,44 | 23,66 | 0,3289 | 0,0497 | |||
| VMC / Vulcan Materials Company | 0,00 | 5,99 | 0,44 | 18,70 | 0,3280 | 0,0377 | |||
| DIS / The Walt Disney Company | 0,00 | -4,62 | 0,43 | 19,89 | 0,3255 | 0,0406 | |||
| ROK / Rockwell Automation, Inc. | 0,00 | 0,00 | 0,43 | 28,66 | 0,3232 | 0,0595 | |||
| FIDU / Fidelity Covington Trust - Fidelity MSCI Industrials Index ETF | 0,01 | 1,37 | 0,43 | 14,93 | 0,3228 | 0,0279 | |||
| RPG / Invesco Exchange-Traded Fund Trust - Invesco S&P 500 Pure Growth ETF | 0,01 | -1,66 | 0,40 | 17,89 | 0,3012 | 0,0327 | |||
| GEV / GE Vernova Inc. | 0,00 | -3,22 | 0,40 | 67,51 | 0,2978 | 0,1116 | |||
| AMT / American Tower Corporation | 0,00 | 0,00 | 0,40 | 1,53 | 0,2978 | -0,0097 | |||
| MINT / PIMCO ETF Trust - PIMCO Enhanced Short Maturity Active Exchange-Traded Fund | 0,00 | 1,70 | 0,40 | 1,53 | 0,2975 | -0,0095 | |||
| GIS / General Mills, Inc. | 0,01 | 0,00 | 0,39 | -13,23 | 0,2899 | -0,0610 | |||
| GD / General Dynamics Corporation | 0,00 | 0,08 | 0,38 | 6,98 | 0,2874 | 0,0057 | |||
| KMI / Kinder Morgan, Inc. | 0,01 | -3,76 | 0,38 | -0,79 | 0,2815 | -0,0162 | |||
| XLG / Invesco Exchange-Traded Fund Trust - Invesco S&P 500 Top 50 ETF | 0,01 | 9,51 | 0,38 | 24,17 | 0,2808 | 0,0433 | |||
| CL / Colgate-Palmolive Company | 0,00 | -5,57 | 0,36 | -8,33 | 0,2722 | -0,0394 | |||
| LOW / Lowe's Companies, Inc. | 0,00 | 0,00 | 0,35 | -5,09 | 0,2657 | -0,0272 | |||
| FNCL / Fidelity Covington Trust - Fidelity MSCI Financials Index ETF | 0,00 | 1,15 | 0,33 | 7,49 | 0,2478 | 0,0066 | |||
| BMY / Bristol-Myers Squibb Company | 0,01 | 0,00 | 0,32 | -24,10 | 0,2363 | -0,0902 | |||
| PPT / Putnam Premier Income Trust | 0,08 | 1,34 | 0,31 | 3,00 | 0,2318 | -0,0042 | |||
| OKE / ONEOK, Inc. | 0,00 | -7,35 | 0,31 | -23,95 | 0,2311 | -0,0868 | |||
| BLK / BlackRock, Inc. | 0,00 | 2,46 | 0,31 | 13,75 | 0,2291 | 0,0173 | |||
| CNI / Canadian National Railway Company | 0,00 | 0,00 | 0,30 | 6,74 | 0,2258 | 0,0040 | |||
| HSY / The Hershey Company | 0,00 | 0,00 | 0,29 | -3,06 | 0,2136 | -0,0173 | |||
| FHLC / Fidelity Covington Trust - Fidelity MSCI Health Care Index ETF | 0,00 | 0,69 | 0,28 | -5,76 | 0,2084 | -0,0235 | |||
| ED / Consolidated Edison, Inc. | 0,00 | 0,00 | 0,28 | -9,54 | 0,2066 | -0,0322 | |||
| ISRG / Intuitive Surgical, Inc. | 0,00 | -4,90 | 0,26 | 4,37 | 0,1973 | -0,0010 | |||
| SCCO / Southern Copper Corporation | 0,00 | -3,67 | 0,26 | 4,05 | 0,1929 | -0,0011 | |||
| FTHI / First Trust Exchange-Traded Fund VI - First Trust BuyWrite Income ETF | 0,01 | 0,24 | 0,26 | 4,94 | 0,1912 | -0,0002 | |||
| BTZ / BlackRock Credit Allocation Income Trust | 0,02 | 0,36 | 0,24 | 2,17 | 0,1760 | -0,0046 | |||
| SBUX / Starbucks Corporation | 0,00 | 1,42 | 0,23 | -5,37 | 0,1720 | -0,0184 | |||
| IDXX / IDEXX Laboratories, Inc. | 0,00 | 0,23 | 0,1706 | 0,1706 | |||||
| K / Kellanova | 0,00 | 0,00 | 0,23 | -3,83 | 0,1697 | -0,0149 | |||
| MRK / Merck & Co., Inc. | 0,00 | -12,09 | 0,22 | -22,49 | 0,1680 | -0,0593 | |||
| SPGI / S&P Global Inc. | 0,00 | 0,00 | 0,22 | 4,19 | 0,1677 | -0,0018 | |||
| T / AT&T Inc. | 0,01 | 0,00 | 0,22 | 2,34 | 0,1646 | -0,0041 | |||
| CEG / Constellation Energy Corporation | 0,00 | 0,22 | 0,1633 | 0,1633 | |||||
| C / Citigroup Inc. | 0,00 | 0,22 | 0,1625 | 0,1625 | |||||
| VO / Vanguard Index Funds - Vanguard Mid-Cap ETF | 0,00 | -10,61 | 0,22 | -3,57 | 0,1623 | -0,0136 | |||
| DGX / Quest Diagnostics Incorporated | 0,00 | 0,00 | 0,22 | 5,91 | 0,1613 | 0,0020 | |||
| BA / The Boeing Company | 0,00 | 0,21 | 0,1575 | 0,1575 | |||||
| PGF / Invesco Exchange-Traded Fund Trust - Invesco Financial Preferred ETF | 0,01 | 0,00 | 0,18 | -1,12 | 0,1331 | -0,0082 | |||
| MCR / MFS Charter Income Trust | 0,02 | 0,00 | 0,15 | 1,34 | 0,1135 | -0,0038 | |||
| AGNC / AGNC Investment Corp. | 0,01 | 0,00 | 0,11 | -4,20 | 0,0855 | -0,0080 | |||
| JPC / Nuveen Preferred & Income Opportunities Fund | 0,01 | 0,00 | 0,11 | 0,93 | 0,0810 | -0,0033 | |||
| GUT / The Gabelli Utility Trust | 0,02 | 0,10 | 0,0738 | 0,0738 | |||||
| UNH / UnitedHealth Group Incorporated | 0,00 | -100,00 | 0,00 | 0,0000 |