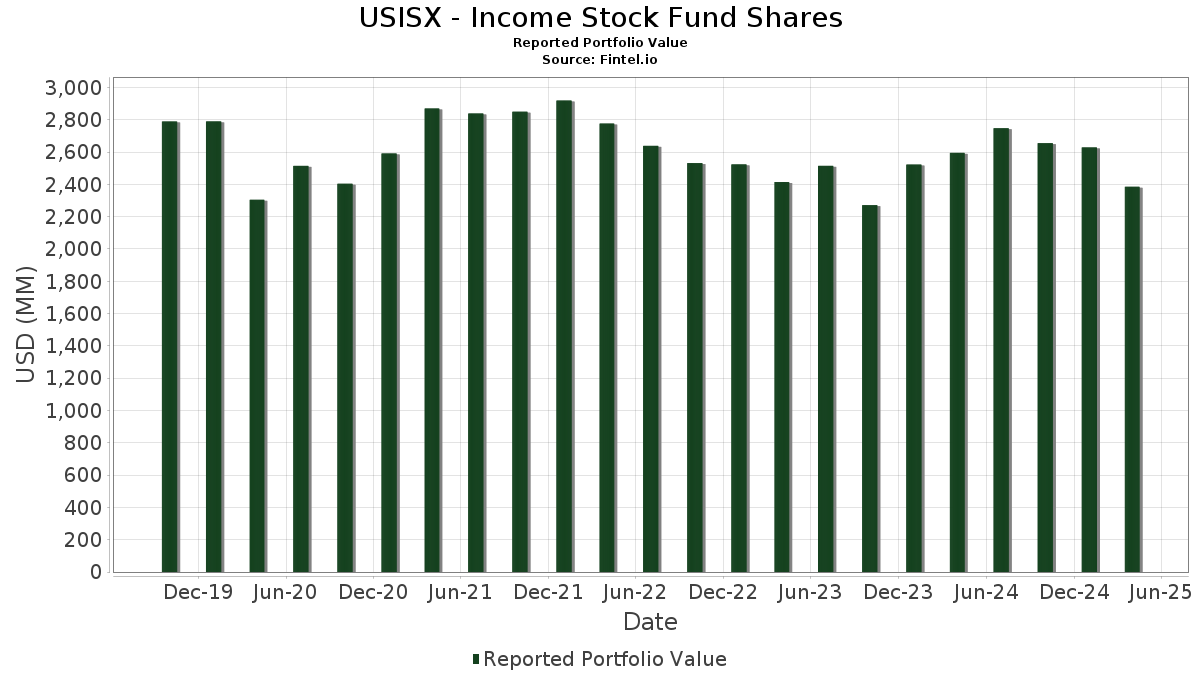
Statistiques de base
| Valeur du portefeuille | $ 2 384 877 470 |
| Positions actuelles | 149 |
Dernières positions, performances, ASG (à partir des dépôts 13F, 13D)
USISX - Income Stock Fund Shares a déclaré un total de 149 positions dans ses derniers dépôts auprès de la SEC. La valeur la plus récente du portefeuille est calculée à 2 384 877 470 USD. Les actifs sous gestion réels (ASG) sont cette valeur plus les liquidités (qui ne sont pas divulguées). Les principales positions de USISX - Income Stock Fund Shares sont JPMorgan Chase & Co. (US:JPM) , Johnson & Johnson (US:JNJ) , Gilead Sciences, Inc. (US:GILD) , Altria Group, Inc. (US:MO) , and AbbVie Inc. (US:ABBV) . Les nouvelles positions de USISX - Income Stock Fund Shares incluent Electronic Arts Inc. (US:EA) , Equitable Holdings, Inc. (US:EQH) , Leidos Holdings, Inc. (US:LDOS) , Broadridge Financial Solutions, Inc. (US:BR) , and Comfort Systems USA, Inc. (US:FIX) .
Meilleures augmentations ce trimestre
Nous utilisons la variation de l'allocation du portefeuille car il s'agit de l'indicateur le plus significatif. Les changements peuvent être dus à des transactions ou à des variations de prix des actions.
| Titre | Actions (en millions) |
Valeur ($ en millions) |
% du portefeuille | ΔPortefeuille % |
|---|---|---|---|---|
| 0,44 | 68,39 | 2,8553 | 1,4247 | |
| 0,70 | 30,77 | 1,2846 | 1,2846 | |
| 0,31 | 40,32 | 1,6834 | 0,6251 | |
| 0,15 | 44,35 | 1,8515 | 0,5772 | |
| 0,09 | 19,56 | 0,8166 | 0,5767 | |
| 0,35 | 24,89 | 1,0393 | 0,5383 | |
| 0,97 | 57,37 | 2,3955 | 0,5266 | |
| 0,17 | 34,18 | 1,4271 | 0,4173 | |
| 0,25 | 40,54 | 1,6926 | 0,3964 | |
| 0,43 | 36,40 | 1,5199 | 0,3717 |
Principales baisses ce trimestre
Nous utilisons la variation de l'allocation du portefeuille car il s'agit de l'indicateur le plus significatif. Les changements peuvent être dus à des transactions ou à des variations de prix des actions.
| Titre | Actions (en millions) |
Valeur ($ en millions) |
% du portefeuille | ΔPortefeuille % |
|---|---|---|---|---|
| 0,07 | 6,90 | 0,2882 | -1,4105 | |
| 0,00 | 0,00 | -1,0499 | ||
| 0,00 | 0,00 | -0,5598 | ||
| 0,23 | 34,79 | 1,4525 | -0,5461 | |
| 0,11 | 9,87 | 0,4121 | -0,5198 | |
| 0,07 | 4,76 | 0,1987 | -0,5187 | |
| 0,11 | 4,81 | 0,2009 | -0,4860 | |
| 0,02 | 1,46 | 0,0611 | -0,4509 | |
| 0,00 | 0,00 | -0,4032 | ||
| 0,16 | 18,93 | 0,7903 | -0,3915 |
Déclarations 13F et dépôts de fonds
Ce formulaire a été déposé le 2025-06-26 pour la période de déclaration 2025-04-30. Cliquez sur l'icône du lien pour voir l'historique complet des transactions.
Mettre à niveau pour débloquer les données premium et exporter vers Excel ![]() .
.
| Titre | Type | Prix moyen de l'action | Actions (en millions) |
ΔActions (%) |
ΔActions (%) |
Valeur ($ en millions) |
Portefeuille (%) |
ΔPortefeuille (%) |
|
|---|---|---|---|---|---|---|---|---|---|
| JPM / JPMorgan Chase & Co. | 0,43 | 0,00 | 106,24 | -8,49 | 4,4356 | 0,0344 | |||
| JNJ / Johnson & Johnson | 0,44 | 76,41 | 68,39 | 81,23 | 2,8553 | 1,4247 | |||
| GILD / Gilead Sciences, Inc. | 0,59 | -8,29 | 63,30 | 0,52 | 2,6428 | 0,2554 | |||
| MO / Altria Group, Inc. | 0,97 | 2,78 | 57,37 | 16,39 | 2,3955 | 0,5266 | |||
| ABBV / AbbVie Inc. | 0,27 | 0,00 | 53,14 | 6,09 | 2,2189 | 0,3197 | |||
| BMY / Bristol-Myers Squibb Company | 1,05 | 0,00 | 52,72 | -14,84 | 2,2010 | -0,1460 | |||
| PM / Philip Morris International Inc. | 0,26 | -35,71 | 45,23 | -15,39 | 1,8883 | -0,1382 | |||
| ADP / Automatic Data Processing, Inc. | 0,15 | 33,00 | 44,35 | 31,94 | 1,8515 | 0,5772 | |||
| EOG / EOG Resources, Inc. | 0,40 | 13,73 | 43,86 | -0,24 | 1,8312 | 0,1643 | |||
| LMT / Lockheed Martin Corporation | 0,09 | 0,00 | 43,37 | 3,20 | 1,8106 | 0,2174 | |||
| PG / The Procter & Gamble Company | 0,25 | 21,07 | 40,54 | 18,58 | 1,6926 | 0,3964 | |||
| CSCO / Cisco Systems, Inc. | 0,70 | 0,00 | 40,45 | -4,74 | 1,6889 | 0,0790 | |||
| KMB / Kimberly-Clark Corporation | 0,31 | 42,45 | 40,32 | 44,44 | 1,6834 | 0,6251 | |||
| GS / The Goldman Sachs Group, Inc. | 0,07 | -5,45 | 39,86 | -19,16 | 1,6644 | -0,2052 | |||
| MRK / Merck & Co., Inc. | 0,43 | 39,42 | 36,40 | 20,20 | 1,5199 | 0,3717 | |||
| OTIS / Otis Worldwide Corporation | 0,36 | 11,21 | 34,95 | 12,20 | 1,4594 | 0,2783 | |||
| QCOM / QUALCOMM Incorporated | 0,23 | -23,13 | 34,79 | -34,01 | 1,4525 | -0,5461 | |||
| HD / The Home Depot, Inc. | 0,10 | 13,80 | 34,47 | -0,42 | 1,4394 | 0,1268 | |||
| ALL / The Allstate Corporation | 0,17 | 24,41 | 34,18 | 28,33 | 1,4271 | 0,4173 | |||
| LOW / Lowe's Companies, Inc. | 0,14 | 2,68 | 31,68 | -11,72 | 1,3227 | -0,0379 | |||
| VZ / Verizon Communications Inc. | 0,70 | 30,77 | 1,2846 | 1,2846 | |||||
| CL / Colgate-Palmolive Company | 0,33 | 3,07 | 30,60 | 9,60 | 1,2777 | 0,2191 | |||
| VLO / Valero Energy Corporation | 0,26 | -15,01 | 29,77 | -25,82 | 1,2428 | -0,2785 | |||
| SYY / Sysco Corporation | 0,35 | 92,37 | 24,89 | 88,36 | 1,0393 | 0,5383 | |||
| CMCSA / Comcast Corporation | 0,72 | 0,00 | 24,79 | 1,61 | 1,0350 | 0,1100 | |||
| TJX / The TJX Companies, Inc. | 0,18 | 0,00 | 23,78 | 3,11 | 0,9928 | 0,1185 | |||
| BK / The Bank of New York Mellon Corporation | 0,30 | -15,71 | 23,72 | -21,13 | 0,9905 | -0,1498 | |||
| PFE / Pfizer Inc. | 0,95 | 6,63 | 23,13 | -1,86 | 0,9656 | 0,0722 | |||
| MS / Morgan Stanley | 0,20 | -22,42 | 22,59 | -35,32 | 0,9430 | -0,3809 | |||
| CAH / Cardinal Health, Inc. | 0,16 | -15,17 | 22,13 | -3,07 | 0,9239 | 0,0583 | |||
| SO / The Southern Company | 0,24 | -17,55 | 21,95 | 3,08 | 0,9164 | 0,0967 | |||
| PNC / The PNC Financial Services Group, Inc. | 0,13 | 0,00 | 21,48 | -20,03 | 0,8968 | -0,1216 | |||
| CMI / Cummins Inc. | 0,07 | 0,00 | 21,03 | -17,52 | 0,8782 | -0,0886 | |||
| MPC / Marathon Petroleum Corporation | 0,15 | -15,72 | 20,53 | -20,52 | 0,8570 | -0,1221 | |||
| MMM / 3M Company | 0,14 | -7,73 | 20,06 | -15,79 | 0,8377 | -0,0656 | |||
| FDX / FedEx Corporation | 0,09 | 289,24 | 19,56 | 209,12 | 0,8166 | 0,5767 | |||
| CVX / Chevron Corporation | 0,14 | 0,00 | 19,14 | -8,80 | 0,7993 | 0,0034 | |||
| DUK / Duke Energy Corporation | 0,16 | -43,18 | 18,93 | -39,86 | 0,7903 | -0,3915 | |||
| CI / The Cigna Group | 0,06 | 31,74 | 18,77 | 52,27 | 0,7837 | 0,3163 | |||
| EIX / Edison International | 0,35 | 16,59 | 18,54 | 15,53 | 0,7742 | 0,1657 | |||
| SYF / Synchrony Financial | 0,34 | 79,89 | 17,77 | 35,48 | 0,7421 | 0,2447 | |||
| AXP / American Express Company | 0,07 | 0,00 | 17,40 | -16,08 | 0,7267 | -0,0596 | |||
| UNH / UnitedHealth Group Incorporated | 0,04 | 26,98 | 17,28 | 2,09 | 0,7215 | 0,0527 | |||
| DVN / Devon Energy Corporation | 0,57 | -7,63 | 17,25 | -17,63 | 0,7204 | -0,0738 | |||
| NTAP / NetApp, Inc. | 0,19 | -7,21 | 16,63 | -31,80 | 0,6944 | -0,2301 | |||
| COG / Cabot Oil & Gas Corp. | 0,65 | 62,21 | 15,98 | 43,72 | 0,6674 | 0,2457 | |||
| TT / Trane Technologies plc | 0,04 | 10,10 | 15,88 | 16,34 | 0,6631 | 0,1455 | |||
| AMP / Ameriprise Financial, Inc. | 0,03 | 0,00 | 15,33 | -13,31 | 0,6399 | -0,0304 | |||
| CSL / Carlisle Companies Incorporated | 0,04 | 19,56 | 15,31 | 16,49 | 0,6391 | 0,1409 | |||
| FNF / Fidelity National Financial, Inc. | 0,24 | -10,54 | 15,12 | -1,49 | 0,6313 | 0,0494 | |||
| NRG / NRG Energy, Inc. | 0,14 | 0,00 | 15,09 | 6,97 | 0,6300 | 0,0952 | |||
| PKG / Packaging Corporation of America | 0,08 | -7,87 | 14,99 | -19,59 | 0,6260 | -0,0809 | |||
| WRB / W. R. Berkley Corporation | 0,21 | 83,46 | 14,95 | 123,57 | 0,6241 | 0,3706 | |||
| EG / Everest Group, Ltd. | 0,04 | -9,47 | 14,06 | -6,53 | 0,5869 | 0,0168 | |||
| RS / Reliance, Inc. | 0,05 | 0,00 | 14,00 | -0,44 | 0,5846 | 0,0514 | |||
| CLX / The Clorox Company | 0,10 | 0,00 | 13,87 | -10,32 | 0,5789 | -0,0073 | |||
| MSI / Motorola Solutions, Inc. | 0,03 | 7,53 | 13,84 | 0,91 | 0,5778 | 0,0579 | |||
| HPE / Hewlett Packard Enterprise Company | 0,85 | 13,00 | 13,83 | -13,50 | 0,5774 | -0,0288 | |||
| LYB / LyondellBasell Industries N.V. | 0,24 | -3,70 | 13,81 | -25,95 | 0,5764 | -0,1304 | |||
| NOC / Northrop Grumman Corporation | 0,03 | -2,08 | 13,75 | -2,23 | 0,5739 | 0,0409 | |||
| PLD / Prologis, Inc. | 0,13 | 0,00 | 13,72 | -14,30 | 0,5727 | -0,0341 | |||
| DGX / Quest Diagnostics Incorporated | 0,08 | 101,24 | 13,43 | 119,92 | 0,5606 | 0,3291 | |||
| CVS / CVS Health Corporation | 0,20 | -17,53 | 13,27 | -2,60 | 0,5541 | 0,0375 | |||
| RPRX / Royalty Pharma plc | 0,40 | -4,20 | 13,03 | -0,44 | 0,5442 | 0,0479 | |||
| CAT / Caterpillar Inc. | 0,04 | -4,35 | 12,91 | -20,36 | 0,5392 | -0,0756 | |||
| PEP / PepsiCo, Inc. | 0,10 | 26,43 | 12,90 | 13,75 | 0,5388 | 0,1087 | |||
| EXPD / Expeditors International of Washington, Inc. | 0,12 | 0,00 | 12,75 | -3,23 | 0,5324 | 0,0328 | |||
| MDT / Medtronic plc | 0,15 | -38,93 | 12,67 | -43,00 | 0,5292 | -0,3138 | |||
| ACN / Accenture plc | 0,04 | -23,94 | 12,45 | -40,90 | 0,5197 | -0,2788 | |||
| CF / CF Industries Holdings, Inc. | 0,16 | -11,04 | 12,38 | -24,39 | 0,5170 | -0,1039 | |||
| CTSH / Cognizant Technology Solutions Corporation | 0,16 | 0,00 | 12,11 | -10,94 | 0,5058 | -0,0099 | |||
| AVB / AvalonBay Communities, Inc. | 0,06 | 0,00 | 11,97 | -5,20 | 0,4998 | 0,0210 | |||
| SWKS / Skyworks Solutions, Inc. | 0,19 | 49,85 | 11,92 | 8,52 | 0,4978 | 0,0813 | |||
| MAS / Masco Corporation | 0,20 | -10,25 | 11,89 | -31,39 | 0,4963 | -0,1605 | |||
| LRCX / Lam Research Corporation | 0,17 | 0,00 | 11,88 | -11,57 | 0,4959 | -0,0133 | |||
| DOC / Healthpeak Properties, Inc. | 0,66 | -2,93 | 11,81 | -16,19 | 0,4930 | -0,0411 | |||
| ELV / Elevance Health, Inc. | 0,03 | 5,46 | 11,36 | 12,09 | 0,4745 | 0,0901 | |||
| EVRG / Evergy, Inc. | 0,16 | 93,08 | 11,17 | 107,93 | 0,4662 | 0,2626 | |||
| EWBC / East West Bancorp, Inc. | 0,13 | 37,20 | 11,10 | 13,98 | 0,4637 | 0,0943 | |||
| VICI / VICI Properties Inc. | 0,34 | 0,00 | 11,03 | 7,56 | 0,4605 | 0,0717 | |||
| CCI / Crown Castle Inc. | 0,10 | 0,00 | 10,97 | 18,46 | 0,4581 | 0,1069 | |||
| ADM / Archer-Daniels-Midland Company | 0,23 | -24,07 | 10,84 | -29,23 | 0,4526 | -0,1282 | |||
| PEG / Public Service Enterprise Group Incorporated | 0,13 | 13,98 | 10,75 | 9,06 | 0,4488 | 0,0751 | |||
| AMAT / Applied Materials, Inc. | 0,07 | -13,21 | 10,50 | -27,47 | 0,4383 | -0,1105 | |||
| KLAC / KLA Corporation | 0,01 | -8,64 | 10,41 | -13,04 | 0,4346 | -0,0192 | |||
| FHN / First Horizon Corporation | 0,57 | 63,76 | 10,26 | 35,26 | 0,4285 | 0,1408 | |||
| CINF / Cincinnati Financial Corporation | 0,07 | 0,00 | 10,23 | 1,58 | 0,4270 | 0,0453 | |||
| MCK / McKesson Corporation | 0,01 | -58,43 | 10,12 | -40,73 | 0,4226 | -0,2522 | |||
| STT / State Street Corporation | 0,11 | -53,68 | 9,87 | -59,84 | 0,4121 | -0,5198 | |||
| OGE / OGE Energy Corp. | 0,21 | 0,00 | 9,63 | 7,46 | 0,4023 | 0,0623 | |||
| KIM / Kimco Realty Corporation | 0,47 | 0,00 | 9,41 | -11,00 | 0,3929 | -0,0080 | |||
| UNM / Unum Group | 0,12 | 76,61 | 9,30 | 79,88 | 0,3883 | 0,1923 | |||
| EQIX / Equinix, Inc. | 0,01 | 0,00 | 9,17 | -5,79 | 0,3829 | 0,0138 | |||
| STLD / Steel Dynamics, Inc. | 0,07 | -11,74 | 9,13 | -10,70 | 0,3810 | -0,0064 | |||
| SPG / Simon Property Group, Inc. | 0,06 | 0,00 | 9,04 | -9,48 | 0,3776 | -0,0012 | |||
| HPQ / HP Inc. | 0,35 | 325,59 | 9,00 | 234,83 | 0,3757 | 0,2738 | |||
| OVV / Ovintiv Inc. | 0,26 | 0,00 | 8,90 | -20,46 | 0,3715 | -0,0526 | |||
| OC / Owens Corning | 0,06 | 82,94 | 8,72 | 44,13 | 0,3642 | 0,1348 | |||
| CFG / Citizens Financial Group, Inc. | 0,23 | 7,44 | 8,48 | -16,69 | 0,3540 | -0,0318 | |||
| CRH / CRH plc | 0,09 | 0,00 | 8,19 | -3,65 | 0,3421 | 0,0197 | |||
| EVR / Evercore Inc. | 0,04 | 0,00 | 8,14 | -29,52 | 0,3398 | -0,0980 | |||
| CUBE / CubeSmart | 0,20 | 0,00 | 8,06 | -2,47 | 0,3364 | 0,0232 | |||
| BBY / Best Buy Co., Inc. | 0,11 | 0,00 | 7,47 | -22,33 | 0,3120 | -0,0528 | |||
| EXR / Extra Space Storage Inc. | 0,05 | 0,00 | 7,33 | -4,87 | 0,3062 | 0,0140 | |||
| EA / Electronic Arts Inc. | 0,05 | 7,33 | 0,3059 | 0,3059 | |||||
| OZK / Bank OZK | 0,17 | -2,54 | 7,26 | -18,25 | 0,3029 | -0,0336 | |||
| GWW / W.W. Grainger, Inc. | 0,01 | 6,02 | 7,21 | 2,20 | 0,3011 | 0,0336 | |||
| GRMN / Garmin Ltd. | 0,04 | 0,00 | 7,17 | -13,43 | 0,2993 | -0,0146 | |||
| SSNC / SS&C Technologies Holdings, Inc. | 0,09 | 0,00 | 7,08 | -6,62 | 0,2957 | 0,0082 | |||
| UPS / United Parcel Service, Inc. | 0,07 | -81,53 | 6,90 | -84,59 | 0,2882 | -1,4105 | |||
| HST / Host Hotels & Resorts, Inc. | 0,49 | 0,00 | 6,87 | -15,49 | 0,2868 | -0,0214 | |||
| EQH / Equitable Holdings, Inc. | 0,14 | 6,77 | 0,2828 | 0,2828 | |||||
| AFG / American Financial Group, Inc. | 0,05 | 0,00 | 6,50 | -7,25 | 0,2714 | 0,0057 | |||
| LEN / Lennar Corporation | 0,06 | 46,98 | 6,42 | 21,63 | 0,2681 | 0,0680 | |||
| PHM / PulteGroup, Inc. | 0,06 | 0,00 | 6,05 | -9,84 | 0,2526 | -0,0018 | |||
| IBKR / Interactive Brokers Group, Inc. | 0,04 | 0,00 | 6,03 | -20,96 | 0,2519 | -0,0375 | |||
| LDOS / Leidos Holdings, Inc. | 0,04 | 5,92 | 0,2470 | 0,2470 | |||||
| NTRS / Northern Trust Corporation | 0,06 | 0,00 | 5,69 | -16,30 | 0,2375 | -0,0202 | |||
| ARE / Alexandria Real Estate Equities, Inc. | 0,08 | 0,00 | 5,68 | -25,36 | 0,2370 | -0,0513 | |||
| DHI / D.R. Horton, Inc. | 0,04 | 27,38 | 5,47 | 13,41 | 0,2282 | 0,0455 | |||
| PCAR / PACCAR Inc | 0,06 | -58,26 | 5,45 | -61,84 | 0,2277 | -0,2910 | |||
| PFG / Principal Financial Group, Inc. | 0,07 | -36,97 | 5,37 | -41,48 | 0,2242 | -0,1394 | |||
| JHG / Janus Henderson Group plc | 0,16 | 0,00 | 5,37 | -26,09 | 0,2242 | -0,0512 | |||
| TXRH / Texas Roadhouse, Inc. | 0,03 | 0,00 | 5,35 | -8,35 | 0,2235 | 0,0020 | |||
| CHRW / C.H. Robinson Worldwide, Inc. | 0,05 | 4,84 | 0,2023 | 0,2023 | |||||
| GLW / Corning Incorporated | 0,11 | -68,84 | 4,81 | -73,45 | 0,2009 | -0,4860 | |||
| BR / Broadridge Financial Solutions, Inc. | 0,02 | 4,80 | 0,2004 | 0,2004 | |||||
| KR / The Kroger Co. | 0,07 | -78,53 | 4,76 | -74,85 | 0,1987 | -0,5187 | |||
| FIX / Comfort Systems USA, Inc. | 0,01 | 4,69 | 0,1959 | 0,1959 | |||||
| TGT / Target Corporation | 0,05 | 0,00 | 4,66 | -29,89 | 0,1945 | -0,0574 | |||
| HUM / Humana Inc. | 0,02 | -33,55 | 4,22 | -40,58 | 0,1760 | -0,0929 | |||
| NYT / The New York Times Company | 0,08 | 4,19 | 0,1748 | 0,1748 | |||||
| ZION / Zions Bancorporation, National Association | 0,09 | 0,00 | 3,95 | -22,28 | 0,1649 | -0,0278 | |||
| PNR / Pentair plc | 0,04 | 0,00 | 3,92 | -12,49 | 0,1636 | -0,0062 | |||
| RPM / RPM International Inc. | 0,03 | -3,04 | 3,39 | -18,57 | 0,1417 | -0,0148 | |||
| BXP / Boston Properties, Inc. | 0,05 | -16,74 | 3,23 | -27,45 | 0,1350 | -0,0340 | |||
| AXS / AXIS Capital Holdings Limited | 0,03 | 3,18 | 0,1328 | 0,1328 | |||||
| INGR / Ingredion Incorporated | 0,02 | -73,85 | 3,08 | -63,33 | 0,1287 | -0,1622 | |||
| WH / Wyndham Hotels & Resorts, Inc. | 0,04 | 3,00 | 0,1254 | 0,1254 | |||||
| FLS / Flowserve Corporation | 0,06 | 0,00 | 2,90 | -27,78 | 0,1209 | -0,0311 | |||
| ALSN / Allison Transmission Holdings, Inc. | 0,03 | 0,00 | 2,49 | -21,54 | 0,1040 | -0,0163 | |||
| FITB / Fifth Third Bancorp | 0,07 | -73,40 | 2,41 | -78,43 | 0,1007 | -0,3232 | |||
| LPX / Louisiana-Pacific Corporation | 0,03 | 2,31 | 0,0966 | 0,0966 | |||||
| ETR / Entergy Corporation | 0,03 | 0,00 | 2,19 | 2,57 | 0,0916 | 0,0105 | |||
| OLN / Olin Corporation | 0,10 | 0,00 | 2,16 | -26,20 | 0,0904 | -0,0208 | |||
| TROW / T. Rowe Price Group, Inc. | 0,02 | 0,00 | 2,02 | -24,30 | 0,0842 | -0,0168 | |||
| TOL / Toll Brothers, Inc. | 0,02 | 0,00 | 2,01 | -25,71 | 0,0841 | -0,0187 | |||
| OMC / Omnicom Group Inc. | 0,02 | -87,65 | 1,46 | -89,16 | 0,0611 | -0,4509 | |||
| UGI / UGI Corporation | 0,02 | -82,06 | 0,70 | -80,87 | 0,0292 | -0,1094 | |||
| TAP / Molson Coors Beverage Company | 0,00 | -100,00 | 0,00 | -100,00 | -0,2451 | ||||
| MPWR / Monolithic Power Systems, Inc. | 0,00 | -100,00 | 0,00 | -100,00 | -0,4032 | ||||
| HAS / Hasbro, Inc. | 0,00 | -100,00 | 0,00 | -100,00 | -0,1599 | ||||
| TTEK / Tetra Tech, Inc. | 0,00 | -100,00 | 0,00 | -100,00 | -0,1034 | ||||
| AVGO / Broadcom Inc. | 0,00 | -100,00 | 0,00 | -100,00 | -0,5598 | ||||
| LHX / L3Harris Technologies, Inc. | 0,00 | -100,00 | 0,00 | -100,00 | -1,0499 |