Statistiques de base
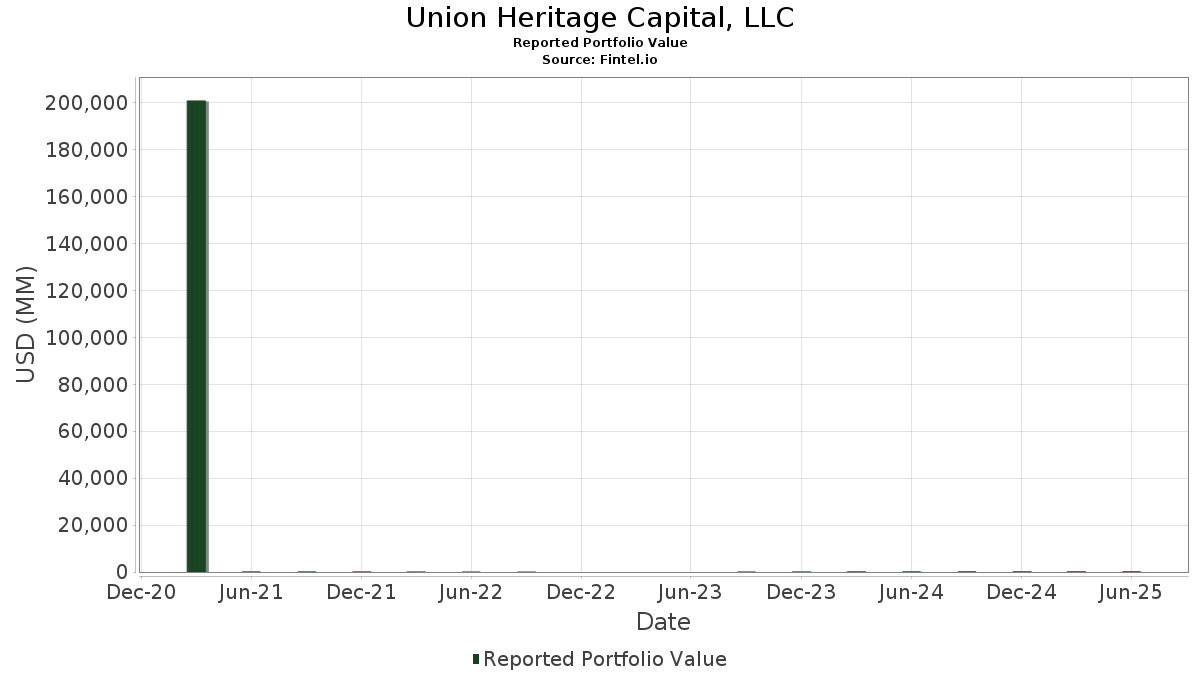
| Valeur du portefeuille | $ 287 069 528 |
| Positions actuelles | 64 |
Dernières positions, performances, ASG (à partir des dépôts 13F, 13D)
Union Heritage Capital, LLC a déclaré un total de 64 positions dans ses derniers dépôts auprès de la SEC. La valeur la plus récente du portefeuille est calculée à 287 069 528 USD. Les actifs sous gestion réels (ASG) sont cette valeur plus les liquidités (qui ne sont pas divulguées). Les principales positions de Union Heritage Capital, LLC sont Microsoft Corporation (US:MSFT) , Apple Inc. (US:AAPL) , Oracle Corporation (US:ORCL) , Amphenol Corporation (US:APH) , and Copart, Inc. (US:CPRT) .
Meilleures augmentations ce trimestre
Nous utilisons la variation de l'allocation du portefeuille car il s'agit de l'indicateur le plus significatif. Les changements peuvent être dus à des transactions ou à des variations de prix des actions.
| Titre | Actions (en millions) |
Valeur ($ en millions) |
% du portefeuille | ΔPortefeuille % |
|---|---|---|---|---|
| 0,07 | 16,37 | 5,7033 | 1,8056 | |
| 0,16 | 15,89 | 5,5345 | 1,6059 | |
| 0,04 | 20,24 | 7,0515 | 1,3642 | |
| 0,07 | 10,39 | 3,6180 | 0,9656 | |
| 0,01 | 3,14 | 1,0947 | 0,3841 | |
| 0,03 | 8,76 | 3,0504 | 0,2920 | |
| 0,05 | 10,68 | 3,7191 | 0,2722 | |
| 0,03 | 4,62 | 1,6101 | 0,1849 | |
| 0,07 | 6,17 | 2,1505 | 0,1650 | |
| 0,00 | 3,32 | 1,1571 | 0,1432 |
Principales baisses ce trimestre
Nous utilisons la variation de l'allocation du portefeuille car il s'agit de l'indicateur le plus significatif. Les changements peuvent être dus à des transactions ou à des variations de prix des actions.
| Titre | Actions (en millions) |
Valeur ($ en millions) |
% du portefeuille | ΔPortefeuille % |
|---|---|---|---|---|
| 0,08 | 17,08 | 5,9491 | -0,9343 | |
| 0,22 | 10,73 | 3,7380 | -0,8690 | |
| 0,01 | 2,96 | 1,0300 | -0,8180 | |
| 0,06 | 5,68 | 1,9800 | -0,4963 | |
| 0,01 | 10,23 | 3,5627 | -0,4713 | |
| 0,01 | 5,79 | 2,0164 | -0,3462 | |
| 0,02 | 4,32 | 1,5054 | -0,3106 | |
| 0,03 | 3,60 | 1,2552 | -0,2681 | |
| 0,06 | 5,77 | 2,0100 | -0,2662 | |
| 0,01 | 3,56 | 1,2387 | -0,2422 |
Déclarations 13F et dépôts de fonds
Ce formulaire a été déposé le 2025-08-13 pour la période de déclaration 2025-06-30. Cliquez sur l'icône du lien pour voir l'historique complet des transactions.
Mettre à niveau pour débloquer les données premium et exporter vers Excel ![]() .
.
| Titre | Type | Prix moyen de l'action | Actions (en millions) |
ΔActions (%) |
ΔActions (%) |
Valeur ($ en millions) |
Portefeuille (%) |
ΔPortefeuille (%) |
|
|---|---|---|---|---|---|---|---|---|---|
| MSFT / Microsoft Corporation | 0,04 | 0,00 | 20,24 | 32,51 | 7,0515 | 1,3642 | |||
| AAPL / Apple Inc. | 0,08 | 0,00 | 17,08 | -7,64 | 5,9491 | -0,9343 | |||
| ORCL / Oracle Corporation | 0,07 | 0,00 | 16,37 | 56,39 | 5,7033 | 1,8056 | |||
| APH / Amphenol Corporation | 0,16 | 0,00 | 15,89 | 50,56 | 5,5345 | 1,6059 | |||
| CPRT / Copart, Inc. | 0,22 | 0,00 | 10,73 | -13,29 | 3,7380 | -0,8690 | |||
| AMZN / Amazon.com, Inc. | 0,05 | 0,00 | 10,68 | 15,32 | 3,7191 | 0,2722 | |||
| NVDA / NVIDIA Corporation | 0,07 | 0,00 | 10,39 | 45,79 | 3,6180 | 0,9656 | |||
| MA / Mastercard Incorporated | 0,02 | 0,00 | 10,31 | 2,53 | 3,5899 | -0,1523 | |||
| LLY / Eli Lilly and Company | 0,01 | 0,00 | 10,23 | -5,61 | 3,5627 | -0,4713 | |||
| JPM / JPMorgan Chase & Co. | 0,03 | 0,00 | 8,76 | 18,18 | 3,0504 | 0,2920 | |||
| AME / AMETEK, Inc. | 0,04 | 0,00 | 7,48 | 5,13 | 2,6054 | -0,0433 | |||
| ROL / Rollins, Inc. | 0,13 | 0,00 | 7,38 | 4,43 | 2,5706 | -0,0602 | |||
| GGG / Graco Inc. | 0,07 | 0,00 | 6,25 | 2,93 | 2,1771 | -0,0830 | |||
| SEIC / SEI Investments Company | 0,07 | 0,00 | 6,17 | 15,75 | 2,1505 | 0,1650 | |||
| ACN / Accenture plc | 0,02 | 0,00 | 5,94 | -4,21 | 2,0701 | -0,2396 | |||
| BRK.B / Berkshire Hathaway Inc. | 0,01 | 0,00 | 5,79 | -8,79 | 2,0164 | -0,3462 | |||
| ORLY / O'Reilly Automotive, Inc. | 0,06 | 1 400,00 | 5,77 | -5,63 | 2,0100 | -0,2662 | |||
| COP / ConocoPhillips | 0,06 | 0,00 | 5,68 | -14,55 | 1,9800 | -0,4963 | |||
| SYK / Stryker Corporation | 0,01 | 0,00 | 5,14 | 6,28 | 1,7916 | -0,0099 | |||
| LMT / Lockheed Martin Corporation | 0,01 | 0,00 | 4,92 | 3,66 | 1,7148 | -0,0528 | |||
| MS / Morgan Stanley | 0,03 | 0,00 | 4,62 | 20,74 | 1,6101 | 0,1849 | |||
| ABBV / AbbVie Inc. | 0,02 | 0,00 | 4,32 | -11,40 | 1,5054 | -0,3106 | |||
| MKC / McCormick & Company, Incorporated | 0,06 | 0,00 | 4,18 | -7,88 | 1,4577 | -0,2335 | |||
| TTC / The Toro Company | 0,06 | 0,00 | 3,92 | -2,83 | 1,3656 | -0,1366 | |||
| EXPD / Expeditors International of Washington, Inc. | 0,03 | 0,00 | 3,80 | -4,97 | 1,3241 | -0,1653 | |||
| WFC / Wells Fargo & Company | 0,05 | 0,00 | 3,68 | 11,61 | 1,2830 | 0,0544 | |||
| PEP / PepsiCo, Inc. | 0,03 | 0,00 | 3,60 | -11,93 | 1,2552 | -0,2681 | |||
| AON / Aon plc | 0,01 | 0,00 | 3,56 | -10,61 | 1,2387 | -0,2422 | |||
| WMT / Walmart Inc. | 0,04 | 0,00 | 3,55 | 11,38 | 1,2379 | 0,0501 | |||
| SLGN / Silgan Holdings Inc. | 0,06 | 0,00 | 3,45 | 5,99 | 1,2027 | -0,0100 | |||
| NEU / NewMarket Corporation | 0,00 | 0,00 | 3,32 | 21,96 | 1,1571 | 0,1432 | |||
| AXP / American Express Company | 0,01 | 0,00 | 3,18 | 18,58 | 1,1076 | 0,1092 | |||
| AVGO / Broadcom Inc. | 0,01 | 0,00 | 3,14 | 64,68 | 1,0947 | 0,3841 | |||
| MMC / Marsh & McLennan Companies, Inc. | 0,01 | 0,00 | 3,07 | -10,43 | 1,0712 | -0,2065 | |||
| UNH / UnitedHealth Group Incorporated | 0,01 | 0,00 | 2,96 | -40,45 | 1,0300 | -0,8180 | |||
| CBRE / CBRE Group, Inc. | 0,02 | 0,00 | 2,82 | 7,15 | 0,9813 | 0,0025 | |||
| ABT / Abbott Laboratories | 0,02 | 0,00 | 2,65 | 2,55 | 0,9236 | -0,0391 | |||
| TJX / The TJX Companies, Inc. | 0,02 | 0,00 | 2,60 | 1,41 | 0,9051 | -0,0490 | |||
| NVO / Novo Nordisk A/S - Depositary Receipt (Common Stock) | 0,04 | 0,00 | 2,59 | -0,58 | 0,9023 | -0,0679 | |||
| DHR / Danaher Corporation | 0,01 | 0,00 | 2,38 | -3,65 | 0,8280 | -0,0903 | |||
| AMGN / Amgen Inc. | 0,01 | 0,00 | 2,35 | -10,39 | 0,8170 | -0,1573 | |||
| NKE / NIKE, Inc. | 0,03 | 0,00 | 2,32 | 11,91 | 0,8087 | 0,0364 | |||
| XOM / Exxon Mobil Corporation | 0,02 | 0,00 | 1,93 | -9,38 | 0,6733 | -0,1206 | |||
| META / Meta Platforms, Inc. | 0,00 | 0,00 | 1,89 | 28,07 | 0,6582 | 0,1089 | |||
| COST / Costco Wholesale Corporation | 0,00 | 0,00 | 1,78 | 4,64 | 0,6207 | -0,0131 | |||
| CTSH / Cognizant Technology Solutions Corporation | 0,02 | 0,00 | 1,77 | 2,02 | 0,6157 | -0,0294 | |||
| PKG / Packaging Corporation of America | 0,01 | 0,00 | 1,71 | -4,84 | 0,5955 | -0,0732 | |||
| JNJ / Johnson & Johnson | 0,01 | 0,00 | 1,68 | -7,89 | 0,5861 | -0,0939 | |||
| K / Kellanova | 0,02 | 0,00 | 1,67 | -3,58 | 0,5818 | -0,0631 | |||
| GPN / Global Payments Inc. | 0,02 | 0,00 | 1,62 | -18,26 | 0,5646 | -0,1736 | |||
| TSM / Taiwan Semiconductor Manufacturing Company Limited - Depositary Receipt (Common Stock) | 0,01 | 0,00 | 1,49 | 36,44 | 0,5207 | 0,1129 | |||
| GOOGL / Alphabet Inc. | 0,01 | 0,00 | 1,40 | 13,97 | 0,4862 | 0,0303 | |||
| KMB / Kimberly-Clark Corporation | 0,01 | 0,00 | 1,20 | -9,29 | 0,4184 | -0,0749 | |||
| BDX / Becton, Dickinson and Company | 0,01 | 0,00 | 1,06 | -24,77 | 0,3693 | -0,1555 | |||
| CNI / Canadian National Railway Company | 0,01 | 0,00 | 1,05 | 6,80 | 0,3670 | -0,0004 | |||
| TROW / T. Rowe Price Group, Inc. | 0,01 | 0,00 | 0,94 | 5,15 | 0,3271 | -0,0057 | |||
| PGR / The Progressive Corporation | 0,00 | 0,00 | 0,60 | -5,69 | 0,2080 | -0,0277 | |||
| PII / Polaris Inc. | 0,01 | 0,00 | 0,44 | -0,68 | 0,1520 | -0,0116 | |||
| VLTO / Veralto Corporation | 0,00 | 0,00 | 0,34 | 3,36 | 0,1181 | -0,0037 | |||
| SHW / The Sherwin-Williams Company | 0,00 | 0,00 | 0,33 | -1,77 | 0,1161 | -0,0101 | |||
| IBM / International Business Machines Corporation | 0,00 | 0,00 | 0,32 | 18,42 | 0,1099 | 0,0108 | |||
| ROST / Ross Stores, Inc. | 0,00 | 0,00 | 0,27 | 0,00 | 0,0932 | -0,0066 | |||
| GILD / Gilead Sciences, Inc. | 0,00 | 0,00 | 0,23 | -1,31 | 0,0791 | -0,0063 | |||
| KLG / WK Kellogg Co | 0,01 | 0,00 | 0,08 | -20,19 | 0,0292 | -0,0098 |