Statistiques de base
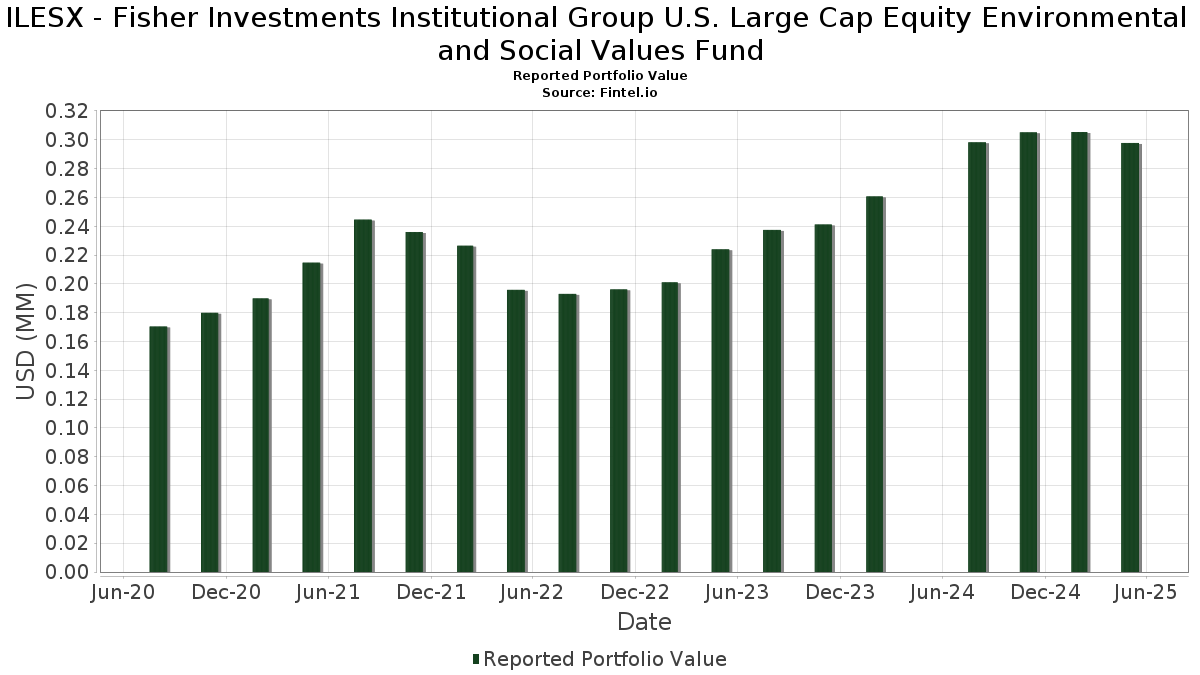
| Valeur du portefeuille | $ 297 789 |
| Positions actuelles | 64 |
Dernières positions, performances, ASG (à partir des dépôts 13F, 13D)
ILESX - Fisher Investments Institutional Group U.S. Large Cap Equity Environmental and Social Values Fund a déclaré un total de 64 positions dans ses derniers dépôts auprès de la SEC. La valeur la plus récente du portefeuille est calculée à 297 789 USD. Les actifs sous gestion réels (ASG) sont cette valeur plus les liquidités (qui ne sont pas divulguées). Les principales positions de ILESX - Fisher Investments Institutional Group U.S. Large Cap Equity Environmental and Social Values Fund sont NVIDIA Corporation (US:NVDA) , Microsoft Corporation (US:MSFT) , Apple Inc. (US:AAPL) , Amazon.com, Inc. (US:AMZN) , and Alphabet Inc. (US:GOOGL) . Les nouvelles positions de ILESX - Fisher Investments Institutional Group U.S. Large Cap Equity Environmental and Social Values Fund incluent Ralph Lauren Corporation (US:RL) , Jefferies Financial Group Inc. (US:JEF) , Flowserve Corporation (US:FLS) , Acuity Inc. (US:AYI) , and First American Funds Inc - First American Government Obligations Fund Class X (US:FGXXX) .
Meilleures augmentations ce trimestre
Nous utilisons la variation de l'allocation du portefeuille car il s'agit de l'indicateur le plus significatif. Les changements peuvent être dus à des transactions ou à des variations de prix des actions.
| Titre | Actions (en millions) |
Valeur ($ en millions) |
% du portefeuille | ΔPortefeuille % |
|---|---|---|---|---|
| 0,00 | 0,00 | 1,3954 | 1,3954 | |
| 0,00 | 0,02 | 7,5811 | 1,2734 | |
| 0,00 | 0,00 | 1,1107 | 1,1107 | |
| 0,00 | 0,00 | 0,7213 | 0,7213 | |
| 0,00 | 0,00 | 0,6987 | 0,6987 | |
| 0,00 | 0,01 | 1,6968 | 0,5794 | |
| 0,00 | 0,00 | 0,4822 | 0,4822 | |
| 0,00 | 0,02 | 7,8112 | 0,2770 | |
| 0,00 | 0,01 | 3,1168 | 0,2456 | |
| 0,00 | 0,01 | 2,4343 | 0,2086 |
Principales baisses ce trimestre
Nous utilisons la variation de l'allocation du portefeuille car il s'agit de l'indicateur le plus significatif. Les changements peuvent être dus à des transactions ou à des variations de prix des actions.
| Titre | Actions (en millions) |
Valeur ($ en millions) |
% du portefeuille | ΔPortefeuille % |
|---|---|---|---|---|
| 0,00 | 0,02 | 6,2776 | -1,0154 | |
| 0,00 | 0,01 | 1,7354 | -0,9513 | |
| 0,00 | 0,00 | 1,0008 | -0,5582 | |
| 0,00 | 0,00 | 1,0654 | -0,5329 | |
| 0,00 | 0,00 | 0,8091 | -0,3818 | |
| 0,00 | 0,00 | 1,0487 | -0,3114 | |
| 0,00 | 0,00 | 1,0846 | -0,2914 | |
| 0,00 | 0,00 | 1,2771 | -0,2871 | |
| 0,00 | 0,00 | 0,5073 | -0,2627 | |
| 0,00 | 0,00 | 1,4605 | -0,2518 |
Déclarations 13F et dépôts de fonds
Ce formulaire a été déposé le 2025-07-30 pour la période de déclaration 2025-05-31. Cliquez sur l'icône du lien pour voir l'historique complet des transactions.
Mettre à niveau pour débloquer les données premium et exporter vers Excel ![]() .
.
| Titre | Type | Prix moyen de l'action | Actions (en millions) |
ΔActions (%) |
ΔActions (%) |
Valeur ($ en millions) |
Portefeuille (%) |
ΔPortefeuille (%) |
|
|---|---|---|---|---|---|---|---|---|---|
| NVDA / NVIDIA Corporation | 0,00 | -7,53 | 0,02 | 0,00 | 7,8112 | 0,2770 | |||
| MSFT / Microsoft Corporation | 0,00 | 0,00 | 0,02 | 15,79 | 7,5811 | 1,2734 | |||
| AAPL / Apple Inc. | 0,00 | 0,00 | 0,02 | -18,18 | 6,2776 | -1,0154 | |||
| AMZN / Amazon.com, Inc. | 0,00 | 0,00 | 0,01 | -8,33 | 3,9961 | 0,0038 | |||
| GOOGL / Alphabet Inc. | 0,00 | 3,85 | 0,01 | 12,50 | 3,1168 | 0,2456 | |||
| HD / The Home Depot, Inc. | 0,00 | 4,55 | 0,01 | 0,00 | 2,8468 | 0,0175 | |||
| ISRG / Intuitive Surgical, Inc. | 0,00 | 0,00 | 0,01 | 0,00 | 2,7844 | -0,0033 | |||
| JPM / JPMorgan Chase & Co. | 0,00 | -6,45 | 0,01 | -12,50 | 2,5730 | -0,0873 | |||
| AXP / American Express Company | 0,00 | 0,00 | 0,01 | 0,00 | 2,4706 | 0,0308 | |||
| NFLX / Netflix, Inc. | 0,00 | -14,29 | 0,01 | 16,67 | 2,4343 | 0,2086 | |||
| GS / The Goldman Sachs Group, Inc. | 0,00 | 0,00 | 0,01 | 0,00 | 2,4216 | 0,0001 | |||
| V / Visa Inc. | 0,00 | 0,00 | 0,01 | 0,00 | 2,0864 | 0,0870 | |||
| BAC / Bank of America Corporation | 0,00 | 0,00 | 0,01 | 0,00 | 1,8984 | -0,0150 | |||
| CRM / Salesforce, Inc. | 0,00 | 5,00 | 0,01 | 0,00 | 1,8729 | -0,0587 | |||
| C / Citigroup Inc. | 0,00 | 0,00 | 0,01 | 0,00 | 1,7719 | -0,0428 | |||
| LLY / Eli Lilly and Company | 0,00 | -22,22 | 0,01 | -37,50 | 1,7354 | -0,9513 | |||
| ROK / Rockwell Automation, Inc. | 0,00 | 33,33 | 0,01 | 66,67 | 1,6968 | 0,5794 | |||
| BLK / BlackRock, Inc. | 0,00 | 0,00 | 0,00 | 0,00 | 1,6466 | 0,0613 | |||
| USB / U.S. Bancorp | 0,00 | 0,00 | 0,00 | 0,00 | 1,4650 | -0,0558 | |||
| MS / Morgan Stanley | 0,00 | 9,68 | 0,00 | 0,00 | 1,4629 | 0,1249 | |||
| JNJ / Johnson & Johnson | 0,00 | -12,50 | 0,00 | -20,00 | 1,4605 | -0,2518 | |||
| HEI / HEICO Corporation | 0,00 | 0,00 | 0,00 | 33,33 | 1,4098 | 0,2083 | |||
| RL / Ralph Lauren Corporation | 0,00 | 0,00 | 1,3954 | 1,3954 | |||||
| BKR / Baker Hughes Company | 0,00 | 0,00 | 0,00 | -25,00 | 1,3074 | -0,2108 | |||
| ETN / Eaton Corporation plc | 0,00 | 0,00 | 0,00 | 0,00 | 1,2913 | 0,1500 | |||
| CAT / Caterpillar Inc. | 0,00 | 0,00 | 0,00 | 0,00 | 1,2866 | 0,0598 | |||
| EMR / Emerson Electric Co. | 0,00 | 10,34 | 0,00 | 0,00 | 1,2839 | 0,1403 | |||
| EOG / EOG Resources, Inc. | 0,00 | -7,89 | 0,00 | -25,00 | 1,2771 | -0,2871 | |||
| ORCL / Oracle Corporation | 0,00 | 0,00 | 0,00 | 0,00 | 1,2239 | 0,0392 | |||
| NUE / Nucor Corporation | 0,00 | 0,00 | 0,00 | -25,00 | 1,1761 | -0,2503 | |||
| ADBE / Adobe Inc. | 0,00 | 0,00 | 0,00 | 0,00 | 1,1160 | -0,0216 | |||
| JEF / Jefferies Financial Group Inc. | 0,00 | 0,00 | 1,1107 | 1,1107 | |||||
| KBH / KB Home | 0,00 | 0,00 | 0,00 | 0,00 | 1,0921 | -0,1540 | |||
| BIIB / Biogen Inc. | 0,00 | 0,00 | 0,00 | 0,00 | 1,0905 | -0,0485 | |||
| MRK / Merck & Co., Inc. | 0,00 | -8,70 | 0,00 | -25,00 | 1,0846 | -0,2914 | |||
| PG / The Procter & Gamble Company | 0,00 | 0,00 | 0,00 | 0,00 | 1,0848 | 0,0138 | |||
| CMI / Cummins Inc. | 0,00 | 0,00 | 0,00 | 0,00 | 1,0804 | -0,1134 | |||
| NSC / Norfolk Southern Corporation | 0,00 | 0,00 | 0,00 | 0,00 | 1,0797 | 0,0437 | |||
| AMGN / Amgen Inc. | 0,00 | -31,25 | 0,00 | -25,00 | 1,0654 | -0,5329 | |||
| COST / Costco Wholesale Corporation | 0,00 | -25,00 | 0,00 | -25,00 | 1,0487 | -0,3114 | |||
| SLB / Schlumberger Limited | 0,00 | 9,41 | 0,00 | 0,00 | 1,0330 | -0,1153 | |||
| ABBV / AbbVie Inc. | 0,00 | -30,43 | 0,00 | -50,00 | 1,0008 | -0,5582 | |||
| ADSK / Autodesk, Inc. | 0,00 | 0,00 | 0,00 | 0,00 | 0,9952 | 0,1060 | |||
| ABT / Abbott Laboratories | 0,00 | -18,52 | 0,00 | -33,33 | 0,9876 | -0,2206 | |||
| QCOM / QUALCOMM Incorporated | 0,00 | 0,00 | 0,00 | -33,33 | 0,9760 | -0,0433 | |||
| AMD / Advanced Micro Devices, Inc. | 0,00 | 0,00 | 0,00 | 0,00 | 0,8559 | 0,1112 | |||
| TROW / T. Rowe Price Group, Inc. | 0,00 | 0,00 | 0,00 | 0,00 | 0,8492 | -0,0763 | |||
| OTIS / Otis Worldwide Corporation | 0,00 | 0,00 | 0,00 | 0,00 | 0,8332 | -0,0081 | |||
| MRVL / Marvell Technology, Inc. | 0,00 | 0,00 | 0,00 | -33,33 | 0,8091 | -0,3818 | |||
| PFE / Pfizer Inc. | 0,00 | -1,00 | 0,00 | 0,00 | 0,7815 | -0,0755 | |||
| FLS / Flowserve Corporation | 0,00 | 0,00 | 0,7213 | 0,7213 | |||||
| AYI / Acuity Inc. | 0,00 | 0,00 | 0,6987 | 0,6987 | |||||
| SCHW / The Charles Schwab Corporation | 0,00 | 0,00 | 0,00 | 0,00 | 0,6532 | 0,0858 | |||
| YUM / Yum! Brands, Inc. | 0,00 | 0,00 | 0,00 | -50,00 | 0,6289 | -0,0303 | |||
| HAL / Halliburton Company | 0,00 | 14,46 | 0,00 | -50,00 | 0,6255 | -0,0843 | |||
| FGXXX / First American Funds Inc - First American Government Obligations Fund Class X | 0,00 | 0,00 | 0,5460 | 0,0103 | |||||
| UPS / United Parcel Service, Inc. | 0,00 | 23,08 | 0,00 | 0,00 | 0,5245 | 0,0227 | |||
| KLAC / KLA Corporation | 0,00 | 0,00 | 0,00 | 0,00 | 0,5087 | 0,0490 | |||
| UNH / UnitedHealth Group Incorporated | 0,00 | 0,00 | 0,00 | -50,00 | 0,5073 | -0,2627 | |||
| DKS / DICK'S Sporting Goods, Inc. | 0,00 | 0,00 | 0,4822 | 0,4822 | |||||
| MDT / Medtronic plc | 0,00 | 0,00 | 0,00 | 0,00 | 0,4462 | -0,0312 | |||
| GIS / General Mills, Inc. | 0,00 | 0,00 | 0,00 | 0,00 | 0,4194 | -0,0327 | |||
| KMB / Kimberly-Clark Corporation | 0,00 | 0,00 | 0,00 | 0,2899 | 0,0136 | ||||
| VTRS / Viatris Inc. | 0,00 | 0,00 | 0,00 | 0,0030 | -0,0000 |