Statistiques de base
| Valeur du portefeuille | $ 209 562 |
| Positions actuelles | 57 |
Dernières positions, performances, ASG (à partir des dépôts 13F, 13D)
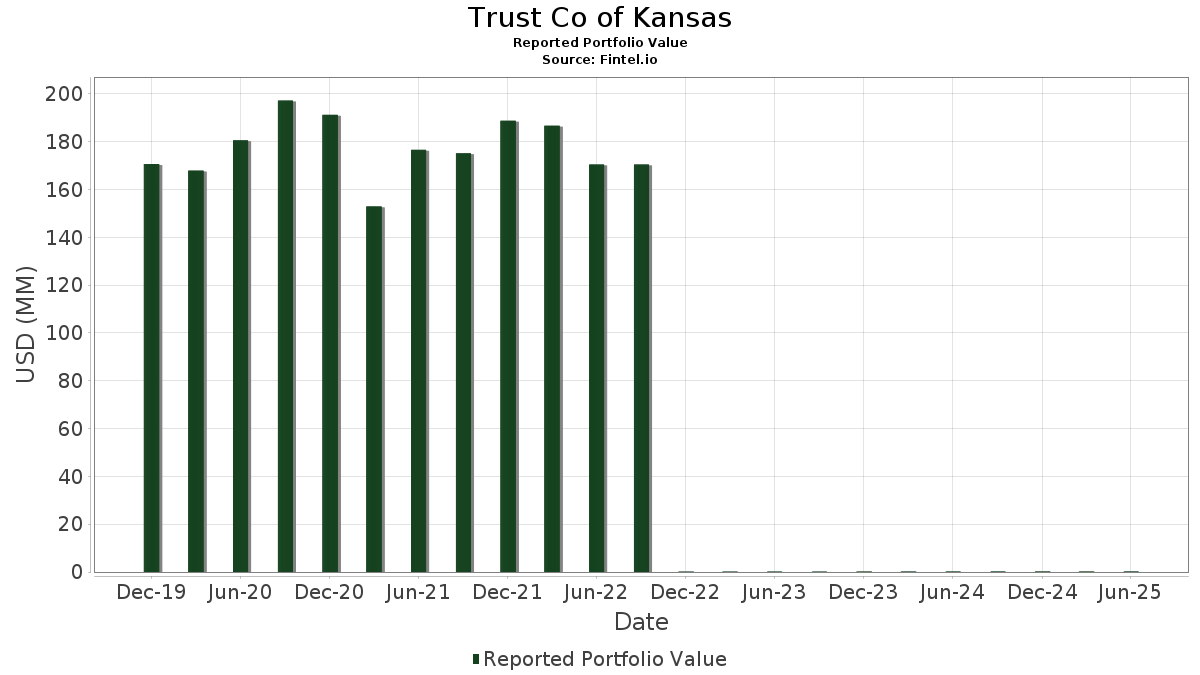
Trust Co of Kansas a déclaré un total de 57 positions dans ses derniers dépôts auprès de la SEC. La valeur la plus récente du portefeuille est calculée à 209 562 USD. Les actifs sous gestion réels (ASG) sont cette valeur plus les liquidités (qui ne sont pas divulguées). Les principales positions de Trust Co of Kansas sont T. Rowe Price Exchange-Traded Funds, Inc. - T. Rowe Price Blue Chip Growth ETF (US:TCHP) , Berkshire Hathaway Inc. (US:BRK.B) , Microsoft Corporation (US:MSFT) , Alphabet Inc. (US:GOOGL) , and Amazon.com, Inc. (US:AMZN) . Les nouvelles positions de Trust Co of Kansas incluent Palantir Technologies Inc. (US:PLTR) , .
Meilleures augmentations ce trimestre
Nous utilisons la variation de l'allocation du portefeuille car il s'agit de l'indicateur le plus significatif. Les changements peuvent être dus à des transactions ou à des variations de prix des actions.
| Titre | Actions (en millions) |
Valeur ($ en millions) |
% du portefeuille | ΔPortefeuille % |
|---|---|---|---|---|
| 0,94 | 0,04 | 20,2475 | 3,3351 | |
| 0,01 | 0,00 | 1,9288 | 1,9288 | |
| 0,01 | 0,01 | 2,9271 | 1,3455 | |
| 0,02 | 0,01 | 5,7234 | 1,0625 | |
| 0,03 | 0,01 | 3,3599 | 0,7961 | |
| 0,00 | 0,01 | 2,9337 | 0,4824 | |
| 0,05 | 0,01 | 4,1787 | 0,4559 | |
| 0,02 | 0,01 | 3,4448 | 0,4432 | |
| 0,06 | 0,01 | 3,6133 | 0,2446 | |
| 0,00 | 0,00 | 0,1427 | 0,1427 |
Principales baisses ce trimestre
Nous utilisons la variation de l'allocation du portefeuille car il s'agit de l'indicateur le plus significatif. Les changements peuvent être dus à des transactions ou à des variations de prix des actions.
| Titre | Actions (en millions) |
Valeur ($ en millions) |
% du portefeuille | ΔPortefeuille % |
|---|---|---|---|---|
| 0,03 | 0,01 | 5,8159 | -1,8215 | |
| 0,07 | 0,01 | 3,6958 | -0,8905 | |
| 0,04 | 0,01 | 3,9554 | -0,8760 | |
| 0,03 | 0,01 | 2,6532 | -0,6095 | |
| 0,04 | 0,00 | 1,6143 | -0,4471 | |
| 0,04 | 0,01 | 4,1076 | -0,4185 | |
| 0,19 | 0,00 | 2,1612 | -0,4090 | |
| 0,01 | 0,01 | 3,1322 | -0,3600 | |
| 0,02 | 0,01 | 3,1790 | -0,3521 | |
| 0,02 | 0,01 | 2,5926 | -0,2503 |
Déclarations 13F et dépôts de fonds
Ce formulaire a été déposé le 2025-07-21 pour la période de déclaration 2025-06-30. Cliquez sur l'icône du lien pour voir l'historique complet des transactions.
Mettre à niveau pour débloquer les données premium et exporter vers Excel ![]() .
.
| Titre | Type | Prix moyen de l'action | Actions (en millions) |
ΔActions (%) |
ΔActions (%) |
Valeur ($ en millions) |
Portefeuille (%) |
ΔPortefeuille (%) |
|
|---|---|---|---|---|---|---|---|---|---|
| TCHP / T. Rowe Price Exchange-Traded Funds, Inc. - T. Rowe Price Blue Chip Growth ETF | 0,94 | 12,25 | 0,04 | 35,48 | 20,2475 | 3,3351 | |||
| BRK.B / Berkshire Hathaway Inc. | 0,03 | -6,80 | 0,01 | -14,29 | 5,8159 | -1,8215 | |||
| MSFT / Microsoft Corporation | 0,02 | 3,44 | 0,01 | 37,50 | 5,7234 | 1,0625 | |||
| GOOGL / Alphabet Inc. | 0,05 | 9,94 | 0,01 | 33,33 | 4,1787 | 0,4559 | |||
| AMZN / Amazon.com, Inc. | 0,04 | -12,14 | 0,01 | 0,00 | 4,1076 | -0,4185 | |||
| RTX / RTX Corporation | 0,06 | -4,25 | 0,01 | 0,00 | 4,0890 | -0,2352 | |||
| AAPL / Apple Inc. | 0,04 | -1,06 | 0,01 | -11,11 | 3,9554 | -0,8760 | |||
| XOM / Exxon Mobil Corporation | 0,07 | -0,76 | 0,01 | -12,50 | 3,6958 | -0,8905 | |||
| EMR / Emerson Electric Co. | 0,06 | -1,54 | 0,01 | 16,67 | 3,6133 | 0,2446 | |||
| ADBE / Adobe Inc. | 0,02 | 27,01 | 0,01 | 40,00 | 3,4448 | 0,4432 | |||
| TSM / Taiwan Semiconductor Manufacturing Company Limited - Depositary Receipt (Common Stock) | 0,03 | 7,23 | 0,01 | 75,00 | 3,3599 | 0,7961 | |||
| V / Visa Inc. | 0,02 | -0,80 | 0,01 | 0,00 | 3,1790 | -0,3521 | |||
| LMT / Lockheed Martin Corporation | 0,01 | -3,43 | 0,01 | 0,00 | 3,1322 | -0,3600 | |||
| BKNG / Booking Holdings Inc. | 0,00 | 6,31 | 0,01 | 50,00 | 2,9337 | 0,4824 | |||
| ASML / ASML Holding N.V. - Depositary Receipt (Common Stock) | 0,01 | 70,85 | 0,01 | 200,00 | 2,9271 | 1,3455 | |||
| CRM / Salesforce, Inc. | 0,02 | 6,58 | 0,01 | 20,00 | 2,9204 | -0,0898 | |||
| LOW / Lowe's Companies, Inc. | 0,03 | -4,58 | 0,01 | -16,67 | 2,6532 | -0,6095 | |||
| HON / Honeywell International Inc. | 0,02 | -7,44 | 0,01 | 0,00 | 2,5926 | -0,2503 | |||
| DIS / The Walt Disney Company | 0,04 | -14,99 | 0,01 | 25,00 | 2,4838 | -0,1120 | |||
| NKE / NIKE, Inc. | 0,07 | 0,90 | 0,01 | 25,00 | 2,4041 | 0,0273 | |||
| PFE / Pfizer Inc. | 0,19 | -1,89 | 0,00 | 0,00 | 2,1612 | -0,4090 | |||
| META / Meta Platforms, Inc. | 0,01 | 0,00 | 1,9288 | 1,9288 | |||||
| MRK / Merck & Co., Inc. | 0,04 | -0,88 | 0,00 | 0,00 | 1,6143 | -0,4471 | |||
| CL / Colgate-Palmolive Company | 0,02 | 0,00 | 0,00 | 0,00 | 0,6642 | -0,1001 | |||
| QQQ / Invesco QQQ Trust, Series 1 | 0,00 | 6,65 | 0,00 | 0,3841 | 0,0427 | ||||
| GE / General Electric Company | 0,00 | 0,00 | 0,00 | 0,3636 | 0,0483 | ||||
| BRK.A / Berkshire Hathaway Inc. | 0,00 | 0,00 | 0,00 | 0,3479 | -0,0772 | ||||
| PG / The Procter & Gamble Company | 0,00 | 0,00 | 0,00 | 0,2916 | -0,0568 | ||||
| PEP / PepsiCo, Inc. | 0,00 | 41,17 | 0,00 | 0,2582 | 0,0259 | ||||
| WMT / Walmart Inc. | 0,01 | 6,34 | 0,00 | 0,2348 | 0,0132 | ||||
| HD / The Home Depot, Inc. | 0,00 | 0,00 | 0,00 | 0,2305 | -0,0268 | ||||
| AMAT / Applied Materials, Inc. | 0,00 | 0,00 | 0,00 | 0,2300 | 0,0265 | ||||
| CAT / Caterpillar Inc. | 0,00 | 0,00 | 0,00 | 0,2195 | 0,0112 | ||||
| DHR / Danaher Corporation | 0,00 | 0,00 | 0,00 | 0,2057 | -0,0330 | ||||
| ORCL / Oracle Corporation | 0,00 | -11,77 | 0,00 | 0,1995 | 0,0381 | ||||
| IBDQ / iShares Trust - iShares iBonds Dec 2025 Term Corporate ETF | 0,02 | 0,00 | 0,00 | 0,1928 | -0,0219 | ||||
| GEV / GE Vernova Inc. | 0,00 | 0,00 | 0,00 | 0,1885 | 0,0670 | ||||
| ABBV / AbbVie Inc. | 0,00 | -12,44 | 0,00 | 0,1871 | -0,0819 | ||||
| IBDR / iShares Trust - iShares iBonds Dec 2026 Term Corporate ETF | 0,02 | 0,00 | 0,00 | 0,1828 | -0,0213 | ||||
| IBDS / iShares Trust - iShares iBonds Dec 2027 Term Corporate ETF | 0,02 | 67,96 | 0,00 | 0,1813 | 0,0609 | ||||
| NVDA / NVIDIA Corporation | 0,00 | 24,01 | 0,00 | 0,1804 | 0,0690 | ||||
| CBOE / Cboe Global Markets, Inc. | 0,00 | 0,00 | 0,00 | 0,1751 | -0,0145 | ||||
| COST / Costco Wholesale Corporation | 0,00 | 0,00 | 0,00 | 0,1699 | -0,0112 | ||||
| UNP / Union Pacific Corporation | 0,00 | 0,00 | 0,00 | 0,1684 | -0,0249 | ||||
| AMGN / Amgen Inc. | 0,00 | 0,00 | 0,00 | 0,1665 | -0,0407 | ||||
| CME / CME Group Inc. | 0,00 | 0,00 | 0,00 | 0,1494 | -0,0115 | ||||
| AVGO / Broadcom Inc. | 0,00 | 0,00 | 0,1427 | 0,1427 | |||||
| CVX / Chevron Corporation | 0,00 | 0,00 | 0,00 | 0,1384 | -0,0417 | ||||
| GOOGL / Alphabet Inc. | 0,00 | -10,10 | 0,00 | 0,1379 | -0,0128 | ||||
| JPM / JPMorgan Chase & Co. | 0,00 | 0,00 | 0,00 | 0,1245 | 0,0068 | ||||
| ETN / Eaton Corporation plc | 0,00 | 0,00 | 0,1231 | 0,1231 | |||||
| DHI / D.R. Horton, Inc. | 0,00 | 0,00 | 0,00 | 0,1231 | -0,0122 | ||||
| SPY / SPDR S&P 500 ETF | 0,00 | 0,00 | 0,00 | 0,1231 | -0,0015 | ||||
| EVRG / Evergy, Inc. | 0,00 | -5,09 | 0,00 | 0,1226 | -0,0217 | ||||
| CSCO / Cisco Systems, Inc. | 0,00 | 0,00 | 0,1069 | 0,1069 | |||||
| PLTR / Palantir Technologies Inc. | 0,00 | 0,00 | 0,0978 | 0,0978 | |||||
| NGL / NGL Energy Partners LP - Limited Partnership | 0,01 | 0,00 | 0,00 | 0,0267 | -0,0047 | ||||
| VEEV / Veeva Systems Inc. | 0,00 | -100,00 | 0,00 | 0,0000 | |||||
| VGT / Vanguard World Fund - Vanguard Information Technology ETF | 0,00 | -100,00 | 0,00 | 0,0000 | |||||
| BDX / Becton, Dickinson and Company | 0,00 | -100,00 | 0,00 | 0,0000 | |||||
| ELV / Elevance Health, Inc. | 0,00 | -100,00 | 0,00 | 0,0000 |