Statistiques de base
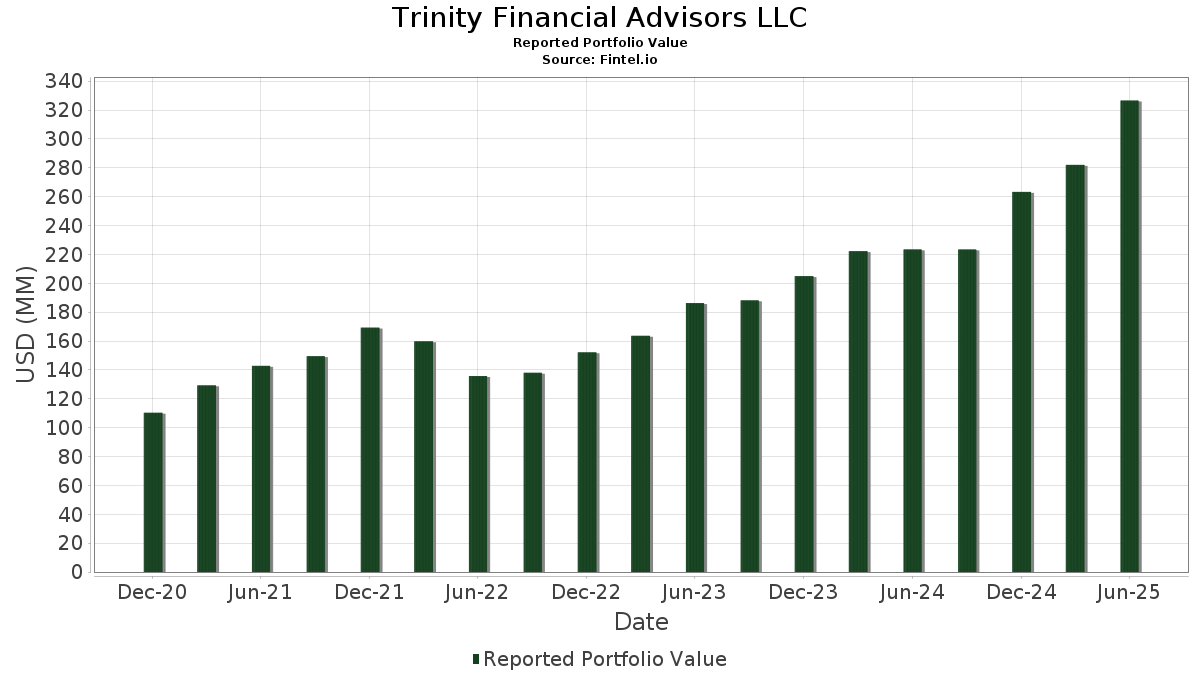
| Valeur du portefeuille | $ 326 555 984 |
| Positions actuelles | 91 |
Dernières positions, performances, ASG (à partir des dépôts 13F, 13D)
Trinity Financial Advisors LLC a déclaré un total de 91 positions dans ses derniers dépôts auprès de la SEC. La valeur la plus récente du portefeuille est calculée à 326 555 984 USD. Les actifs sous gestion réels (ASG) sont cette valeur plus les liquidités (qui ne sont pas divulguées). Les principales positions de Trinity Financial Advisors LLC sont SPDR S&P 500 ETF (US:SPY) , Dimensional ETF Trust - Dimensional International Value ETF (US:DFIV) , Vanguard Tax-Managed Funds - Vanguard FTSE Developed Markets ETF (US:VEA) , Berkshire Hathaway Inc. (US:BRK.B) , and Blue Owl Capital Corporation (US:OBDC) . Les nouvelles positions de Trinity Financial Advisors LLC incluent Dimensional ETF Trust - Dimensional International Core Equity Market ETF (US:DFAI) , Broadcom Inc. (US:AVGO) , Installed Building Products, Inc. (US:IBP) , iShares, Inc. - iShares MSCI Emerging Markets ETF (US:EEM) , and Vertiv Holdings Co (US:VRT) .
Meilleures augmentations ce trimestre
Nous utilisons la variation de l'allocation du portefeuille car il s'agit de l'indicateur le plus significatif. Les changements peuvent être dus à des transactions ou à des variations de prix des actions.
| Titre | Actions (en millions) |
Valeur ($ en millions) |
% du portefeuille | ΔPortefeuille % |
|---|---|---|---|---|
| 0,29 | 4,85 | 1,4861 | 1,3989 | |
| 0,05 | 7,43 | 2,2747 | 1,3407 | |
| 0,09 | 3,18 | 0,9752 | 0,9752 | |
| 0,01 | 3,11 | 0,9514 | 0,9514 | |
| 0,00 | 2,67 | 0,8176 | 0,6553 | |
| 0,05 | 13,82 | 4,2336 | 0,5689 | |
| 0,01 | 3,14 | 0,9622 | 0,5255 | |
| 0,01 | 1,24 | 0,3810 | 0,3810 | |
| 0,02 | 1,14 | 0,3493 | 0,3493 | |
| 0,04 | 8,02 | 2,4560 | 0,3312 |
Principales baisses ce trimestre
Nous utilisons la variation de l'allocation du portefeuille car il s'agit de l'indicateur le plus significatif. Les changements peuvent être dus à des transactions ou à des variations de prix des actions.
| Titre | Actions (en millions) |
Valeur ($ en millions) |
% du portefeuille | ΔPortefeuille % |
|---|---|---|---|---|
| 0,04 | 20,36 | 6,2346 | -1,7702 | |
| 1,15 | 16,93 | 5,1841 | -0,8042 | |
| 0,47 | 12,44 | 3,8095 | -0,6491 | |
| 0,02 | 3,20 | 0,9784 | -0,4710 | |
| 0,24 | 15,84 | 4,8509 | -0,4663 | |
| 0,00 | 0,00 | -0,4565 | ||
| 0,16 | 4,54 | 1,3902 | -0,4554 | |
| 0,04 | 2,19 | 0,6709 | -0,4286 | |
| 0,03 | 5,22 | 1,5976 | -0,3592 | |
| 0,64 | 27,56 | 8,4400 | -0,3579 |
Déclarations 13F et dépôts de fonds
Ce formulaire a été déposé le 2025-07-03 pour la période de déclaration 2025-06-30. Cliquez sur l'icône du lien pour voir l'historique complet des transactions.
Mettre à niveau pour débloquer les données premium et exporter vers Excel ![]() .
.
| Titre | Type | Prix moyen de l'action | Actions (en millions) |
ΔActions (%) |
ΔActions (%) |
Valeur ($ en millions) |
Portefeuille (%) |
ΔPortefeuille (%) |
|
|---|---|---|---|---|---|---|---|---|---|
| SPY / SPDR S&P 500 ETF | 0,06 | -0,01 | 40,17 | 15,07 | 12,3022 | -0,2867 | |||
| DFIV / Dimensional ETF Trust - Dimensional International Value ETF | 0,64 | 1,28 | 27,56 | 12,96 | 8,4400 | -0,3579 | |||
| VEA / Vanguard Tax-Managed Funds - Vanguard FTSE Developed Markets ETF | 0,46 | 3,31 | 26,12 | 17,60 | 7,9986 | -0,0102 | |||
| BRK.B / Berkshire Hathaway Inc. | 0,04 | 0,09 | 20,36 | -8,29 | 6,2346 | -1,7702 | |||
| OBDC / Blue Owl Capital Corporation | 1,15 | 2,25 | 16,93 | 1,93 | 5,1841 | -0,8042 | |||
| DFUS / Dimensional ETF Trust - Dimensional U.S. Equity Market ETF | 0,24 | -6,97 | 15,84 | 7,43 | 4,8509 | -0,4663 | |||
| VTI / Vanguard Index Funds - Vanguard Total Stock Market ETF | 0,05 | 17,79 | 13,82 | 36,02 | 4,2336 | 0,5689 | |||
| SCHD / Schwab Strategic Trust - Schwab U.S. Dividend Equity ETF | 0,47 | 1,48 | 12,44 | 0,61 | 3,8095 | -0,6491 | |||
| VOO / Vanguard Index Funds - Vanguard S&P 500 ETF | 0,02 | -1,04 | 11,63 | 14,10 | 3,5603 | -0,1138 | |||
| DFAS / Dimensional ETF Trust - Dimensional U.S. Small Cap ETF | 0,17 | 2,45 | 10,91 | 15,12 | 3,3398 | -0,0766 | |||
| VTEB / Vanguard Municipal Bond Funds - Vanguard Tax-Exempt Bond ETF | 0,20 | 29,51 | 9,58 | 27,50 | 2,9336 | 0,2245 | |||
| VO / Vanguard Index Funds - Vanguard Mid-Cap ETF | 0,03 | 15,42 | 8,04 | 30,11 | 2,4615 | 0,2338 | |||
| AAPL / Apple Inc. | 0,04 | 34,79 | 8,02 | 36,12 | 2,4560 | 0,3312 | |||
| SCHF / Schwab Strategic Trust - Schwab International Equity ETF | 0,35 | 0,66 | 7,75 | 14,20 | 2,3742 | -0,0739 | |||
| NVDA / NVIDIA Corporation | 0,05 | 84,77 | 7,43 | 186,80 | 2,2747 | 1,3407 | |||
| VYM / Vanguard Whitehall Funds - Vanguard High Dividend Yield ETF | 0,05 | -2,72 | 6,18 | 4,50 | 1,8927 | -0,2401 | |||
| JPM / JPMorgan Chase & Co. | 0,02 | -0,11 | 5,88 | 26,64 | 1,7995 | 0,1262 | |||
| VTV / Vanguard Index Funds - Vanguard Value ETF | 0,03 | -9,74 | 5,22 | -3,87 | 1,5976 | -0,3592 | |||
| HBAN / Huntington Bancshares Incorporated | 0,29 | 1 497,15 | 4,85 | 1 913,28 | 1,4861 | 1,3989 | |||
| DFAE / Dimensional ETF Trust - Dimensional Emerging Core Equity Market ETF | 0,16 | -21,72 | 4,54 | -11,31 | 1,3902 | -0,4554 | |||
| DFIS / Dimensional ETF Trust - Dimensional International Small Cap ETF | 0,12 | 2,08 | 3,56 | 19,62 | 1,0902 | 0,0168 | |||
| FI / Fiserv, Inc. | 0,02 | 0,00 | 3,20 | -20,50 | 0,9784 | -0,4710 | |||
| DFAI / Dimensional ETF Trust - Dimensional International Core Equity Market ETF | 0,09 | 3,18 | 0,9752 | 0,9752 | |||||
| AMZN / Amazon.com, Inc. | 0,01 | 110,99 | 3,14 | 159,45 | 0,9622 | 0,5255 | |||
| AVGO / Broadcom Inc. | 0,01 | 3,11 | 0,9514 | 0,9514 | |||||
| VUG / Vanguard Index Funds - Vanguard Growth ETF | 0,01 | -1,12 | 2,67 | 22,09 | 0,8177 | 0,0288 | |||
| BKNG / Booking Holdings Inc. | 0,00 | 356,44 | 2,67 | 493,11 | 0,8176 | 0,6553 | |||
| VCSH / Vanguard Scottsdale Funds - Vanguard Short-Term Corporate Bond ETF | 0,03 | 1,79 | 2,30 | 2,49 | 0,7053 | -0,1051 | |||
| IJH / iShares Trust - iShares Core S&P Mid-Cap ETF | 0,04 | -35,60 | 2,19 | -28,17 | 0,6709 | -0,4286 | |||
| MSFT / Microsoft Corporation | 0,00 | 2,90 | 2,15 | 37,16 | 0,6593 | 0,0934 | |||
| WFC / Wells Fargo & Company | 0,03 | -0,37 | 2,03 | 21,52 | 0,6228 | 0,0195 | |||
| EFA / iShares Trust - iShares MSCI EAFE ETF | 0,02 | 19,10 | 1,99 | 32,53 | 0,6090 | 0,0680 | |||
| IVV / iShares Trust - iShares Core S&P 500 ETF | 0,00 | 90,95 | 1,59 | 119,53 | 0,4854 | 0,2250 | |||
| VB / Vanguard Index Funds - Vanguard Small-Cap ETF | 0,01 | -13,42 | 1,37 | -2,35 | 0,4201 | -0,0865 | |||
| ROOT INC / COM CL A (77664L108) | 0,01 | 1,25 | 0,0000 | ||||||
| IBP / Installed Building Products, Inc. | 0,01 | 1,24 | 0,3810 | 0,3810 | |||||
| XOM / Exxon Mobil Corporation | 0,01 | 0,30 | 1,24 | -3,80 | 0,3795 | -0,0852 | |||
| EEM / iShares, Inc. - iShares MSCI Emerging Markets ETF | 0,02 | 1,14 | 0,3493 | 0,3493 | |||||
| DFLV / Dimensional ETF Trust - Dimensional US Large Cap Value ETF | 0,04 | -36,61 | 1,10 | -32,74 | 0,3361 | -0,2522 | |||
| GOOG / Alphabet Inc. | 0,01 | -1,89 | 1,01 | 14,09 | 0,3101 | -0,0101 | |||
| COST / Costco Wholesale Corporation | 0,00 | 0,00 | 0,99 | 2,27 | 0,3041 | -0,0457 | |||
| HD / The Home Depot, Inc. | 0,00 | 0,00 | 0,95 | 3,05 | 0,2899 | -0,0414 | |||
| WMT / Walmart Inc. | 0,01 | 0,00 | 0,87 | 11,79 | 0,2672 | -0,0143 | |||
| RTX / RTX Corporation | 0,01 | 0,00 | 0,76 | 12,08 | 0,2332 | -0,0117 | |||
| PANW / Palo Alto Networks, Inc. | 0,00 | -24,02 | 0,69 | -5,88 | 0,2109 | -0,0529 | |||
| GOOGL / Alphabet Inc. | 0,00 | 2,00 | 0,67 | 19,14 | 0,2042 | 0,0026 | |||
| CAT / Caterpillar Inc. | 0,00 | 0,00 | 0,66 | 26,97 | 0,2021 | 0,0147 | |||
| META / Meta Platforms, Inc. | 0,00 | -32,54 | 0,65 | -6,34 | 0,1991 | -0,0512 | |||
| SO / The Southern Company | 0,01 | 0,28 | 0,55 | -0,36 | 0,1697 | -0,0311 | |||
| GJR / Strats Trust For Procter & Gambel Security - Preferred Security | 0,00 | -19,21 | 0,53 | -25,35 | 0,1633 | -0,0942 | |||
| VRT / Vertiv Holdings Co | 0,00 | 0,53 | 0,1626 | 0,1626 | |||||
| UNP / Union Pacific Corporation | 0,00 | 0,00 | 0,52 | 2,75 | 0,1603 | -0,0234 | |||
| TOST / Toast, Inc. | 0,01 | -4,87 | 0,52 | 28,89 | 0,1600 | 0,0140 | |||
| DHIL / Diamond Hill Investment Group, Inc. | 0,00 | 0,51 | 0,1557 | 0,1557 | |||||
| ITOT / iShares Trust - iShares Core S&P Total U.S. Stock Market ETF | 0,00 | 0,19 | 0,51 | 15,56 | 0,1548 | -0,0030 | |||
| VDE / Vanguard World Fund - Vanguard Energy ETF | 0,00 | 0,36 | 0,49 | -0,61 | 0,1505 | -0,0278 | |||
| EMR / Emerson Electric Co. | 0,00 | 0,00 | 0,47 | 31,01 | 0,1438 | 0,0144 | |||
| QQQ / Invesco QQQ Trust, Series 1 | 0,00 | -5,29 | 0,46 | 15,71 | 0,1423 | -0,0024 | |||
| GS / The Goldman Sachs Group, Inc. | 0,00 | 0,31 | 0,46 | 38,91 | 0,1401 | 0,0214 | |||
| ITW / Illinois Tool Works Inc. | 0,00 | 0,00 | 0,45 | 3,23 | 0,1371 | -0,0193 | |||
| XLK / The Select Sector SPDR Trust - The Technology Select Sector SPDR Fund | 0,00 | 0,00 | 0,43 | 29,43 | 0,1323 | 0,0122 | |||
| MA / Mastercard Incorporated | 0,00 | 0,00 | 0,40 | 5,84 | 0,1223 | -0,0136 | |||
| GLW / Corning Incorporated | 0,01 | 0,00 | 0,39 | 24,29 | 0,1208 | 0,0064 | |||
| JNJ / Johnson & Johnson | 0,00 | 0,28 | 0,39 | -4,21 | 0,1187 | -0,0271 | |||
| TSLA / Tesla, Inc. | 0,00 | 0,08 | 0,39 | 19,08 | 0,1186 | 0,0012 | |||
| NFLX / Netflix, Inc. | 0,00 | -15,67 | 0,36 | 23,29 | 0,1103 | 0,0048 | |||
| VIG / Vanguard Specialized Funds - Vanguard Dividend Appreciation ETF | 0,00 | 0,00 | 0,36 | 9,57 | 0,1087 | -0,0082 | |||
| ASML / ASML Holding N.V. - Depositary Receipt (Common Stock) | 0,00 | -12,75 | 0,35 | 12,50 | 0,1075 | -0,0053 | |||
| GD / General Dynamics Corporation | 0,00 | 0,00 | 0,35 | 8,05 | 0,1072 | -0,0095 | |||
| CRM / Salesforce, Inc. | 0,00 | 0,00 | 0,34 | 7,23 | 0,1044 | -0,0105 | |||
| AXON / Axon Enterprise, Inc. | 0,00 | -32,84 | 0,34 | 3,05 | 0,1037 | -0,0148 | |||
| PEP / PepsiCo, Inc. | 0,00 | -3,82 | 0,33 | -16,16 | 0,1019 | -0,0411 | |||
| AJG / Arthur J. Gallagher & Co. | 0,00 | 0,00 | 0,32 | -6,98 | 0,0980 | -0,0262 | |||
| V / Visa Inc. | 0,00 | 0,11 | 0,31 | 4,75 | 0,0948 | -0,0119 | |||
| BK / The Bank of New York Mellon Corporation | 0,00 | 0,00 | 0,29 | 14,06 | 0,0896 | -0,0029 | |||
| ABT / Abbott Laboratories | 0,00 | -2,32 | 0,28 | 0,72 | 0,0860 | -0,0143 | |||
| KO / The Coca-Cola Company | 0,00 | 0,00 | 0,28 | -2,83 | 0,0845 | -0,0177 | |||
| ORCL / Oracle Corporation | 0,00 | 0,27 | 0,0828 | 0,0828 | |||||
| BRO / Brown & Brown, Inc. | 0,00 | 0,00 | 0,25 | -10,95 | 0,0774 | -0,0249 | |||
| NSC / Norfolk Southern Corporation | 0,00 | -5,76 | 0,25 | 9,61 | 0,0770 | -0,0060 | |||
| PFE / Pfizer Inc. | 0,01 | 0,15 | 0,25 | 0,00 | 0,0757 | -0,0135 | |||
| HUM / Humana Inc. | 0,00 | 0,00 | 0,25 | -7,89 | 0,0751 | -0,0209 | |||
| HIG / The Hartford Insurance Group, Inc. | 0,00 | 0,00 | 0,24 | 3,42 | 0,0741 | -0,0105 | |||
| MMM / 3M Company | 0,00 | 0,00 | 0,24 | 9,17 | 0,0731 | -0,0059 | |||
| BR / Broadridge Financial Solutions, Inc. | 0,00 | 0,00 | 0,23 | 1,81 | 0,0691 | -0,0109 | |||
| NEE / NextEra Energy, Inc. | 0,00 | 0,00 | 0,22 | -3,48 | 0,0680 | -0,0152 | |||
| CVX / Chevron Corporation | 0,00 | 0,07 | 0,21 | -8,23 | 0,0650 | -0,0184 | |||
| EXPE / Expedia Group, Inc. | 0,00 | 0,21 | 0,0646 | 0,0646 | |||||
| AXP / American Express Company | 0,00 | 0,21 | 0,0645 | 0,0645 | |||||
| P3 HEALTH PARTNERS INC / COM CL A (744413105) | 0,03 | 0,16 | 0,0000 | ||||||
| ICU / SeaStar Medical Holding Corporation | 0,01 | 50,00 | 0,01 | -53,85 | 0,0020 | -0,0031 | |||
| MELI / MercadoLibre, Inc. | 0,00 | -100,00 | 0,00 | 0,0000 | |||||
| MUB / iShares Trust - iShares National Muni Bond ETF | 0,00 | -100,00 | 0,00 | -100,00 | -0,4565 | ||||
| CL / Colgate-Palmolive Company | 0,00 | -100,00 | 0,00 | 0,0000 | |||||
| SCMB / Schwab Strategic Trust - Schwab Municipal Bond ETF | 0,00 | -100,00 | 0,00 | 0,0000 | |||||
| WSO / Watsco, Inc. | 0,00 | -100,00 | 0,00 | 0,0000 | |||||
| KMB / Kimberly-Clark Corporation | 0,00 | -100,00 | 0,00 | 0,0000 |