Statistiques de base
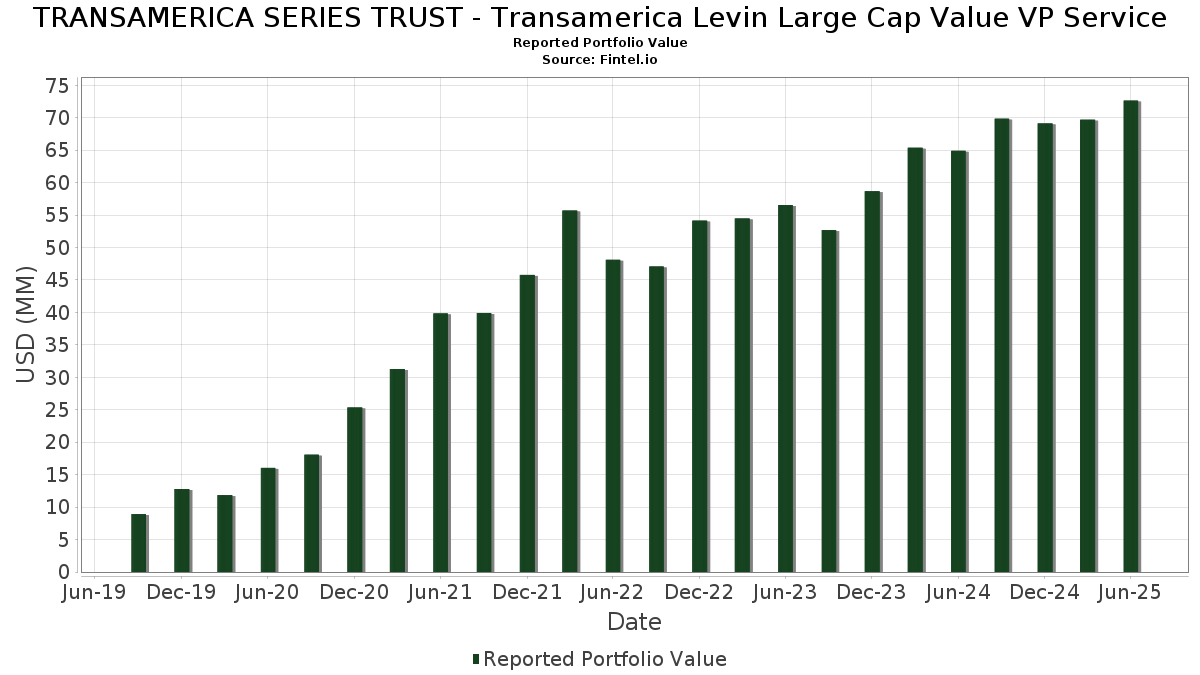
| Valeur du portefeuille | $ 72 644 092 |
| Positions actuelles | 47 |
Dernières positions, performances, ASG (à partir des dépôts 13F, 13D)
TRANSAMERICA SERIES TRUST - Transamerica Levin Large Cap Value VP Service a déclaré un total de 47 positions dans ses derniers dépôts auprès de la SEC. La valeur la plus récente du portefeuille est calculée à 72 644 092 USD. Les actifs sous gestion réels (ASG) sont cette valeur plus les liquidités (qui ne sont pas divulguées). Les principales positions de TRANSAMERICA SERIES TRUST - Transamerica Levin Large Cap Value VP Service sont JPMorgan Chase & Co. (US:JPM) , Wells Fargo & Company (US:WFC) , Exxon Mobil Corporation (US:XOM) , BlackRock, Inc. (US:BLK) , and Abbott Laboratories (US:ABT) . Les nouvelles positions de TRANSAMERICA SERIES TRUST - Transamerica Levin Large Cap Value VP Service incluent GE Vernova Inc. (US:GEV) , Amazon.com, Inc. (US:AMZN) , .
Meilleures augmentations ce trimestre
Nous utilisons la variation de l'allocation du portefeuille car il s'agit de l'indicateur le plus significatif. Les changements peuvent être dus à des transactions ou à des variations de prix des actions.
| Titre | Actions (en millions) |
Valeur ($ en millions) |
% du portefeuille | ΔPortefeuille % |
|---|---|---|---|---|
| 0,00 | 1,50 | 2,0662 | 2,0662 | |
| 0,01 | 1,46 | 2,0039 | 2,0039 | |
| 1,27 | 1,7522 | 1,7522 | ||
| 0,00 | 1,60 | 2,2062 | 0,7376 | |
| 0,01 | 1,46 | 2,0077 | 0,7141 | |
| 0,01 | 1,51 | 2,0785 | 0,5850 | |
| 0,02 | 1,41 | 1,9406 | 0,5160 | |
| 0,01 | 1,39 | 1,9122 | 0,4821 | |
| 0,02 | 1,97 | 2,7085 | 0,4217 | |
| 0,00 | 1,65 | 2,2693 | 0,3898 |
Principales baisses ce trimestre
Nous utilisons la variation de l'allocation du portefeuille car il s'agit de l'indicateur le plus significatif. Les changements peuvent être dus à des transactions ou à des variations de prix des actions.
| Titre | Actions (en millions) |
Valeur ($ en millions) |
% du portefeuille | ΔPortefeuille % |
|---|---|---|---|---|
| 0,00 | 1,12 | 1,5369 | -1,2009 | |
| 0,01 | 1,23 | 1,6988 | -1,1668 | |
| 0,02 | 2,36 | 3,2539 | -0,5545 | |
| 0,00 | 1,13 | 1,5598 | -0,4707 | |
| 0,01 | 1,30 | 1,7835 | -0,4307 | |
| 0,02 | 1,94 | 2,6728 | -0,3961 | |
| 0,03 | 0,89 | 1,2297 | -0,3836 | |
| 0,01 | 1,28 | 1,7615 | -0,3607 | |
| 0,01 | 1,42 | 1,9493 | -0,1976 | |
| 0,00 | 1,26 | 1,7282 | -0,1885 |
Déclarations 13F et dépôts de fonds
Ce formulaire a été déposé le 2025-08-27 pour la période de déclaration 2025-06-30. Cliquez sur l'icône du lien pour voir l'historique complet des transactions.
Mettre à niveau pour débloquer les données premium et exporter vers Excel ![]() .
.
| Titre | Type | Prix moyen de l'action | Actions (en millions) |
ΔActions (%) |
ΔActions (%) |
Valeur ($ en millions) |
Portefeuille (%) |
ΔPortefeuille (%) |
|
|---|---|---|---|---|---|---|---|---|---|
| JPM / JPMorgan Chase & Co. | 0,01 | -14,57 | 3,04 | 0,96 | 4,1813 | -0,1359 | |||
| WFC / Wells Fargo & Company | 0,03 | -1,74 | 2,71 | 9,66 | 3,7374 | 0,1847 | |||
| XOM / Exxon Mobil Corporation | 0,02 | -1,74 | 2,36 | -10,93 | 3,2539 | -0,5545 | |||
| BLK / BlackRock, Inc. | 0,00 | -1,72 | 2,34 | 8,95 | 3,2202 | 0,1392 | |||
| ABT / Abbott Laboratories | 0,02 | -1,74 | 2,26 | 0,71 | 3,1144 | -0,1079 | |||
| RTX / RTX Corporation | 0,02 | -1,74 | 2,24 | 8,32 | 3,0835 | 0,1160 | |||
| ICE / Intercontinental Exchange, Inc. | 0,01 | -1,73 | 2,19 | 4,54 | 3,0099 | 0,0079 | |||
| DIS / The Walt Disney Company | 0,02 | -1,73 | 1,97 | 23,48 | 2,7085 | 0,4217 | |||
| HIG / The Hartford Insurance Group, Inc. | 0,02 | -11,46 | 1,94 | -9,21 | 2,6728 | -0,3961 | |||
| BSX / Boston Scientific Corporation | 0,02 | -1,74 | 1,89 | 4,65 | 2,6054 | 0,0094 | |||
| PH / Parker-Hannifin Corporation | 0,00 | -1,72 | 1,84 | 12,94 | 2,5350 | 0,1952 | |||
| BAC / Bank of America Corporation | 0,04 | -1,74 | 1,67 | 11,37 | 2,2938 | 0,1478 | |||
| META / Meta Platforms, Inc. | 0,00 | -1,72 | 1,65 | 25,90 | 2,2693 | 0,3898 | |||
| COR / Cencora, Inc. | 0,01 | -1,74 | 1,64 | 5,93 | 2,2633 | 0,0365 | |||
| GS / The Goldman Sachs Group, Inc. | 0,00 | 20,88 | 1,60 | 56,60 | 2,2062 | 0,7376 | |||
| FOXA / Fox Corporation | 0,03 | -1,74 | 1,58 | -2,70 | 2,1812 | -0,1559 | |||
| GOOGL / Alphabet Inc. | 0,01 | 27,30 | 1,51 | 45,10 | 2,0785 | 0,5850 | |||
| MLM / Martin Marietta Materials, Inc. | 0,00 | -1,72 | 1,50 | 12,86 | 2,0672 | 0,1574 | |||
| GEV / GE Vernova Inc. | 0,00 | 1,50 | 2,0662 | 2,0662 | |||||
| TJX / The TJX Companies, Inc. | 0,01 | 17,12 | 1,50 | 18,75 | 2,0596 | 0,2516 | |||
| GILD / Gilead Sciences, Inc. | 0,01 | -1,73 | 1,46 | -2,73 | 2,0120 | -0,1450 | |||
| AVGO / Broadcom Inc. | 0,01 | -1,73 | 1,46 | 61,82 | 2,0077 | 0,7141 | |||
| AMZN / Amazon.com, Inc. | 0,01 | 1,46 | 2,0039 | 2,0039 | |||||
| PWR / Quanta Services, Inc. | 0,00 | -28,05 | 1,44 | 7,01 | 1,9761 | 0,0513 | |||
| AMT / American Tower Corporation | 0,01 | -1,73 | 1,42 | -0,14 | 1,9552 | -0,0867 | |||
| DUK / Duke Energy Corporation | 0,01 | -2,17 | 1,42 | -5,35 | 1,9493 | -0,1976 | |||
| MRK / Merck & Co., Inc. | 0,02 | 61,01 | 1,41 | 42,04 | 1,9406 | 0,5160 | |||
| MU / Micron Technology, Inc. | 0,01 | -1,74 | 1,39 | 39,36 | 1,9122 | 0,4821 | |||
| LOW / Lowe's Companies, Inc. | 0,01 | 11,97 | 1,37 | 6,52 | 1,8894 | 0,0403 | |||
| MSFT / Microsoft Corporation | 0,00 | -1,71 | 1,37 | 30,32 | 1,8882 | 0,3769 | |||
| COP / ConocoPhillips | 0,01 | -1,74 | 1,30 | -16,02 | 1,7835 | -0,4307 | |||
| ROK / Rockwell Automation, Inc. | 0,00 | -2,15 | 1,29 | 25,83 | 1,7709 | 0,3034 | |||
| PEP / PepsiCo, Inc. | 0,01 | -1,74 | 1,28 | -13,46 | 1,7615 | -0,3607 | |||
| FIXED INC CLEARING CORP.REPO / RA (000000000) | 1,27 | 1,7522 | 1,7522 | ||||||
| APD / Air Products and Chemicals, Inc. | 0,00 | -1,72 | 1,26 | -5,99 | 1,7282 | -0,1885 | |||
| MSI / Motorola Solutions, Inc. | 0,00 | -1,73 | 1,24 | -5,61 | 1,7136 | -0,1791 | |||
| ABBV / AbbVie Inc. | 0,01 | -30,24 | 1,23 | -38,23 | 1,6988 | -1,1668 | |||
| CSX / CSX Corporation | 0,04 | -1,74 | 1,19 | 8,95 | 1,6432 | 0,0709 | |||
| MDLZ / Mondelez International, Inc. | 0,02 | -1,74 | 1,18 | -2,31 | 1,6284 | -0,1096 | |||
| GM / General Motors Company | 0,02 | -1,74 | 1,18 | 2,80 | 1,6189 | -0,0224 | |||
| DAL / Delta Air Lines, Inc. | 0,02 | -1,74 | 1,17 | 10,83 | 1,6078 | 0,0957 | |||
| TMO / Thermo Fisher Scientific Inc. | 0,00 | -1,72 | 1,13 | -19,94 | 1,5598 | -0,4707 | |||
| UNH / UnitedHealth Group Incorporated | 0,00 | -1,76 | 1,12 | -41,48 | 1,5369 | -1,2009 | |||
| PLD / Prologis, Inc. | 0,01 | -1,73 | 1,02 | -7,56 | 1,3979 | -0,1790 | |||
| FCX / Freeport-McMoRan Inc. | 0,02 | -1,73 | 0,90 | 12,48 | 1,2409 | 0,0912 | |||
| SLB / Schlumberger Limited | 0,03 | -1,74 | 0,89 | -20,55 | 1,2297 | -0,3836 | |||
| TXT / Textron Inc. | 0,01 | -1,73 | 0,88 | 9,23 | 1,2066 | 0,0548 |