Statistiques de base
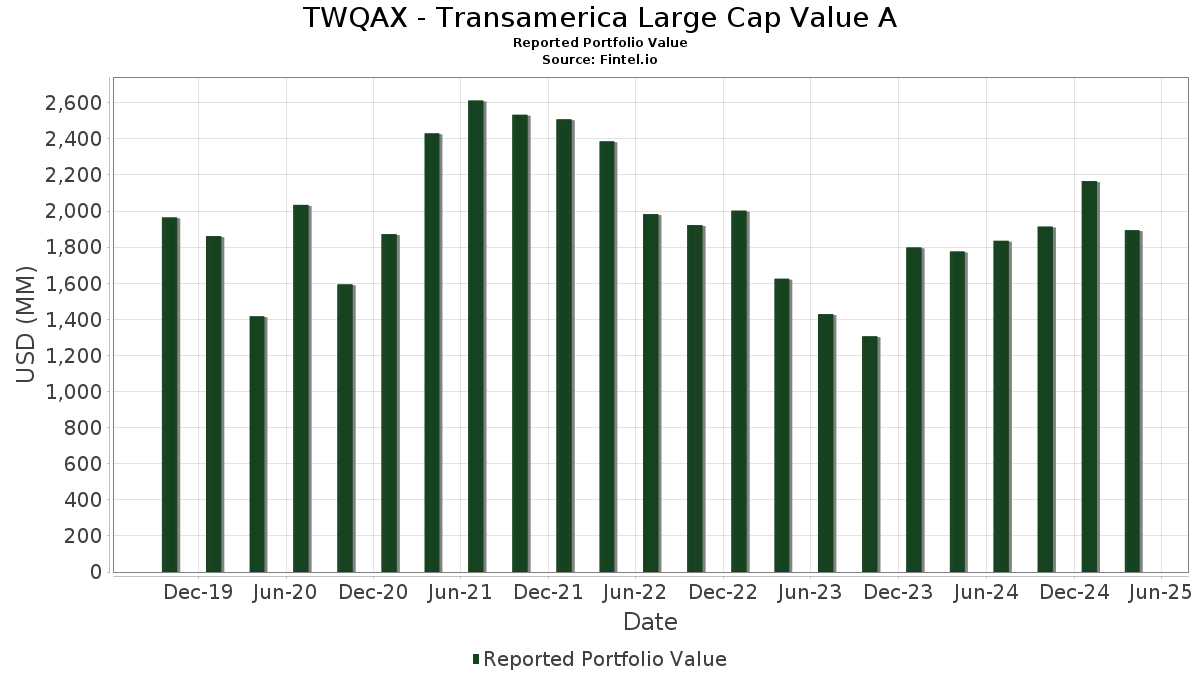
| Valeur du portefeuille | $ 1 894 000 220 |
| Positions actuelles | 47 |
Dernières positions, performances, ASG (à partir des dépôts 13F, 13D)
TWQAX - Transamerica Large Cap Value A a déclaré un total de 47 positions dans ses derniers dépôts auprès de la SEC. La valeur la plus récente du portefeuille est calculée à 1 894 000 220 USD. Les actifs sous gestion réels (ASG) sont cette valeur plus les liquidités (qui ne sont pas divulguées). Les principales positions de TWQAX - Transamerica Large Cap Value A sont JPMorgan Chase & Co. (US:JPM) , Wells Fargo & Company (US:WFC) , Exxon Mobil Corporation (US:XOM) , Abbott Laboratories (US:ABT) , and BlackRock, Inc. (US:BLK) . Les nouvelles positions de TWQAX - Transamerica Large Cap Value A incluent GE Vernova Inc. (GB:0ADM) , Rockwell Automation, Inc. (US:ROK) , .
Meilleures augmentations ce trimestre
Nous utilisons la variation de l'allocation du portefeuille car il s'agit de l'indicateur le plus significatif. Les changements peuvent être dus à des transactions ou à des variations de prix des actions.
| Titre | Actions (en millions) |
Valeur ($ en millions) |
% du portefeuille | ΔPortefeuille % |
|---|---|---|---|---|
| 0,12 | 45,07 | 2,3792 | 2,3792 | |
| 35,61 | 1,8797 | 1,8797 | ||
| 0,11 | 27,57 | 1,4556 | 1,4556 | |
| 0,50 | 34,36 | 1,8139 | 0,6932 | |
| 0,48 | 62,54 | 3,3013 | 0,6666 | |
| 0,18 | 41,65 | 2,1984 | 0,5370 | |
| 0,16 | 46,14 | 2,4356 | 0,4871 | |
| 0,34 | 57,56 | 3,0384 | 0,3755 | |
| 0,38 | 40,38 | 2,1318 | 0,3404 | |
| 0,63 | 66,60 | 3,5158 | 0,2407 |
Principales baisses ce trimestre
Nous utilisons la variation de l'allocation du portefeuille car il s'agit de l'indicateur le plus significatif. Les changements peuvent être dus à des transactions ou à des variations de prix des actions.
| Titre | Actions (en millions) |
Valeur ($ en millions) |
% du portefeuille | ΔPortefeuille % |
|---|---|---|---|---|
| 0,00 | 0,00 | -2,3324 | ||
| 0,29 | 37,45 | 1,9767 | -1,5095 | |
| 0,06 | 35,25 | 1,8610 | -0,8117 | |
| 0,68 | 28,43 | 1,5007 | -0,7329 | |
| 0,08 | 34,46 | 1,8193 | -0,5154 | |
| 0,08 | 45,86 | 2,4206 | -0,4844 | |
| 0,10 | 42,34 | 2,2350 | -0,4792 | |
| 0,46 | 41,49 | 2,1903 | -0,3176 | |
| 0,09 | 37,48 | 1,9785 | -0,3015 | |
| 0,19 | 30,20 | 1,5940 | -0,2922 |
Déclarations 13F et dépôts de fonds
Ce formulaire a été déposé le 2025-06-26 pour la période de déclaration 2025-04-30. Cliquez sur l'icône du lien pour voir l'historique complet des transactions.
Mettre à niveau pour débloquer les données premium et exporter vers Excel ![]() .
.
| Titre | Type | Prix moyen de l'action | Actions (en millions) |
ΔActions (%) |
ΔActions (%) |
Valeur ($ en millions) |
Portefeuille (%) |
ΔPortefeuille (%) |
|
|---|---|---|---|---|---|---|---|---|---|
| JPM / JPMorgan Chase & Co. | 0,35 | -9,28 | 84,77 | -16,97 | 4,4749 | -0,2371 | |||
| WFC / Wells Fargo & Company | 0,97 | -5,08 | 69,20 | -14,47 | 3,6527 | -0,0808 | |||
| XOM / Exxon Mobil Corporation | 0,63 | -5,08 | 66,60 | -6,15 | 3,5158 | 0,2407 | |||
| ABT / Abbott Laboratories | 0,48 | 7,18 | 62,54 | 9,55 | 3,3013 | 0,6666 | |||
| BLK / BlackRock, Inc. | 0,06 | -3,94 | 59,30 | -18,34 | 3,1304 | -0,2211 | |||
| ICE / Intercontinental Exchange, Inc. | 0,34 | -5,08 | 57,56 | -0,25 | 3,0384 | 0,3755 | |||
| RTX / RTX Corporation | 0,44 | -5,08 | 55,64 | -7,16 | 2,9370 | 0,1714 | |||
| HIG / The Hartford Insurance Group, Inc. | 0,44 | -14,12 | 54,20 | -5,56 | 2,8613 | 0,2125 | |||
| ABBV / AbbVie Inc. | 0,27 | -14,42 | 52,31 | -9,21 | 2,7614 | 0,1024 | |||
| BSX / Boston Scientific Corporation | 0,51 | -17,15 | 52,12 | -16,74 | 2,7514 | -0,1376 | |||
| COR / Cencora, Inc. | 0,16 | -5,08 | 46,14 | 9,28 | 2,4356 | 0,4871 | |||
| PH / Parker-Hannifin Corporation | 0,08 | -14,87 | 45,86 | -27,15 | 2,4206 | -0,4844 | |||
| 0ADM / GE Vernova Inc. | 0,12 | 45,07 | 2,3792 | 2,3792 | |||||
| PWR / Quanta Services, Inc. | 0,15 | -5,08 | 43,64 | -9,69 | 2,3037 | 0,0737 | |||
| UNH / UnitedHealth Group Incorporated | 0,10 | -5,08 | 42,34 | -28,01 | 2,2350 | -0,4792 | |||
| DUK / Duke Energy Corporation | 0,35 | -24,24 | 42,11 | -17,45 | 2,2227 | -0,1314 | |||
| AMT / American Tower Corporation | 0,18 | -5,08 | 41,65 | 15,68 | 2,1984 | 0,5370 | |||
| DIS / The Walt Disney Company | 0,46 | -5,08 | 41,49 | -23,64 | 2,1903 | -0,3176 | |||
| MLM / Martin Marietta Materials, Inc. | 0,08 | -5,08 | 41,20 | -8,59 | 2,1750 | 0,0947 | |||
| FOXA / Fox Corporation | 0,81 | -5,08 | 40,48 | -7,66 | 2,1369 | 0,1137 | |||
| GILD / Gilead Sciences, Inc. | 0,38 | -5,08 | 40,38 | 4,04 | 2,1318 | 0,3404 | |||
| BAC / Bank of America Corporation | 1,01 | -5,08 | 40,38 | -18,25 | 2,1317 | -0,1478 | |||
| PEP / PepsiCo, Inc. | 0,28 | -5,08 | 37,78 | -14,60 | 1,9945 | -0,0473 | |||
| MSI / Motorola Solutions, Inc. | 0,09 | -19,16 | 37,48 | -24,14 | 1,9785 | -0,3015 | |||
| TJX / The TJX Companies, Inc. | 0,29 | -73,78 | 37,45 | -33,59 | 1,9767 | -1,5095 | |||
| COP / ConocoPhillips | 0,42 | -5,08 | 37,00 | -14,41 | 1,9529 | -0,0418 | |||
| FIXED INC CLEARING CORP.REPO / RA (000000000) | 35,61 | 1,8797 | 1,8797 | ||||||
| META / Meta Platforms, Inc. | 0,06 | -23,58 | 35,25 | -39,13 | 1,8610 | -0,8117 | |||
| LOW / Lowe's Companies, Inc. | 0,16 | -5,08 | 34,90 | -18,40 | 1,8421 | -0,1314 | |||
| APD / Air Products and Chemicals, Inc. | 0,13 | -5,08 | 34,69 | -23,25 | 1,8310 | -0,2546 | |||
| TMO / Thermo Fisher Scientific Inc. | 0,08 | -5,08 | 34,46 | -31,87 | 1,8193 | -0,5154 | |||
| MDLZ / Mondelez International, Inc. | 0,50 | 20,44 | 34,36 | 41,50 | 1,8139 | 0,6932 | |||
| MSFT / Microsoft Corporation | 0,08 | -5,08 | 31,33 | -9,61 | 1,6539 | 0,0543 | |||
| GM / General Motors Company | 0,69 | -5,08 | 31,09 | -13,18 | 1,6411 | -0,0115 | |||
| GOOGL / Alphabet Inc. | 0,19 | -5,08 | 30,20 | -26,12 | 1,5940 | -0,2922 | |||
| CSX / CSX Corporation | 1,05 | -5,08 | 29,53 | -18,95 | 1,5588 | -0,1225 | |||
| AVGO / Broadcom Inc. | 0,15 | -5,08 | 29,28 | -17,44 | 1,5456 | -0,0910 | |||
| GS / The Goldman Sachs Group, Inc. | 0,05 | -5,08 | 28,97 | -18,84 | 1,5295 | -0,1181 | |||
| DAL / Delta Air Lines, Inc. | 0,68 | -5,08 | 28,43 | -41,26 | 1,5007 | -0,7329 | |||
| PLD / Prologis, Inc. | 0,28 | -5,08 | 28,39 | -18,65 | 1,4984 | -0,1120 | |||
| ROK / Rockwell Automation, Inc. | 0,11 | 27,57 | 1,4556 | 1,4556 | |||||
| MRK / Merck & Co., Inc. | 0,31 | -5,08 | 26,63 | -18,16 | 1,4055 | -0,0960 | |||
| SLB / Schlumberger Limited | 0,76 | -5,08 | 25,27 | -21,65 | 1,3339 | -0,1545 | |||
| MU / Micron Technology, Inc. | 0,32 | -5,08 | 24,94 | -19,95 | 1,3164 | -0,1213 | |||
| TSN / Tyson Foods, Inc. | 0,40 | -5,08 | 24,78 | 2,90 | 1,3079 | 0,1967 | |||
| TXT / Textron Inc. | 0,31 | -5,08 | 22,09 | -12,70 | 1,1660 | -0,0017 | |||
| FCX / Freeport-McMoRan Inc. | 0,60 | -5,08 | 21,54 | -4,61 | 1,1372 | 0,0950 | |||
| CAT / Caterpillar Inc. | 0,00 | -100,00 | 0,00 | -100,00 | -2,3324 |