Statistiques de base
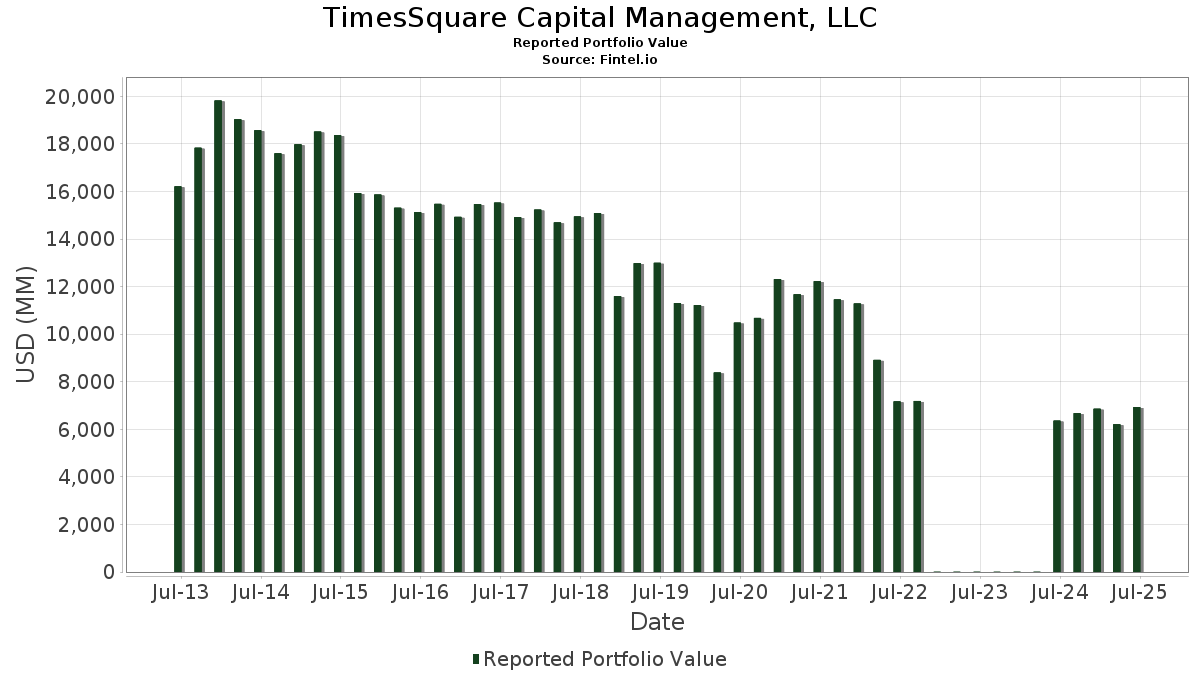
| Valeur du portefeuille | $ 6 934 992 157 |
| Positions actuelles | 145 |
Dernières positions, performances, ASG (à partir des dépôts 13F, 13D)
TimesSquare Capital Management, LLC a déclaré un total de 145 positions dans ses derniers dépôts auprès de la SEC. La valeur la plus récente du portefeuille est calculée à 6 934 992 157 USD. Les actifs sous gestion réels (ASG) sont cette valeur plus les liquidités (qui ne sont pas divulguées). Les principales positions de TimesSquare Capital Management, LLC sont EMCOR Group, Inc. (US:EME) , JFrog Ltd. (US:FROG) , Cencora, Inc. (US:COR) , HubSpot, Inc. (US:HUBS) , and Veeva Systems Inc. (US:VEEV) . Les nouvelles positions de TimesSquare Capital Management, LLC incluent Flutter Entertainment plc (US:PDYPF) , Guardian Pharmacy Services, Inc. (US:GRDN) , Braze, Inc. (US:BRZE) , SiTime Corporation (US:SITM) , and . Les principales industries de TimesSquare Capital Management, LLC sont "Furniture And Fixtures" (sic 25) , "Motion Pictures and Film" (sic 78) , and "Amusement And Recreation Services" (sic 79) .
Meilleures augmentations ce trimestre
Nous utilisons la variation de l'allocation du portefeuille car il s'agit de l'indicateur le plus significatif. Les changements peuvent être dus à des transactions ou à des variations de prix des actions.
| Titre | Actions (en millions) |
Valeur ($ en millions) |
% du portefeuille | ΔPortefeuille % |
|---|---|---|---|---|
| 0,12 | 46,02 | 0,6636 | 0,6636 | |
| 0,13 | 106,57 | 1,5367 | 0,5013 | |
| 0,28 | 150,03 | 2,1633 | 0,4740 | |
| 1,03 | 96,56 | 1,3923 | 0,4166 | |
| 0,11 | 28,45 | 0,4102 | 0,4102 | |
| 0,10 | 27,47 | 0,3962 | 0,3962 | |
| 0,09 | 24,30 | 0,3504 | 0,3504 | |
| 0,18 | 23,59 | 0,3401 | 0,3401 | |
| 0,31 | 22,54 | 0,3251 | 0,3251 | |
| 0,13 | 22,06 | 0,3182 | 0,3182 |
Principales baisses ce trimestre
Nous utilisons la variation de l'allocation du portefeuille car il s'agit de l'indicateur le plus significatif. Les changements peuvent être dus à des transactions ou à des variations de prix des actions.
| Titre | Actions (en millions) |
Valeur ($ en millions) |
% du portefeuille | ΔPortefeuille % |
|---|---|---|---|---|
| 0,31 | 124,28 | 1,7921 | -0,6964 | |
| 0,08 | 39,80 | 0,5740 | -0,4580 | |
| 0,50 | 64,78 | 0,9341 | -0,2874 | |
| 0,85 | 91,15 | 1,3144 | -0,2860 | |
| 0,52 | 66,58 | 0,9600 | -0,2325 | |
| 1,04 | 94,09 | 1,3568 | -0,2248 | |
| 0,38 | 118,81 | 1,7132 | -0,2107 | |
| 0,36 | 71,72 | 1,0341 | -0,2040 | |
| 0,31 | 57,52 | 0,8294 | -0,2019 | |
| 1,59 | 77,76 | 1,1213 | -0,1955 |
Déclarations 13D/G
Il s'agit d'une liste des déclarations 13D et 13G déposées au cours de la dernière année (le cas échéant). Cliquez sur l'icône du lien pour voir l'historique complet des transactions. Les lignes vertes indiquent de nouvelles positions. Les lignes rouges indiquent des positions fermées.
| Date de dépôt | Formulaire | Titre | Actions précédentes |
Actions actuelles |
ΔActions % | % de participation |
% ΔParticipation | |
|---|---|---|---|---|---|---|---|---|
| 2025-02-03 | MVBF / MVB Financial Corp. | 550 735 | 924 053 | 67,79 | 7,14 | 65,28 |
Déclarations 13F et dépôts de fonds
Ce formulaire a été déposé le 2025-08-08 pour la période de déclaration 2025-06-30. Cliquez sur l'icône du lien pour voir l'historique complet des transactions.
Mettre à niveau pour débloquer les données premium et exporter vers Excel ![]() .
.
| Titre | Type | Prix moyen de l'action | Actions (en millions) |
ΔActions (%) |
ΔActions (%) |
Valeur ($ en millions) |
Portefeuille (%) |
ΔPortefeuille (%) |
|
|---|---|---|---|---|---|---|---|---|---|
| EME / EMCOR Group, Inc. | 0,28 | -1,17 | 150,03 | 43,01 | 2,1633 | 0,4740 | |||
| FROG / JFrog Ltd. | 3,40 | -6,12 | 149,25 | 28,74 | 2,1521 | 0,2852 | |||
| COR / Cencora, Inc. | 0,47 | -0,09 | 139,70 | 7,73 | 2,0144 | -0,0738 | |||
| HUBS / HubSpot, Inc. | 0,24 | 9,88 | 133,37 | 7,06 | 1,9231 | -0,0830 | |||
| VEEV / Veeva Systems Inc. | 0,45 | 1,76 | 130,39 | 26,51 | 1,8801 | 0,2204 | |||
| BJ / BJ's Wholesale Club Holdings, Inc. | 1,17 | 20,88 | 126,28 | 14,23 | 1,8209 | 0,0407 | |||
| LNG / Cheniere Energy, Inc. | 0,51 | 1,72 | 124,85 | 7,05 | 1,8003 | -0,0778 | |||
| CYBR / CyberArk Software Ltd. | 0,31 | -33,19 | 124,28 | -19,58 | 1,7921 | -0,6964 | |||
| RRX / Regal Rexnord Corporation | 0,85 | -2,25 | 123,48 | 24,46 | 1,7805 | 0,1829 | |||
| VRSK / Verisk Analytics, Inc. | 0,38 | -4,98 | 118,81 | -0,55 | 1,7132 | -0,2107 | |||
| MPWR / Monolithic Power Systems, Inc. | 0,15 | 1,79 | 108,18 | 28,37 | 1,5599 | 0,2028 | |||
| IDXX / IDEXX Laboratories, Inc. | 0,20 | 1,79 | 107,95 | 30,00 | 1,5566 | 0,2193 | |||
| AXON / Axon Enterprise, Inc. | 0,13 | 5,29 | 106,57 | 65,74 | 1,5367 | 0,5013 | |||
| TPG / TPG Inc. | 1,87 | 1,35 | 98,11 | 12,08 | 1,4148 | 0,0051 | |||
| HOOD / Robinhood Markets, Inc. | 1,03 | -29,16 | 96,56 | 59,36 | 1,3923 | 0,4166 | |||
| ORLY / O'Reilly Automotive, Inc. | 1,04 | 1 422,74 | 94,09 | -4,20 | 1,3568 | -0,2248 | |||
| TTAN / ServiceTitan, Inc. | 0,85 | -18,61 | 91,15 | -8,28 | 1,3144 | -0,2860 | |||
| APP / AppLovin Corporation | 0,26 | -19,20 | 90,90 | 6,75 | 1,3108 | -0,0605 | |||
| CTAS / Cintas Corporation | 0,41 | -0,61 | 90,89 | 7,77 | 1,3106 | -0,0475 | |||
| DASH / DoorDash, Inc. | 0,37 | 1,88 | 90,11 | 37,41 | 1,2994 | 0,2433 | |||
| ESAB / ESAB Corporation | 0,75 | -5,37 | 90,06 | -2,08 | 1,2986 | -0,1825 | |||
| IT / Gartner, Inc. | 0,22 | 1,87 | 89,69 | -1,90 | 1,2933 | -0,1789 | |||
| IBKR / Interactive Brokers Group, Inc. | 1,59 | 305,42 | 88,12 | 35,66 | 1,2706 | 0,2247 | |||
| CW / Curtiss-Wright Corporation | 0,18 | -9,47 | 88,02 | 39,40 | 1,2692 | 0,2524 | |||
| INSM / Insmed Incorporated | 0,87 | -17,92 | 87,91 | 8,28 | 1,2676 | -0,0397 | |||
| STVN / Stevanato Group S.p.A. | 3,33 | -1,00 | 81,24 | 18,45 | 1,1715 | 0,0670 | |||
| PINS / Pinterest, Inc. | 2,21 | 1,26 | 79,33 | 17,13 | 1,1439 | 0,0533 | |||
| LSCC / Lattice Semiconductor Corporation | 1,59 | 1,81 | 77,76 | -4,91 | 1,1213 | -0,1955 | |||
| DT / Dynatrace, Inc. | 1,38 | 1,56 | 76,39 | 18,92 | 1,1015 | 0,0671 | |||
| OS / OneStream, Inc. | 2,67 | -1,22 | 75,47 | 31,00 | 1,0882 | 0,1605 | |||
| ARGX / argenx SE - Depositary Receipt (Common Stock) | 0,13 | 6,61 | 73,63 | -0,71 | 1,0617 | -0,1325 | |||
| TSCO / Tractor Supply Company | 1,36 | 11,23 | 71,81 | 6,53 | 1,0355 | -0,0500 | |||
| ALL / The Allstate Corporation | 0,36 | -4,05 | 71,72 | -6,72 | 1,0341 | -0,2040 | |||
| WH / Wyndham Hotels & Resorts, Inc. | 0,86 | 36,08 | 70,19 | 22,10 | 1,0121 | 0,0864 | |||
| LOAR / Loar Holdings Inc. | 0,78 | -21,82 | 66,93 | -4,64 | 0,9651 | -0,1652 | |||
| ROST / Ross Stores, Inc. | 0,52 | -9,95 | 66,58 | -10,10 | 0,9600 | -0,2325 | |||
| HXL / Hexcel Corporation | 1,16 | -0,50 | 65,57 | 2,64 | 0,9454 | -0,0832 | |||
| CSGP / CoStar Group, Inc. | 0,81 | 7,61 | 65,14 | 9,20 | 0,9393 | -0,0213 | |||
| INSP / Inspire Medical Systems, Inc. | 0,50 | 4,83 | 64,78 | -14,59 | 0,9341 | -0,2874 | |||
| TYL / Tyler Technologies, Inc. | 0,11 | 1,84 | 64,32 | 3,85 | 0,9275 | -0,0699 | |||
| PFGC / Performance Food Group Company | 0,69 | -0,48 | 60,37 | 10,71 | 0,8704 | -0,0076 | |||
| MLM / Martin Marietta Materials, Inc. | 0,11 | -4,01 | 58,98 | 10,21 | 0,8505 | -0,0113 | |||
| CWST / Casella Waste Systems, Inc. | 0,50 | 10,18 | 57,81 | 14,00 | 0,8336 | 0,0170 | |||
| TRMB / Trimble Inc. | 0,76 | 1,36 | 57,60 | 17,31 | 0,8305 | 0,0399 | |||
| WCN / Waste Connections, Inc. | 0,31 | -6,12 | 57,52 | -10,19 | 0,8294 | -0,2019 | |||
| BSY / Bentley Systems, Incorporated | 1,06 | -3,52 | 57,18 | 32,35 | 0,8245 | 0,1288 | |||
| IOT / Samsara Inc. | 1,43 | 66,96 | 56,94 | 73,28 | 0,8211 | 0,2919 | |||
| TRGP / Targa Resources Corp. | 0,32 | 14,54 | 54,90 | -0,54 | 0,7916 | -0,0972 | |||
| ESTC / Elastic N.V. | 0,64 | 23,91 | 53,71 | 17,27 | 0,7745 | 0,0370 | |||
| POOL / Pool Corporation | 0,18 | 5,17 | 53,10 | -3,70 | 0,7657 | -0,1223 | |||
| NICE / NICE Ltd. - Depositary Receipt (Common Stock) | 0,31 | -1,15 | 52,36 | 8,30 | 0,7550 | -0,0236 | |||
| GFL / GFL Environmental Inc. | 1,03 | 1,48 | 51,93 | 5,99 | 0,7488 | -0,0401 | |||
| BRO / Brown & Brown, Inc. | 0,45 | 25,23 | 49,84 | 11,61 | 0,7187 | -0,0004 | |||
| RPM / RPM International Inc. | 0,45 | 5,22 | 49,82 | -0,09 | 0,7184 | -0,0846 | |||
| VCTR / Victory Capital Holdings, Inc. | 0,78 | -2,78 | 49,55 | 6,97 | 0,7145 | -0,0315 | |||
| MRVL / Marvell Technology, Inc. | 0,62 | 14,89 | 48,31 | 44,43 | 0,6967 | 0,1580 | |||
| TTWO / Take-Two Interactive Software, Inc. | 0,20 | 1,74 | 47,47 | 19,22 | 0,6845 | 0,0433 | |||
| AME / AMETEK, Inc. | 0,26 | 8,01 | 47,04 | 13,54 | 0,6783 | 0,0111 | |||
| VRNA / Verona Pharma plc - Depositary Receipt (Common Stock) | 0,49 | -0,59 | 46,68 | 48,08 | 0,6732 | 0,1655 | |||
| CSL / Carlisle Companies Incorporated | 0,12 | 46,02 | 0,6636 | 0,6636 | |||||
| ADUS / Addus HomeCare Corporation | 0,39 | 13,94 | 45,39 | 32,72 | 0,6545 | 0,1038 | |||
| PR / Permian Resources Corporation | 3,29 | -12,49 | 44,77 | -13,94 | 0,6455 | -0,1922 | |||
| SAFT / Safety Insurance Group, Inc. | 0,55 | -3,85 | 43,88 | -3,22 | 0,6327 | -0,0974 | |||
| RNR / RenaissanceRe Holdings Ltd. | 0,18 | -3,96 | 43,73 | -2,80 | 0,6306 | -0,0939 | |||
| FICO / Fair Isaac Corporation | 0,02 | 10,87 | 42,89 | 9,90 | 0,6185 | -0,0100 | |||
| APH / Amphenol Corporation | 0,43 | -43,00 | 42,52 | -14,19 | 0,6131 | -0,1848 | |||
| HLNE / Hamilton Lane Incorporated | 0,30 | -4,26 | 42,12 | -8,48 | 0,6073 | -0,1338 | |||
| EHC / Encompass Health Corporation | 0,34 | -14,93 | 41,48 | 3,00 | 0,5982 | -0,0504 | |||
| JBTM / JBT Marel Corporation | 0,34 | 147,52 | 40,69 | 143,59 | 0,5867 | 0,3177 | |||
| AZEK / The AZEK Company Inc. | 0,75 | -6,75 | 40,61 | 3,66 | 0,5855 | -0,0453 | |||
| CRWD / CrowdStrike Holdings, Inc. | 0,08 | -57,00 | 39,80 | -37,89 | 0,5740 | -0,4580 | |||
| FND / Floor & Decor Holdings, Inc. | 0,51 | 1,79 | 38,64 | -3,92 | 0,5571 | -0,0904 | |||
| ACVA / ACV Auctions Inc. | 2,35 | -7,27 | 38,10 | 6,75 | 0,5494 | -0,0253 | |||
| VERX / Vertex, Inc. | 1,07 | 0,29 | 37,73 | 1,22 | 0,5441 | -0,0562 | |||
| TTEK / Tetra Tech, Inc. | 1,05 | -10,84 | 37,68 | 9,61 | 0,5433 | -0,0102 | |||
| PCTY / Paylocity Holding Corporation | 0,20 | 1,86 | 36,54 | -1,48 | 0,5268 | -0,0704 | |||
| ITT / ITT Inc. | 0,22 | 17,29 | 34,27 | 42,42 | 0,4941 | 0,1067 | |||
| QTWO / Q2 Holdings, Inc. | 0,36 | 2,64 | 34,01 | 20,06 | 0,4904 | 0,0342 | |||
| VVV / Valvoline Inc. | 0,89 | 35,53 | 33,86 | 47,44 | 0,4883 | 0,1185 | |||
| SAIA / Saia, Inc. | 0,12 | 4,22 | 33,24 | -18,28 | 0,4793 | -0,1757 | |||
| FIX / Comfort Systems USA, Inc. | 0,06 | -21,43 | 33,09 | 30,70 | 0,4771 | 0,0694 | |||
| WSO / Watsco, Inc. | 0,07 | 18,68 | 33,06 | 3,11 | 0,4767 | -0,0396 | |||
| CRDO / Credo Technology Group Holding Ltd | 0,35 | -17,31 | 32,68 | 90,64 | 0,4713 | 0,1952 | |||
| PAR / PAR Technology Corporation | 0,46 | 2,42 | 32,25 | 15,83 | 0,4650 | 0,0167 | |||
| EFX / Equifax Inc. | 0,12 | -17,42 | 32,23 | -12,06 | 0,4648 | -0,1255 | |||
| KTOS / Kratos Defense & Security Solutions, Inc. | 0,69 | -3,51 | 32,07 | 50,95 | 0,4625 | 0,1203 | |||
| VCEL / Vericel Corporation | 0,74 | 13,94 | 31,63 | 8,65 | 0,4561 | -0,0127 | |||
| WK / Workiva Inc. | 0,46 | -2,81 | 31,46 | -12,36 | 0,4536 | -0,1244 | |||
| RGEN / Repligen Corporation | 0,24 | 1,80 | 29,88 | -0,49 | 0,4309 | -0,0527 | |||
| CWAN / Clearwater Analytics Holdings, Inc. | 1,36 | 23,38 | 29,83 | 0,96 | 0,4302 | -0,0456 | |||
| EVR / Evercore Inc. | 0,11 | 28,45 | 0,4102 | 0,4102 | |||||
| CHEF / The Chefs' Warehouse, Inc. | 0,44 | 33,02 | 28,13 | 55,86 | 0,4057 | 0,1150 | |||
| MYRG / MYR Group Inc. | 0,15 | -8,30 | 28,00 | 47,14 | 0,4037 | 0,0973 | |||
| PDYPF / Flutter Entertainment plc | 0,10 | 27,47 | 0,3962 | 0,3962 | |||||
| RBC / RBC Bearings Incorporated | 0,07 | -7,99 | 27,13 | 10,04 | 0,3912 | -0,0058 | |||
| INTA / Intapp, Inc. | 0,51 | 28,93 | 26,49 | 14,00 | 0,3820 | 0,0078 | |||
| ROAD / Construction Partners, Inc. | 0,25 | -24,77 | 26,46 | 11,25 | 0,3815 | -0,0014 | |||
| BOOT / Boot Barn Holdings, Inc. | 0,17 | -37,96 | 26,34 | -12,23 | 0,3797 | -0,1034 | |||
| MTSI / MACOM Technology Solutions Holdings, Inc. | 0,18 | -15,49 | 25,88 | 20,64 | 0,3732 | 0,0277 | |||
| PAY / Paymentus Holdings, Inc. | 0,78 | 15,69 | 25,60 | 45,17 | 0,3691 | 0,0851 | |||
| NSA / National Storage Affiliates Trust | 0,76 | -4,96 | 24,34 | -22,83 | 0,3510 | -0,1570 | |||
| IWO / iShares Trust - iShares Russell 2000 Growth ETF | 0,09 | 24,30 | 0,3504 | 0,3504 | |||||
| WRBY / Warby Parker Inc. | 1,10 | -18,10 | 24,16 | -1,48 | 0,3483 | -0,0465 | |||
| OLLI / Ollie's Bargain Outlet Holdings, Inc. | 0,18 | 23,59 | 0,3401 | 0,3401 | |||||
| ERJ / Embraer S.A. - Depositary Receipt (Common Stock) | 0,41 | -13,24 | 23,43 | 6,87 | 0,3378 | -0,0152 | |||
| PJT / PJT Partners Inc. | 0,14 | 5,34 | 23,09 | 26,06 | 0,3330 | 0,0380 | |||
| PSN / Parsons Corporation | 0,31 | 22,54 | 0,3251 | 0,3251 | |||||
| WSC / WillScot Holdings Corporation | 0,82 | -6,14 | 22,35 | -7,49 | 0,3223 | -0,0668 | |||
| GTLS / Chart Industries, Inc. | 0,13 | 22,06 | 0,3182 | 0,3182 | |||||
| EXPO / Exponent, Inc. | 0,29 | -2,12 | 21,86 | -9,78 | 0,3151 | -0,0750 | |||
| BFAM / Bright Horizons Family Solutions Inc. | 0,17 | 0,88 | 21,21 | -1,86 | 0,3059 | -0,0422 | |||
| EE / Excelerate Energy, Inc. | 0,72 | 49,84 | 21,00 | 53,18 | 0,3029 | 0,0821 | |||
| SLNO / Soleno Therapeutics, Inc. | 0,25 | 19,73 | 20,72 | 40,40 | 0,2988 | 0,0611 | |||
| AIT / Applied Industrial Technologies, Inc. | 0,09 | 10,51 | 20,09 | 14,00 | 0,2897 | 0,0059 | |||
| FTAI / FTAI Aviation Ltd. | 0,17 | 18,81 | 20,03 | 23,10 | 0,2889 | 0,0268 | |||
| MTDR / Matador Resources Company | 0,39 | -0,20 | 18,55 | -6,78 | 0,2674 | -0,0530 | |||
| GLBE / Global-E Online Ltd. | 0,55 | -1,28 | 18,48 | -7,12 | 0,2665 | -0,0539 | |||
| XYZ / Block, Inc. | 0,26 | 1,42 | 18,00 | 26,81 | 0,2595 | 0,0310 | |||
| XENE / Xenon Pharmaceuticals Inc. | 0,57 | -23,38 | 17,88 | -28,52 | 0,2578 | -0,1450 | |||
| GRDN / Guardian Pharmacy Services, Inc. | 0,81 | 17,35 | 0,2502 | 0,2502 | |||||
| KRMN / Karman Holdings Inc. | 0,34 | -24,80 | 16,88 | 13,34 | 0,2434 | 0,0036 | |||
| CRS / Carpenter Technology Corporation | 0,06 | 16,75 | 0,2416 | 0,2416 | |||||
| INR / Infinity Natural Resources, Inc. | 0,88 | 2,38 | 16,18 | -0,02 | 0,2333 | -0,0273 | |||
| NAMS / NewAmsterdam Pharma Company N.V. | 0,87 | -2,08 | 15,80 | -13,37 | 0,2279 | -0,0659 | |||
| KRYS / Krystal Biotech, Inc. | 0,11 | -19,68 | 15,70 | -38,76 | 0,2264 | -0,1865 | |||
| MGY / Magnolia Oil & Gas Corporation | 0,69 | 1,86 | 15,56 | -9,35 | 0,2243 | -0,0520 | |||
| CBLL / CeriBell, Inc. | 0,80 | 48,45 | 14,93 | 44,74 | 0,2152 | 0,0492 | |||
| BRZE / Braze, Inc. | 0,50 | 14,07 | 0,2029 | 0,2029 | |||||
| MVBF / MVB Financial Corp. | 0,59 | -23,36 | 13,40 | -0,31 | 0,1932 | -0,0232 | |||
| CGON / CG Oncology, Inc. | 0,51 | -0,98 | 13,32 | 5,13 | 0,1920 | -0,0120 | |||
| NVMI / Nova Ltd. | 0,05 | 1,82 | 13,25 | 52,01 | 0,1910 | 0,0507 | |||
| MRUS / Merus N.V. | 0,24 | -29,39 | 12,77 | -11,76 | 0,1841 | -0,0489 | |||
| PRSU / Pursuit Attractions and Hospitality, Inc. | 0,44 | 3,16 | 12,68 | -15,96 | 0,1828 | -0,0601 | |||
| FRPT / Freshpet, Inc. | 0,18 | 26,46 | 12,19 | 3,33 | 0,1757 | -0,0142 | |||
| ONTO / Onto Innovation Inc. | 0,12 | -30,05 | 12,06 | -41,82 | 0,1739 | -0,1599 | |||
| WHD / Cactus, Inc. | 0,26 | -23,46 | 11,49 | -26,99 | 0,1657 | -0,0877 | |||
| IRTC / iRhythm Technologies, Inc. | 0,07 | 11,03 | 0,1591 | 0,1591 | |||||
| ASGN / ASGN Incorporated | 0,21 | 2,11 | 10,36 | -19,10 | 0,1494 | -0,0568 | |||
| ARCO / Arcos Dorados Holdings Inc. | 0,87 | -20,37 | 6,89 | -22,05 | 0,0994 | -0,0430 | |||
| SITM / SiTime Corporation | 0,02 | 5,05 | 0,0729 | 0,0729 | |||||
| CLH / Clean Harbors, Inc. | 0,01 | -29,99 | 1,57 | -17,85 | 0,0226 | -0,0081 | |||
| WBS / Webster Financial Corporation | 0,02 | -68,01 | 1,23 | -66,12 | 0,0178 | -0,0409 | |||
| JAMES HARDIE INDS PLC / SPONSORED ADR (47030M106) | 0,00 | 0,01 | 0,0000 | ||||||
| WCC / WESCO International, Inc. | 0,00 | -99,72 | 0,01 | -99,70 | 0,0001 | -0,0269 | |||
| ALAB / Astera Labs, Inc. | 0,00 | -99,71 | 0,01 | -99,59 | 0,0001 | -0,0196 | |||
| MAX / MediaAlpha, Inc. | 0,00 | -100,00 | 0,00 | 0,0000 | |||||
| PAX / Patria Investments Limited | 0,00 | -100,00 | 0,00 | 0,0000 | |||||
| SYNA / Synaptics Incorporated | 0,00 | -100,00 | 0,00 | 0,0000 | |||||
| BC / Brunswick Corporation | 0,00 | -100,00 | 0,00 | 0,0000 | |||||
| ROK / Rockwell Automation, Inc. | 0,00 | -100,00 | 0,00 | 0,0000 | |||||
| IAS / Integral Ad Science Holding Corp. | 0,00 | -100,00 | 0,00 | 0,0000 | |||||
| VTEX / VTEX | 0,00 | -100,00 | 0,00 | 0,0000 | |||||
| PCVX / Vaxcyte, Inc. | 0,00 | -100,00 | 0,00 | 0,0000 | |||||
| KLIC / Kulicke and Soffa Industries, Inc. | 0,00 | -100,00 | 0,00 | 0,0000 | |||||
| JKHY / Jack Henry & Associates, Inc. | 0,00 | -100,00 | 0,00 | 0,0000 |