Statistiques de base
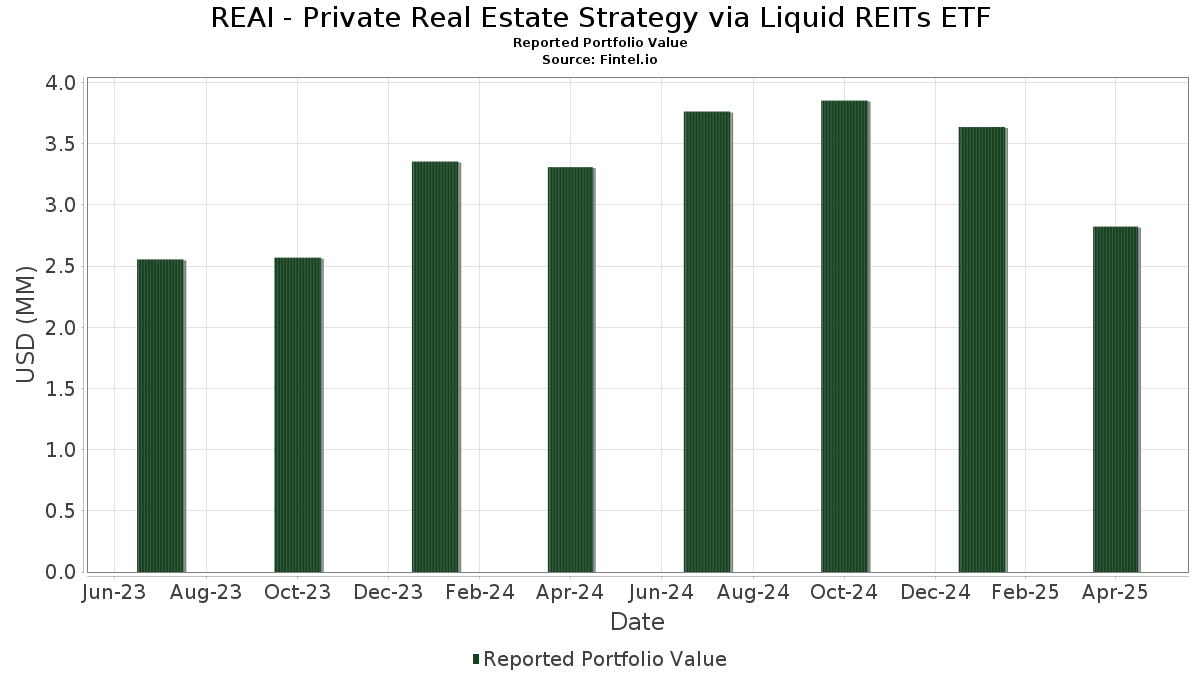
| Valeur du portefeuille | $ 2 822 901 |
| Positions actuelles | 63 |
Dernières positions, performances, ASG (à partir des dépôts 13F, 13D)
REAI - Private Real Estate Strategy via Liquid REITs ETF a déclaré un total de 63 positions dans ses derniers dépôts auprès de la SEC. La valeur la plus récente du portefeuille est calculée à 2 822 901 USD. Les actifs sous gestion réels (ASG) sont cette valeur plus les liquidités (qui ne sont pas divulguées). Les principales positions de REAI - Private Real Estate Strategy via Liquid REITs ETF sont Ventas, Inc. (US:VTR) , Mid-America Apartment Communities, Inc. (US:MAA) , Community Healthcare Trust Incorporated (US:CHCT) , American Tower Corporation (US:AMT) , and EPR Properties (US:EPR) .
Meilleures augmentations ce trimestre
Nous utilisons la variation de l'allocation du portefeuille car il s'agit de l'indicateur le plus significatif. Les changements peuvent être dus à des transactions ou à des variations de prix des actions.
| Titre | Actions (en millions) |
Valeur ($ en millions) |
% du portefeuille | ΔPortefeuille % |
|---|---|---|---|---|
| 0,00 | 0,05 | 1,9230 | 0,4947 | |
| 0,00 | 0,06 | 2,0913 | 0,4590 | |
| 0,00 | 0,05 | 1,7896 | 0,4228 | |
| 0,00 | 0,05 | 1,7947 | 0,3327 | |
| 0,00 | 0,05 | 1,8857 | 0,3301 | |
| 0,00 | 0,05 | 1,9201 | 0,3009 | |
| 0,00 | 0,05 | 1,8514 | 0,2817 | |
| 0,00 | 0,05 | 1,6805 | 0,2814 | |
| 0,00 | 0,05 | 1,9385 | 0,2611 | |
| 0,00 | 0,05 | 1,8302 | 0,2576 |
Principales baisses ce trimestre
Nous utilisons la variation de l'allocation du portefeuille car il s'agit de l'indicateur le plus significatif. Les changements peuvent être dus à des transactions ou à des variations de prix des actions.
| Titre | Actions (en millions) |
Valeur ($ en millions) |
% du portefeuille | ΔPortefeuille % |
|---|---|---|---|---|
| 0,00 | 0,05 | 1,6566 | -0,4542 | |
| 0,00 | 0,04 | 1,5008 | -0,4256 | |
| 0,01 | 0,03 | 1,1132 | -0,3778 | |
| 0,03 | 0,01 | 0,3743 | -0,3770 | |
| 0,00 | 0,03 | 1,1669 | -0,3599 | |
| 0,00 | 0,04 | 1,3285 | -0,3568 | |
| 0,01 | 0,04 | 1,2919 | -0,3303 | |
| 0,01 | 0,02 | 0,7153 | -0,3105 | |
| 0,00 | 0,05 | 1,7073 | -0,3092 | |
| 0,00 | 0,04 | 1,4643 | -0,2963 |
Déclarations 13F et dépôts de fonds
Ce formulaire a été déposé le 2025-06-26 pour la période de déclaration 2025-04-30. Cliquez sur l'icône du lien pour voir l'historique complet des transactions.
Mettre à niveau pour débloquer les données premium et exporter vers Excel ![]() .
.
| Titre | Type | Prix moyen de l'action | Actions (en millions) |
ΔActions (%) |
ΔActions (%) |
Valeur ($ en millions) |
Portefeuille (%) |
ΔPortefeuille (%) |
|
|---|---|---|---|---|---|---|---|---|---|
| VTR / Ventas, Inc. | 0,00 | -14,24 | 0,06 | 0,00 | 2,0913 | 0,4590 | |||
| MAA / Mid-America Apartment Communities, Inc. | 0,00 | -14,25 | 0,05 | -11,48 | 1,9385 | 0,2611 | |||
| CHCT / Community Healthcare Trust Incorporated | 0,00 | -14,28 | 0,05 | -27,03 | 1,9348 | -0,0997 | |||
| AMT / American Tower Corporation | 0,00 | -14,23 | 0,05 | 5,88 | 1,9230 | 0,4947 | |||
| EPR / EPR Properties | 0,00 | -14,24 | 0,05 | -6,90 | 1,9201 | 0,3009 | |||
| FGXXX / First American Funds Inc - First American Government Obligations Fund Class X | 0,05 | -32,03 | 0,05 | -32,05 | 1,8955 | -0,2695 | |||
| INVH / Invitation Homes Inc. | 0,00 | -14,25 | 0,05 | -5,36 | 1,8857 | 0,3301 | |||
| LTC / LTC Properties, Inc. | 0,00 | -14,27 | 0,05 | -10,17 | 1,8767 | 0,2468 | |||
| EQIX / Equinix, Inc. | 0,00 | -14,08 | 0,05 | -18,75 | 1,8587 | 0,0758 | |||
| SBRA / Sabra Health Care REIT, Inc. | 0,00 | -14,28 | 0,05 | -8,77 | 1,8514 | 0,2817 | |||
| OHI / Omega Healthcare Investors, Inc. | 0,00 | -14,25 | 0,05 | -10,53 | 1,8302 | 0,2576 | |||
| ESS / Essex Property Trust, Inc. | 0,00 | -13,95 | 0,05 | -16,39 | 1,8281 | 0,1466 | |||
| NHI / National Health Investors, Inc. | 0,00 | -14,21 | 0,05 | -5,66 | 1,7947 | 0,3327 | |||
| CCI / Crown Castle Inc. | 0,00 | -14,18 | 0,05 | 2,04 | 1,7896 | 0,4228 | |||
| UDR / UDR, Inc. | 0,00 | -14,23 | 0,05 | -13,79 | 1,7864 | 0,1747 | |||
| SUI / Sun Communities, Inc. | 0,00 | -14,19 | 0,05 | -15,25 | 1,7839 | 0,1429 | |||
| ELS / Equity LifeStyle Properties, Inc. | 0,00 | -14,27 | 0,05 | -15,25 | 1,7772 | 0,1511 | |||
| CPT / Camden Property Trust | 0,00 | -14,20 | 0,05 | -13,79 | 1,7765 | 0,1702 | |||
| FREVS / First Real Estate Investment Trust of New Jersey, Inc. | 0,00 | -14,27 | 0,05 | -15,25 | 1,7743 | 0,1438 | |||
| GLPI / Gaming and Leisure Properties, Inc. | 0,00 | -14,24 | 0,05 | -15,52 | 1,7552 | 0,1486 | |||
| SKT / Tanger Inc. | 0,00 | -14,28 | 0,05 | -18,64 | 1,7345 | 0,0982 | |||
| BRX / Brixmor Property Group Inc. | 0,00 | -14,28 | 0,05 | -18,64 | 1,7151 | 0,0900 | |||
| EGP / EastGroup Properties, Inc. | 0,00 | -14,20 | 0,05 | -17,24 | 1,7124 | 0,1040 | |||
| SPG / Simon Property Group, Inc. | 0,00 | -14,25 | 0,05 | -22,58 | 1,7103 | -0,0003 | |||
| UHT / Universal Health Realty Income Trust | 0,00 | -14,25 | 0,05 | -15,79 | 1,7097 | 0,1281 | |||
| CBL / CBL & Associates Properties, Inc. | 0,00 | -14,27 | 0,05 | -34,25 | 1,7073 | -0,3092 | |||
| OLP / One Liberty Properties, Inc. | 0,00 | -14,27 | 0,05 | -18,97 | 1,6869 | 0,0797 | |||
| ALX / Alexander's, Inc. | 0,00 | -14,18 | 0,05 | -6,00 | 1,6805 | 0,2814 | |||
| MRTI / Maxus Realty Trust, Inc. | 0,00 | -14,21 | 0,05 | -39,47 | 1,6566 | -0,4542 | |||
| STAG / STAG Industrial, Inc. | 0,00 | -14,23 | 0,05 | -17,86 | 1,6556 | 0,1047 | |||
| PSA / Public Storage | 0,00 | -13,97 | 0,05 | -13,21 | 1,6378 | 0,1694 | |||
| GOOD / Gladstone Commercial Corporation | 0,00 | -14,27 | 0,05 | -24,59 | 1,6376 | -0,0638 | |||
| NXRT / NexPoint Residential Trust, Inc. | 0,00 | -14,25 | 0,05 | -19,30 | 1,6364 | 0,0674 | |||
| FR / First Industrial Realty Trust, Inc. | 0,00 | -14,25 | 0,05 | -23,33 | 1,6321 | -0,0260 | |||
| NNN / NNN REIT, Inc. | 0,00 | -14,29 | 0,05 | -10,00 | 1,6066 | 0,2122 | |||
| LAMR / Lamar Advertising Company | 0,00 | -14,13 | 0,04 | -24,14 | 1,5914 | -0,0069 | |||
| UE / Urban Edge Properties | 0,00 | -14,27 | 0,04 | -24,14 | 1,5877 | -0,0307 | |||
| HIW / Highwoods Properties, Inc. | 0,00 | -14,28 | 0,04 | -18,52 | 1,5776 | 0,0809 | |||
| FRT / Federal Realty Investment Trust | 0,00 | -14,16 | 0,04 | -25,42 | 1,5743 | -0,0708 | |||
| OFC / Corporate Office Properties Trust | 0,00 | -14,29 | 0,04 | -24,14 | 1,5694 | -0,0335 | |||
| DOC / Healthpeak Properties, Inc. | 0,00 | -14,28 | 0,04 | -25,86 | 1,5359 | -0,0750 | |||
| DRH / DiamondRock Hospitality Company | 0,01 | -14,29 | 0,04 | -28,33 | 1,5356 | -0,1282 | |||
| KRC / Kilroy Realty Corporation | 0,00 | -14,28 | 0,04 | -30,65 | 1,5270 | -0,1856 | |||
| CUBE / CubeSmart | 0,00 | -14,22 | 0,04 | -17,65 | 1,5203 | 0,1095 | |||
| BFS / Saul Centers, Inc. | 0,00 | -14,25 | 0,04 | -23,64 | 1,5118 | -0,0169 | |||
| MAC / The Macerich Company | 0,00 | -14,26 | 0,04 | -40,00 | 1,5008 | -0,4256 | |||
| HST / Host Hotels & Resorts, Inc. | 0,00 | -14,29 | 0,04 | -28,07 | 1,4755 | -0,1062 | |||
| DEI / Douglas Emmett, Inc. | 0,00 | -14,27 | 0,04 | -35,94 | 1,4643 | -0,2963 | |||
| RHP / Ryman Hospitality Properties, Inc. | 0,00 | -14,23 | 0,04 | -28,07 | 1,4633 | -0,1157 | |||
| SLG / SL Green Realty Corp. | 0,00 | -14,29 | 0,04 | -33,33 | 1,4415 | -0,2310 | |||
| APLE / Apple Hospitality REIT, Inc. | 0,00 | -14,28 | 0,04 | -35,48 | 1,4404 | -0,2711 | |||
| BXP / Boston Properties, Inc. | 0,00 | -14,29 | 0,04 | -25,93 | 1,4348 | -0,0567 | |||
| IRM / Iron Mountain Incorporated | 0,00 | -14,15 | 0,04 | -23,53 | 1,3872 | -0,0337 | |||
| XHR / Xenia Hotels & Resorts, Inc. | 0,00 | -14,27 | 0,04 | -39,34 | 1,3285 | -0,3568 | |||
| PLYM / Plymouth Industrial REIT, Inc. | 0,00 | -14,26 | 0,04 | -24,49 | 1,3170 | -0,0303 | |||
| AAT / American Assets Trust, Inc. | 0,00 | -14,29 | 0,04 | -33,93 | 1,3128 | -0,2287 | |||
| BDN / Brandywine Realty Trust | 0,01 | -14,28 | 0,04 | -38,98 | 1,2919 | -0,3303 | |||
| ESRT / Empire State Realty Trust, Inc. | 0,00 | -14,29 | 0,03 | -35,85 | 1,2053 | -0,2606 | |||
| AHH / Armada Hoffler Properties, Inc. | 0,00 | -14,28 | 0,03 | -41,82 | 1,1669 | -0,3599 | |||
| PDM / Piedmont Realty Trust, Inc. | 0,01 | -14,27 | 0,03 | -42,59 | 1,1132 | -0,3778 | |||
| IIPR / Innovative Industrial Properties, Inc. | 0,00 | -14,26 | 0,02 | -36,36 | 0,7748 | -0,1511 | |||
| SVC / Service Properties Trust | 0,01 | -14,28 | 0,02 | -45,95 | 0,7153 | -0,3105 | |||
| OPI / Office Properties Income Trust | 0,03 | -14,29 | 0,01 | -62,96 | 0,3743 | -0,3770 |