Statistiques de base
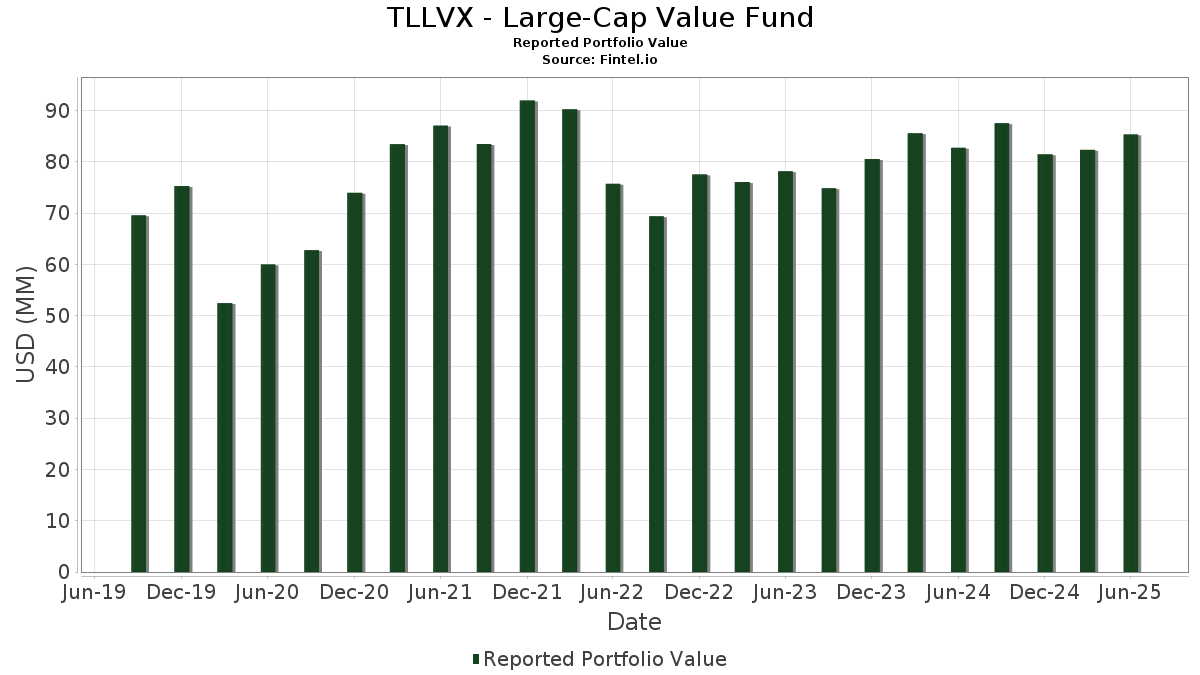
| Valeur du portefeuille | $ 85 304 393 |
| Positions actuelles | 79 |
Dernières positions, performances, ASG (à partir des dépôts 13F, 13D)
TLLVX - Large-Cap Value Fund a déclaré un total de 79 positions dans ses derniers dépôts auprès de la SEC. La valeur la plus récente du portefeuille est calculée à 85 304 393 USD. Les actifs sous gestion réels (ASG) sont cette valeur plus les liquidités (qui ne sont pas divulguées). Les principales positions de TLLVX - Large-Cap Value Fund sont JPMorgan Chase & Co. (US:JPM) , Alphabet Inc. (US:GOOG) , Berkshire Hathaway Inc. (US:BRK.B) , Bank of America Corporation (US:BAC) , and Wells Fargo & Company (US:WFC) . Les nouvelles positions de TLLVX - Large-Cap Value Fund incluent Amazon.com, Inc. (US:AMZN) , Simon Property Group, Inc. (US:SPG) , .
Meilleures augmentations ce trimestre
Nous utilisons la variation de l'allocation du portefeuille car il s'agit de l'indicateur le plus significatif. Les changements peuvent être dus à des transactions ou à des variations de prix des actions.
| Titre | Actions (en millions) |
Valeur ($ en millions) |
% du portefeuille | ΔPortefeuille % |
|---|---|---|---|---|
| 0,01 | 2,08 | 2,4375 | 1,6751 | |
| 0,01 | 1,27 | 1,4940 | 1,4940 | |
| 0,00 | 0,55 | 0,6469 | 0,6469 | |
| 0,01 | 0,98 | 1,1455 | 0,4513 | |
| 0,37 | 0,4339 | 0,4339 | ||
| 0,00 | 1,73 | 2,0255 | 0,4268 | |
| 0,00 | 1,58 | 1,8575 | 0,3491 | |
| 0,01 | 1,64 | 1,9183 | 0,2836 | |
| 0,01 | 3,56 | 4,1744 | 0,2647 | |
| 0,00 | 0,94 | 1,1075 | 0,2524 |
Principales baisses ce trimestre
Nous utilisons la variation de l'allocation du portefeuille car il s'agit de l'indicateur le plus significatif. Les changements peuvent être dus à des transactions ou à des variations de prix des actions.
| Titre | Actions (en millions) |
Valeur ($ en millions) |
% du portefeuille | ΔPortefeuille % |
|---|---|---|---|---|
| 0,00 | 1,42 | 1,6606 | -1,2669 | |
| 0,00 | 0,68 | 0,7950 | -0,9959 | |
| 0,02 | 1,73 | 2,0240 | -0,8605 | |
| 0,00 | 2,03 | 2,3795 | -0,5009 | |
| 0,01 | 0,90 | 1,0511 | -0,4206 | |
| 0,01 | 1,37 | 1,6016 | -0,4081 | |
| 0,00 | 0,97 | 1,1406 | -0,3602 | |
| 0,00 | 1,10 | 1,2932 | -0,3317 | |
| 0,01 | 1,70 | 1,9902 | -0,3101 | |
| 0,01 | 1,06 | 1,2430 | -0,2444 |
Déclarations 13F et dépôts de fonds
Ce formulaire a été déposé le 2025-08-27 pour la période de déclaration 2025-06-30. Cliquez sur l'icône du lien pour voir l'historique complet des transactions.
Mettre à niveau pour débloquer les données premium et exporter vers Excel ![]() .
.
| Titre | Type | Prix moyen de l'action | Actions (en millions) |
ΔActions (%) |
ΔActions (%) |
Valeur ($ en millions) |
Portefeuille (%) |
ΔPortefeuille (%) |
|
|---|---|---|---|---|---|---|---|---|---|
| JPM / JPMorgan Chase & Co. | 0,01 | -6,39 | 3,56 | 10,63 | 4,1744 | 0,2647 | |||
| GOOG / Alphabet Inc. | 0,01 | 191,76 | 2,08 | 231,58 | 2,4375 | 1,6751 | |||
| BRK.B / Berkshire Hathaway Inc. | 0,00 | -6,15 | 2,03 | -14,42 | 2,3795 | -0,5009 | |||
| BAC / Bank of America Corporation | 0,04 | -5,04 | 1,98 | 7,65 | 2,3259 | 0,0877 | |||
| WFC / Wells Fargo & Company | 0,02 | -6,51 | 1,92 | 4,35 | 2,2524 | 0,0156 | |||
| GS / The Goldman Sachs Group, Inc. | 0,00 | 1,33 | 1,73 | 31,23 | 2,0255 | 0,4268 | |||
| XOM / Exxon Mobil Corporation | 0,02 | -19,79 | 1,73 | -27,30 | 2,0240 | -0,8605 | |||
| JNJ / Johnson & Johnson | 0,01 | -2,67 | 1,70 | -10,35 | 1,9902 | -0,3101 | |||
| RTX / RTX Corporation | 0,01 | -5,60 | 1,68 | 4,03 | 1,9673 | 0,0084 | |||
| DIS / The Walt Disney Company | 0,01 | -3,23 | 1,64 | 21,64 | 1,9183 | 0,2836 | |||
| ABT / Abbott Laboratories | 0,01 | -2,53 | 1,59 | -0,06 | 1,8670 | -0,0687 | |||
| ETN / Eaton Corporation plc | 0,00 | -2,85 | 1,58 | 27,64 | 1,8575 | 0,3491 | |||
| LIN / Linde plc | 0,00 | -3,62 | 1,54 | -2,85 | 1,7999 | -0,1206 | |||
| PG / The Procter & Gamble Company | 0,01 | 13,08 | 1,50 | 5,77 | 1,7635 | 0,0350 | |||
| PH / Parker-Hannifin Corporation | 0,00 | 1,36 | 1,46 | 16,48 | 1,7075 | 0,1885 | |||
| BA / The Boeing Company | 0,01 | -2,93 | 1,45 | 19,33 | 1,7015 | 0,2232 | |||
| UNH / UnitedHealth Group Incorporated | 0,00 | -1,33 | 1,42 | -41,22 | 1,6606 | -1,2669 | |||
| AXP / American Express Company | 0,00 | 1,33 | 1,41 | 20,10 | 1,6541 | 0,2275 | |||
| WMT / Walmart Inc. | 0,01 | -25,86 | 1,37 | -17,47 | 1,6016 | -0,4081 | |||
| ICE / Intercontinental Exchange, Inc. | 0,01 | -1,63 | 1,32 | 4,60 | 1,5486 | 0,0150 | |||
| AMZN / Amazon.com, Inc. | 0,01 | 1,27 | 1,4940 | 1,4940 | |||||
| UNP / Union Pacific Corporation | 0,01 | 13,09 | 1,25 | 10,19 | 1,4707 | 0,0871 | |||
| ACN / Accenture plc | 0,00 | 1,27 | 1,21 | -2,96 | 1,4203 | -0,0967 | |||
| EMR / Emerson Electric Co. | 0,01 | 1,33 | 1,21 | 23,16 | 1,4163 | 0,2254 | |||
| AIG / American International Group, Inc. | 0,01 | -8,13 | 1,17 | -9,58 | 1,3739 | -0,2000 | |||
| BLK / BlackRock, Inc. | 0,00 | 1,37 | 1,17 | 12,33 | 1,3680 | 0,1066 | |||
| PM / Philip Morris International Inc. | 0,01 | -19,59 | 1,16 | -7,74 | 1,3564 | -0,1670 | |||
| DUK / Duke Energy Corporation | 0,01 | 1,32 | 1,15 | -2,05 | 1,3459 | -0,0767 | |||
| MMC / Marsh & McLennan Companies, Inc. | 0,01 | 1,31 | 1,15 | -9,26 | 1,3448 | -0,1903 | |||
| NVR / NVR, Inc. | 0,00 | 2,65 | 1,14 | 4,67 | 1,3422 | 0,0133 | |||
| TEL / TE Connectivity plc | 0,01 | -0,46 | 1,14 | 18,85 | 1,3315 | 0,1703 | |||
| CB / Chubb Limited | 0,00 | -14,04 | 1,10 | -17,58 | 1,2932 | -0,3317 | |||
| PLD / Prologis, Inc. | 0,01 | 1,34 | 1,08 | -4,76 | 1,2671 | -0,1106 | |||
| COP / ConocoPhillips | 0,01 | 1,33 | 1,06 | -13,40 | 1,2430 | -0,2444 | |||
| HCA / HCA Healthcare, Inc. | 0,00 | 1,32 | 1,03 | 12,36 | 1,2042 | 0,0935 | |||
| HD / The Home Depot, Inc. | 0,00 | 1,31 | 1,02 | 1,29 | 1,1933 | -0,0266 | |||
| DOV / Dover Corporation | 0,01 | 1,30 | 1,00 | 5,58 | 1,1758 | 0,0226 | |||
| CSCO / Cisco Systems, Inc. | 0,01 | 1,33 | 0,99 | 13,92 | 1,1618 | 0,1052 | |||
| CI / The Cigna Group | 0,00 | 1,29 | 0,99 | 1,75 | 1,1581 | -0,0209 | |||
| HON / Honeywell International Inc. | 0,00 | -7,77 | 0,98 | 1,45 | 1,1498 | -0,0248 | |||
| AMAT / Applied Materials, Inc. | 0,01 | 35,53 | 0,98 | 71,10 | 1,1455 | 0,4513 | |||
| TMUS / T-Mobile US, Inc. | 0,00 | -11,85 | 0,97 | -21,30 | 1,1406 | -0,3602 | |||
| PNC / The PNC Financial Services Group, Inc. | 0,01 | 1,31 | 0,97 | 7,45 | 1,1326 | 0,0404 | |||
| VLO / Valero Energy Corporation | 0,01 | -2,23 | 0,95 | -0,52 | 1,1171 | -0,0461 | |||
| HLT / Hilton Worldwide Holdings Inc. | 0,00 | -9,00 | 0,95 | 6,52 | 1,1114 | 0,0302 | |||
| MSFT / Microsoft Corporation | 0,00 | 1,28 | 0,94 | 34,28 | 1,1075 | 0,2524 | |||
| EOG / EOG Resources, Inc. | 0,01 | 1,32 | 0,93 | -5,49 | 1,0908 | -0,1052 | |||
| SCHW / The Charles Schwab Corporation | 0,01 | 1,32 | 0,90 | 18,17 | 1,0599 | 0,1300 | |||
| FI / Fiserv, Inc. | 0,01 | -5,21 | 0,90 | -26,01 | 1,0511 | -0,4206 | |||
| ELV / Elevance Health, Inc. | 0,00 | 1,32 | 0,89 | -9,42 | 1,0493 | -0,1507 | |||
| DHR / Danaher Corporation | 0,00 | 1,29 | 0,89 | -2,43 | 1,0383 | -0,0640 | |||
| ORLY / O'Reilly Automotive, Inc. | 0,01 | 1 635,30 | 0,87 | 9,14 | 1,0232 | 0,0521 | |||
| MET / MetLife, Inc. | 0,01 | 1,32 | 0,87 | 1,40 | 1,0221 | -0,0215 | |||
| ADI / Analog Devices, Inc. | 0,00 | 1,33 | 0,84 | 19,63 | 0,9795 | 0,1309 | |||
| NEE / NextEra Energy, Inc. | 0,01 | 1,32 | 0,82 | -0,72 | 0,9651 | -0,0428 | |||
| DD / DuPont de Nemours, Inc. | 0,01 | 1,33 | 0,81 | -6,94 | 0,9442 | -0,1070 | |||
| BKNG / Booking Holdings Inc. | 0,00 | 2,22 | 0,80 | 28,50 | 0,9367 | 0,1811 | |||
| AEP / American Electric Power Company, Inc. | 0,01 | 1,31 | 0,78 | -3,72 | 0,9112 | -0,0702 | |||
| MU / Micron Technology, Inc. | 0,01 | -2,63 | 0,78 | 38,15 | 0,9089 | 0,2270 | |||
| MDLZ / Mondelez International, Inc. | 0,01 | 1,32 | 0,77 | 0,66 | 0,8988 | -0,0259 | |||
| AEE / Ameren Corporation | 0,01 | 1,33 | 0,77 | -3,04 | 0,8976 | -0,0619 | |||
| NXPI / NXP Semiconductors N.V. | 0,00 | 1,31 | 0,74 | 16,46 | 0,8715 | 0,0962 | |||
| SW / Smurfit Westrock Plc | 0,02 | 9,46 | 0,73 | 4,86 | 0,8612 | 0,0099 | |||
| CVX / Chevron Corporation | 0,01 | 50,88 | 0,72 | 29,11 | 0,8483 | 0,1677 | |||
| DE / Deere & Company | 0,00 | -0,50 | 0,71 | 7,90 | 0,8329 | 0,0323 | |||
| AVGO / Broadcom Inc. | 0,00 | -14,15 | 0,70 | 41,38 | 0,8173 | 0,2181 | |||
| ABBV / AbbVie Inc. | 0,00 | -48,08 | 0,68 | -54,00 | 0,7950 | -0,9959 | |||
| LRCX / Lam Research Corporation | 0,01 | 10,95 | 0,66 | 48,55 | 0,7796 | 0,2358 | |||
| SNY / Sanofi - Depositary Receipt (Common Stock) | 0,01 | 1,33 | 0,64 | -11,69 | 0,7532 | -0,1310 | |||
| SPG / Simon Property Group, Inc. | 0,00 | 0,55 | 0,6469 | 0,6469 | |||||
| FITB / Fifth Third Bancorp | 0,01 | 1,33 | 0,55 | 6,23 | 0,6408 | 0,0163 | |||
| RS / Reliance, Inc. | 0,00 | 1,42 | 0,54 | 10,27 | 0,6304 | 0,0380 | |||
| MAS / Masco Corporation | 0,01 | 1,32 | 0,51 | -6,22 | 0,6017 | -0,0631 | |||
| KKR / KKR & Co. Inc. | 0,00 | 10,09 | 0,50 | 26,58 | 0,5872 | 0,1069 | |||
| TT / Trane Technologies plc | 0,00 | -24,05 | 0,43 | -1,38 | 0,5021 | -0,0255 | |||
| CMCSA / Comcast Corporation | 0,01 | 1,34 | 0,37 | -2,11 | 0,4369 | -0,0250 | |||
| BK / The Bank of New York Mellon Corporation - Depositary Receipt (Common Stock) | 0,37 | 0,4339 | 0,4339 | ||||||
| FDX / FedEx Corporation | 0,00 | 1,40 | 0,36 | -5,47 | 0,4259 | -0,0408 | |||
| ORCL / Oracle Corporation | 0,00 | -63,65 | 0,21 | -43,39 | 0,2520 | -0,2073 |