Statistiques de base
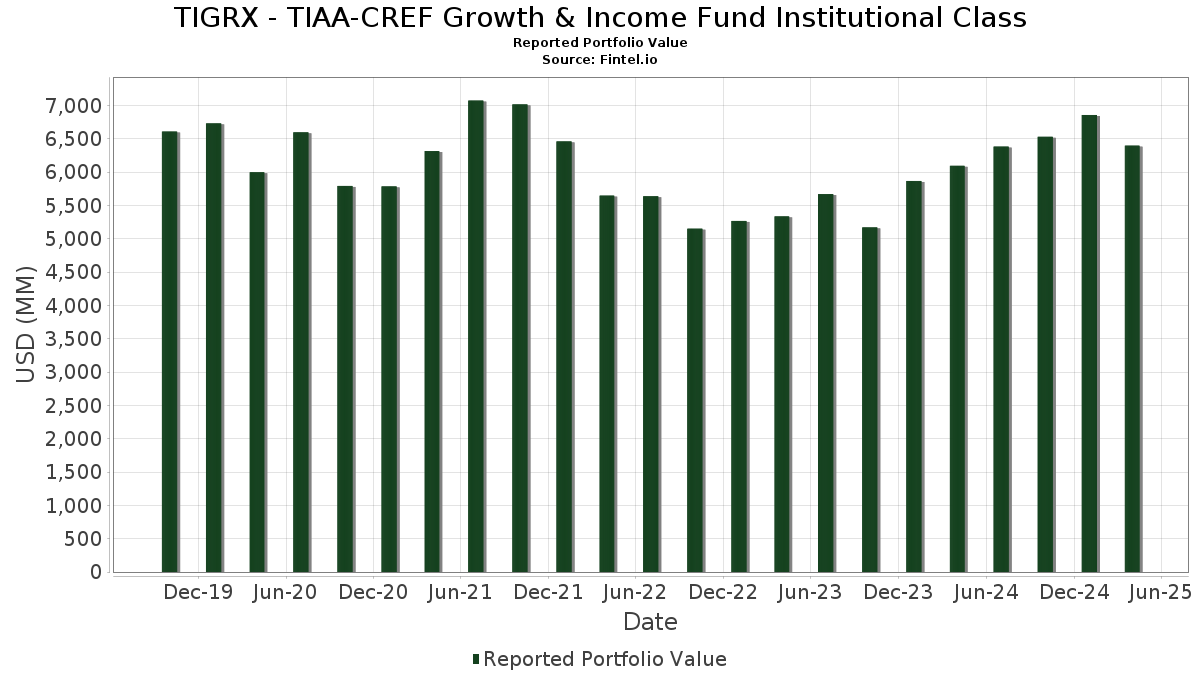
| Valeur du portefeuille | $ 6 396 169 333 |
| Positions actuelles | 65 |
Dernières positions, performances, ASG (à partir des dépôts 13F, 13D)
TIGRX - TIAA-CREF Growth & Income Fund Institutional Class a déclaré un total de 65 positions dans ses derniers dépôts auprès de la SEC. La valeur la plus récente du portefeuille est calculée à 6 396 169 333 USD. Les actifs sous gestion réels (ASG) sont cette valeur plus les liquidités (qui ne sont pas divulguées). Les principales positions de TIGRX - TIAA-CREF Growth & Income Fund Institutional Class sont Microsoft Corporation (US:MSFT) , Apple Inc. (US:AAPL) , NVIDIA Corporation (US:NVDA) , Walmart Inc. (US:WMT) , and Amazon.com, Inc. (US:AMZN) . Les nouvelles positions de TIGRX - TIAA-CREF Growth & Income Fund Institutional Class incluent Altria Group, Inc. (US:MO) , Foothills Exploration, Inc. (US:FTXP) , Molson Coors Beverage Company (US:TAP) , Parker-Hannifin Corporation (US:PH) , and Veeva Systems Inc. (US:VEEV) .
Meilleures augmentations ce trimestre
Nous utilisons la variation de l'allocation du portefeuille car il s'agit de l'indicateur le plus significatif. Les changements peuvent être dus à des transactions ou à des variations de prix des actions.
| Titre | Actions (en millions) |
Valeur ($ en millions) |
% du portefeuille | ΔPortefeuille % |
|---|---|---|---|---|
| 0,17 | 151,28 | 2,3651 | 2,3651 | |
| 0,28 | 149,34 | 2,3347 | 2,3347 | |
| 1,64 | 94,62 | 1,4793 | 1,4793 | |
| 1,09 | 88,52 | 1,3839 | 1,2788 | |
| 0,63 | 80,75 | 1,2624 | 1,2624 | |
| 0,41 | 119,59 | 1,8696 | 1,1502 | |
| 0,25 | 97,05 | 1,5173 | 1,0578 | |
| 1,21 | 131,44 | 2,0549 | 1,0198 | |
| 1,07 | 63,06 | 0,9859 | 0,9859 | |
| 0,66 | 130,59 | 2,0416 | 0,9734 |
Principales baisses ce trimestre
Nous utilisons la variation de l'allocation du portefeuille car il s'agit de l'indicateur le plus significatif. Les changements peuvent être dus à des transactions ou à des variations de prix des actions.
| Titre | Actions (en millions) |
Valeur ($ en millions) |
% du portefeuille | ΔPortefeuille % |
|---|---|---|---|---|
| 0,01 | 0,72 | 0,0113 | -1,6986 | |
| 1,20 | 220,81 | 3,4521 | -1,6387 | |
| 0,00 | 0,00 | -1,1278 | ||
| 1,14 | 80,92 | 1,2651 | -1,0686 | |
| 0,00 | 0,00 | -1,0558 | ||
| 0,10 | 48,98 | 0,7657 | -1,0191 | |
| 0,27 | 97,53 | 1,5247 | -0,9479 | |
| 1,70 | 136,44 | 2,1331 | -0,8409 | |
| 0,14 | 57,47 | 0,8985 | -0,8045 | |
| 0,19 | 35,80 | 0,5596 | -0,8017 |
Déclarations 13F et dépôts de fonds
Ce formulaire a été déposé le 2025-06-26 pour la période de déclaration 2025-04-30. Cliquez sur l'icône du lien pour voir l'historique complet des transactions.
Mettre à niveau pour débloquer les données premium et exporter vers Excel ![]() .
.
| Titre | Type | Prix moyen de l'action | Actions (en millions) |
ΔActions (%) |
ΔActions (%) |
Valeur ($ en millions) |
Portefeuille (%) |
ΔPortefeuille (%) |
|
|---|---|---|---|---|---|---|---|---|---|
| MSFT / Microsoft Corporation | 1,23 | 10,13 | 487,57 | 4,88 | 7,6225 | 0,8426 | |||
| AAPL / Apple Inc. | 1,94 | 9,45 | 413,06 | -1,45 | 6,4576 | 0,3451 | |||
| NVDA / NVIDIA Corporation | 3,61 | -2,58 | 393,02 | -11,63 | 6,1444 | -0,3415 | |||
| WMT / Walmart Inc. | 2,40 | 4,67 | 233,56 | 3,70 | 3,6514 | 0,3667 | |||
| AMZN / Amazon.com, Inc. | 1,20 | -18,47 | 220,81 | -36,74 | 3,4521 | -1,6387 | |||
| META / Meta Platforms, Inc. | 0,40 | 2,79 | 220,36 | -18,12 | 3,4450 | -0,4798 | |||
| AVGO / Broadcom Inc. | 1,00 | 4,67 | 191,55 | -8,95 | 2,9947 | -0,0737 | |||
| LLY / Eli Lilly and Company | 0,17 | 151,28 | 2,3651 | 2,3651 | |||||
| BRK.B / Berkshire Hathaway Inc. | 0,28 | 149,34 | 2,3347 | 2,3347 | |||||
| GOOGL / Alphabet Inc. | 0,88 | 8,15 | 140,06 | -15,82 | 2,1896 | -0,2368 | |||
| BK / The Bank of New York Mellon Corporation | 1,70 | -28,50 | 136,44 | -33,09 | 2,1331 | -0,8409 | |||
| AEP / American Electric Power Company, Inc. | 1,21 | 68,13 | 131,44 | 85,19 | 2,0549 | 1,0198 | |||
| ALL / The Allstate Corporation | 0,66 | 72,84 | 130,59 | 78,29 | 2,0416 | 0,9734 | |||
| ETN / Eaton Corporation plc | 0,41 | 64,36 | 119,59 | 222,41 | 1,8696 | 1,1502 | |||
| MA / Mastercard Incorporated | 0,22 | 4,67 | 118,78 | 3,28 | 1,8570 | 0,1797 | |||
| GOOG / Alphabet Inc. | 0,73 | 9,30 | 117,96 | -14,47 | 1,8442 | -0,1672 | |||
| HCA / HCA Healthcare, Inc. | 0,34 | 4,67 | 117,50 | 9,48 | 1,8369 | 0,2717 | |||
| SPG / Simon Property Group, Inc. | 0,68 | 58,77 | 106,44 | 43,72 | 1,6640 | 0,5839 | |||
| CI / The Cigna Group | 0,30 | 19,42 | 102,47 | 38,03 | 1,6019 | 0,5193 | |||
| V / Visa Inc. | 0,29 | -25,61 | 100,87 | -24,81 | 1,5770 | -0,3795 | |||
| HD / The Home Depot, Inc. | 0,27 | -34,26 | 97,53 | -42,48 | 1,5247 | -0,9479 | |||
| TT / Trane Technologies plc | 0,25 | 41,72 | 97,05 | 200,24 | 1,5173 | 1,0578 | |||
| CSCO / Cisco Systems, Inc. | 1,64 | 94,62 | 1,4793 | 1,4793 | |||||
| AON / Aon plc | 0,26 | 23,69 | 93,97 | 18,34 | 1,4690 | 0,3110 | |||
| COST / Costco Wholesale Corporation | 0,09 | -18,69 | 93,87 | -17,48 | 1,4675 | -0,1914 | |||
| URI / United Rentals, Inc. | 0,15 | -10,03 | 92,64 | -25,05 | 1,4483 | -0,3544 | |||
| UBER / Uber Technologies, Inc. | 1,09 | 540,90 | 88,52 | 1 094,80 | 1,3839 | 1,2788 | |||
| BSX / Boston Scientific Corporation | 0,86 | -41,22 | 88,17 | -40,92 | 1,3784 | -0,7982 | |||
| MRK / Merck & Co., Inc. | 1,00 | -27,45 | 85,05 | -37,45 | 1,3296 | -0,6533 | |||
| JNJ / Johnson & Johnson | 0,54 | 58,76 | 84,85 | 42,64 | 1,3265 | 0,1729 | |||
| LNT / Alliant Energy Corporation | 1,39 | 28,61 | 84,83 | 33,33 | 1,3262 | 0,3983 | |||
| LIN / Linde plc | 0,19 | -3,77 | 84,67 | -2,23 | 1,3237 | 0,0607 | |||
| GEN / Gen Digital Inc. | 3,15 | 73,11 | 81,49 | 66,42 | 1,2740 | 0,5598 | |||
| WFC / Wells Fargo & Company | 1,14 | -51,46 | 80,92 | -46,90 | 1,2651 | -1,0686 | |||
| TJX / The TJX Companies, Inc. | 0,63 | 80,75 | 1,2624 | 1,2624 | |||||
| RCL / Royal Caribbean Cruises Ltd. | 0,33 | -15,49 | 70,79 | -31,87 | 1,1068 | -0,4087 | |||
| C / Citigroup Inc. | 1,03 | -32,23 | 70,30 | -43,09 | 1,0990 | -0,7025 | |||
| QCOM / QUALCOMM Incorporated | 0,46 | -26,52 | 68,61 | -32,98 | 1,0726 | -0,4950 | |||
| SPGI / S&P Global Inc. | 0,14 | 154,95 | 68,21 | 296,85 | 1,0664 | 0,7331 | |||
| MO / Altria Group, Inc. | 1,07 | 63,06 | 0,9859 | 0,9859 | |||||
| FTXP / Foothills Exploration, Inc. | 0,09 | 60,94 | 0,9527 | 0,9527 | |||||
| ACGL / Arch Capital Group Ltd. | 0,67 | -34,04 | 60,69 | -35,74 | 0,9489 | -0,4285 | |||
| ELV / Elevance Health, Inc. | 0,14 | 59,10 | 0,9239 | 0,9239 | |||||
| TAP / Molson Coors Beverage Company | 1,00 | 57,76 | 0,9030 | 0,9030 | |||||
| UNH / UnitedHealth Group Incorporated | 0,14 | -35,11 | 57,47 | -50,78 | 0,8985 | -0,8045 | |||
| CVX / Chevron Corporation | 0,42 | -30,93 | 57,07 | -37,01 | 0,8923 | -0,4292 | |||
| BMY / Bristol-Myers Squibb Company | 1,04 | -36,57 | 51,96 | -27,54 | 0,8124 | -0,3639 | |||
| PH / Parker-Hannifin Corporation | 0,08 | 50,46 | 0,7888 | 0,7888 | |||||
| LRCX / Lam Research Corporation | 0,69 | -18,05 | 49,25 | -21,00 | 0,7700 | -0,1847 | |||
| AMP / Ameriprise Financial, Inc. | 0,10 | -53,83 | 48,98 | -59,98 | 0,7657 | -1,0191 | |||
| VEEV / Veeva Systems Inc. | 0,20 | 46,43 | 0,7259 | 0,7259 | |||||
| CNC / Centene Corporation | 0,77 | 69,86 | 46,27 | 9,35 | 0,7233 | -0,0295 | |||
| MOH / Molina Healthcare, Inc. | 0,13 | 42,67 | 0,6671 | 0,6671 | |||||
| VLO / Valero Energy Corporation | 0,37 | -40,39 | 42,54 | -47,97 | 0,6650 | -0,5273 | |||
| EW / Edwards Lifesciences Corporation | 0,55 | 41,69 | 0,6518 | 0,6518 | |||||
| FI / Fiserv, Inc. | 0,19 | -55,11 | 35,80 | -61,65 | 0,5596 | -0,8017 | |||
| CAG / Conagra Brands, Inc. | 1,20 | 29,61 | 0,4629 | 0,4629 | |||||
| INTC / Intel Corporation | 1,47 | 29,47 | 0,4607 | 0,4607 | |||||
| PHM / PulteGroup, Inc. | 0,25 | -55,04 | 25,63 | -59,47 | 0,4007 | -0,5216 | |||
| ISRG / Intuitive Surgical, Inc. | 0,05 | 25,62 | 0,4005 | 0,4005 | |||||
| BK / The Bank of New York Mellon Corporation - Depositary Receipt (Common Stock) | 13,48 | 0,2107 | 0,2107 | ||||||
| United States Treasury Bill / STIV (US912797PC51) | 5,00 | 0,0781 | 0,0781 | ||||||
| US313385GD27 / Federal Home Loan Bank (FHLB) | 4,98 | 0,0779 | 0,0779 | ||||||
| ANET / Arista Networks Inc | 0,01 | -99,14 | 0,72 | -99,38 | 0,0113 | -1,6986 | |||
| US8575093013 / State Street Navigator Securities Lending Government Money Market Portfolio | 0,00 | 0,00 | 0,00 | 0,0000 | 0,0000 | ||||
| GDDY / GoDaddy Inc. | 0,00 | -100,00 | 0,00 | -100,00 | -1,1278 | ||||
| APO / Apollo Global Management, Inc. | 0,00 | -100,00 | 0,00 | -100,00 | -1,0558 |