Statistiques de base
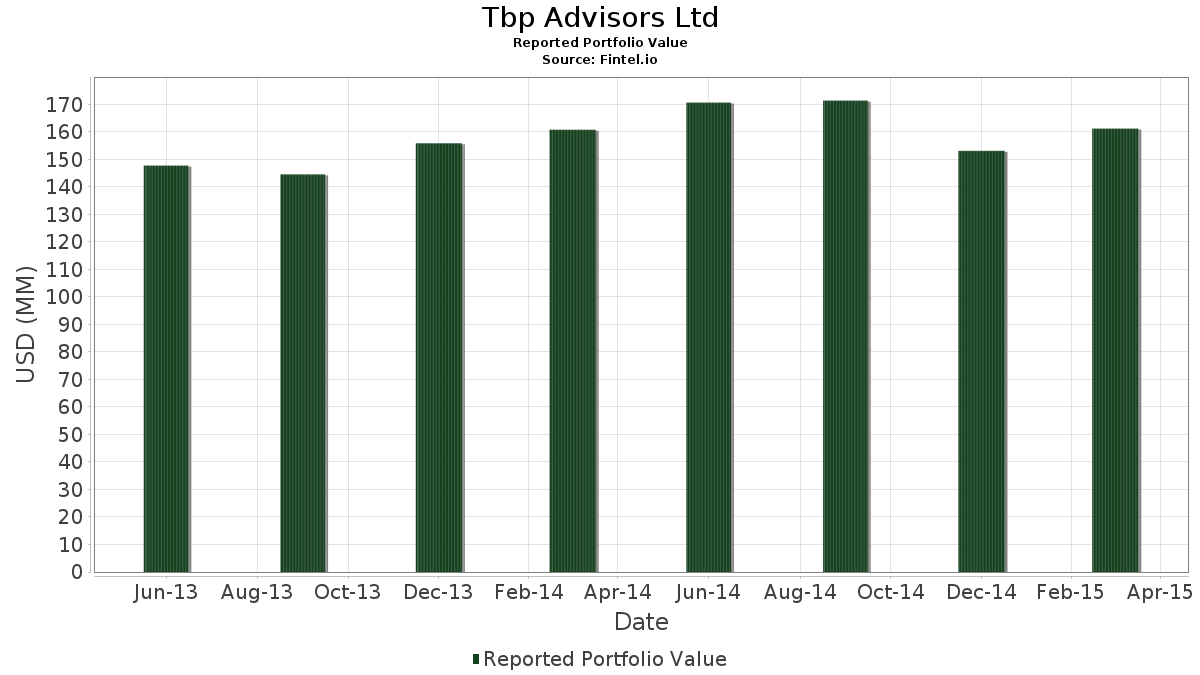
| Valeur du portefeuille | $ 161 156 000 |
| Positions actuelles | 48 |
Dernières positions, performances, ASG (à partir des dépôts 13F, 13D)
Tbp Advisors Ltd a déclaré un total de 48 positions dans ses derniers dépôts auprès de la SEC. La valeur la plus récente du portefeuille est calculée à 161 156 000 USD. Les actifs sous gestion réels (ASG) sont cette valeur plus les liquidités (qui ne sont pas divulguées). Les principales positions de Tbp Advisors Ltd sont Apple Inc. (US:AAPL) , Harman International Industries, Inc. (US:HAR) , Gilead Sciences, Inc. (US:GILD) , THOR Industries, Inc. (US:THO) , and Thermo Fisher Scientific Inc. (US:TMO) . Les nouvelles positions de Tbp Advisors Ltd incluent iShares, Inc. - iShares MSCI Germany ETF (US:EWG) , The Coca-Cola Company (US:KO) , .
Meilleures augmentations ce trimestre
Nous utilisons la variation de l'allocation du portefeuille car il s'agit de l'indicateur le plus significatif. Les changements peuvent être dus à des transactions ou à des variations de prix des actions.
| Titre | Actions (en millions) |
Valeur ($ en millions) |
% du portefeuille | ΔPortefeuille % |
|---|---|---|---|---|
| 0,09 | 6,76 | 4,1959 | 4,1959 | |
| 0,16 | 4,73 | 2,9363 | 2,9363 | |
| 0,15 | 3,34 | 2,0750 | 2,0750 | |
| 0,16 | 3,38 | 2,0992 | 1,6687 | |
| 0,08 | 10,73 | 6,6575 | 0,8724 | |
| 0,02 | 0,78 | 0,4834 | 0,4834 | |
| 0,11 | 7,22 | 4,4795 | 0,2994 | |
| 0,23 | 6,58 | 4,0855 | 0,2594 | |
| 0,00 | 0,26 | 0,1589 | 0,1589 | |
| 0,01 | 0,21 | 0,1322 | 0,1322 |
Principales baisses ce trimestre
Nous utilisons la variation de l'allocation du portefeuille car il s'agit de l'indicateur le plus significatif. Les changements peuvent être dus à des transactions ou à des variations de prix des actions.
| Titre | Actions (en millions) |
Valeur ($ en millions) |
% du portefeuille | ΔPortefeuille % |
|---|---|---|---|---|
| 0,07 | 1,92 | 1,1939 | -0,9932 | |
| 0,16 | 6,84 | 4,2419 | -0,8574 | |
| 0,05 | 4,49 | 2,7830 | -0,8529 | |
| 0,14 | 4,30 | 2,6657 | -0,6227 | |
| 0,17 | 4,25 | 2,6353 | -0,5897 | |
| 0,11 | 6,94 | 4,3051 | -0,3649 | |
| 0,03 | 6,45 | 4,0005 | -0,2750 | |
| 0,02 | 3,44 | 2,1321 | -0,2607 | |
| 0,07 | 5,65 | 3,5047 | -0,2463 | |
| 0,02 | 2,21 | 1,3738 | -0,1985 |
Déclarations 13F et dépôts de fonds
Ce formulaire a été déposé le 2015-04-17 pour la période de déclaration 2015-03-31. Cliquez sur l'icône du lien pour voir l'historique complet des transactions.
Mettre à niveau pour débloquer les données premium et exporter vers Excel ![]() .
.
| Titre | Type | Prix moyen de l'action | Actions (en millions) |
ΔActions (%) |
ΔActions (%) |
Valeur ($ en millions) |
Portefeuille (%) |
ΔPortefeuille (%) |
|
|---|---|---|---|---|---|---|---|---|---|
| AAPL / Apple Inc. | 0,09 | -5,15 | 10,94 | 6,92 | 6,7872 | 0,1045 | |||
| HAR / Harman International Industries, Inc. | 0,08 | -3,26 | 10,73 | 21,15 | 6,6575 | 0,8724 | |||
| GILD / Gilead Sciences, Inc. | 0,08 | -0,47 | 7,68 | 3,62 | 4,7649 | -0,0762 | |||
| THO / THOR Industries, Inc. | 0,11 | -0,29 | 7,22 | 12,81 | 4,4795 | 0,2994 | |||
| TMO / Thermo Fisher Scientific Inc. | 0,05 | -0,37 | 7,16 | 6,82 | 4,4410 | 0,0643 | |||
| JPM / JPMorgan Chase & Co. | 0,11 | 0,25 | 6,94 | -2,95 | 4,3051 | -0,3649 | |||
| ORCL / Oracle Corporation | 0,16 | -8,74 | 6,84 | -12,43 | 4,2419 | -0,8574 | |||
| SAVE / Spirit Airlines, Inc. | 0,09 | 0,25 | 6,76 | 2,63 | 4,1959 | 4,1959 | |||
| DHI / D.R. Horton, Inc. | 0,23 | -0,17 | 6,58 | 12,41 | 4,0855 | 0,2594 | |||
| GS / The Goldman Sachs Group, Inc. | 0,03 | 1,57 | 6,45 | -1,50 | 4,0005 | -0,2750 | |||
| US0325111070 / Anadarko Petroleum Corp. | 0,07 | 0,24 | 5,89 | 0,61 | 3,6579 | -0,1694 | |||
| SLB / Schlumberger Limited | 0,07 | 0,68 | 5,65 | -1,64 | 3,5047 | -0,2463 | |||
| NKE / NIKE, Inc. | 0,05 | -1,11 | 5,39 | 3,20 | 3,3427 | -0,0672 | |||
| EWG / iShares, Inc. - iShares MSCI Germany ETF | 0,16 | 4,73 | 2,9363 | 2,9363 | |||||
| US92220P1057 / Varian Medical Systems, Inc. | 0,05 | -25,91 | 4,49 | -19,42 | 2,7830 | -0,8529 | |||
| GMF / SPDR Index Shares Funds - SPDR S&P Emerging Asia Pacific ETF | 0,05 | 0,42 | 4,38 | 5,97 | 2,7210 | 0,0178 | |||
| FLR / Fluor Corporation | 0,08 | 3,97 | 4,31 | -1,98 | 2,6738 | -0,1979 | |||
| INTC / Intel Corporation | 0,14 | -0,95 | 4,30 | -14,66 | 2,6657 | -0,6227 | |||
| EMC / Global X Funds - Global X Emerging Markets Great Consumer ETF | 0,17 | 0,08 | 4,25 | -13,98 | 2,6353 | -0,5897 | |||
| PII / Polaris Inc. | 0,02 | 0,56 | 3,44 | -6,20 | 2,1321 | -0,2607 | |||
| EOG / EOG Resources, Inc. | 0,04 | 0,49 | 3,41 | 0,09 | 2,1172 | -0,1097 | |||
| MLCO / Melco Resorts & Entertainment Limited - Depositary Receipt (Common Stock) | 0,16 | 507,42 | 3,38 | 413,35 | 2,0992 | 1,6687 | |||
| PIN / Invesco India Exchange-Traded Fund Trust - Invesco India ETF | 0,15 | -0,20 | 3,34 | 7,32 | 2,0750 | 2,0750 | |||
| ACN / Accenture plc | 0,03 | -0,86 | 3,24 | 4,01 | 2,0105 | -0,0244 | |||
| TPR / Tapestry, Inc. | 0,06 | 1,91 | 2,60 | 12,41 | 1,6133 | 0,1024 | |||
| HAL / Halliburton Company | 0,05 | -1,26 | 2,41 | 10,19 | 1,4961 | 0,0668 | |||
| 74005P104 / Praxair, Inc. | 0,02 | -1,29 | 2,21 | -8,02 | 1,3738 | -0,1985 | |||
| ROP / Roper Technologies, Inc. | 0,01 | -15,01 | 2,08 | -6,50 | 1,2938 | -0,1630 | |||
| QCOM / QUALCOMM Incorporated | 0,03 | 25,65 | 2,02 | 17,21 | 1,2553 | 0,1278 | |||
| CSCO / Cisco Systems, Inc. | 0,07 | -41,91 | 1,92 | -42,53 | 1,1939 | -0,9932 | |||
| LLTC / Linear Technology Corp. | 0,03 | 1,10 | 1,59 | 3,73 | 0,9848 | -0,0147 | |||
| IFN / The India Fund, Inc. | 0,04 | -4,53 | 1,16 | 4,59 | 0,7204 | -0,0047 | |||
| XOM / Exxon Mobil Corporation | 0,01 | 34,88 | 0,99 | 24,03 | 0,6118 | 0,0925 | |||
| REGN / Regeneron Pharmaceuticals, Inc. | 0,00 | 0,00 | 0,85 | 10,14 | 0,5256 | 0,0232 | |||
| DOW / Dow Inc. | 0,02 | 0,00 | 0,78 | 5,27 | 0,4834 | 0,4834 | |||
| PAYX / Paychex, Inc. | 0,01 | 3,33 | 0,71 | 10,97 | 0,4393 | 0,0226 | |||
| PG / The Procter & Gamble Company | 0,01 | 0,00 | 0,53 | -9,95 | 0,3258 | -0,0551 | |||
| IBM / International Business Machines Corporation | 0,00 | -17,88 | 0,52 | -17,83 | 0,3202 | -0,0901 | |||
| MRK / Merck & Co., Inc. | 0,01 | -5,33 | 0,52 | -4,27 | 0,3202 | -0,0319 | |||
| DIS / The Walt Disney Company | 0,00 | -10,67 | 0,44 | -0,45 | 0,2724 | -0,0157 | |||
| PEP / PepsiCo, Inc. | 0,00 | 0,00 | 0,40 | 1,26 | 0,2494 | -0,0099 | |||
| T / AT&T Inc. | 0,01 | -9,01 | 0,34 | -11,49 | 0,2104 | -0,0398 | |||
| MO / Altria Group, Inc. | 0,01 | 0,00 | 0,31 | 1,64 | 0,1924 | -0,0069 | |||
| GE / General Electric Company | 0,01 | -7,24 | 0,29 | -8,92 | 0,1775 | -0,0277 | |||
| COF / Capital One Financial Corporation | 0,00 | 0,00 | 0,28 | -4,42 | 0,1744 | -0,0177 | |||
| EMR / Emerson Electric Co. | 0,00 | 0,00 | 0,26 | -8,45 | 0,1613 | -0,0242 | |||
| ED / Consolidated Edison, Inc. | 0,00 | 0,00 | 0,26 | -7,58 | 0,1589 | 0,1589 | |||
| KO / The Coca-Cola Company | 0,01 | 0,21 | 0,1322 | 0,1322 | |||||
| MSFT / Microsoft Corporation | 0,00 | -100,00 | 0,00 | -100,00 | -0,1535 | ||||
| UNP / Union Pacific Corporation | 0,00 | -100,00 | 0,00 | -100,00 | 0,0000 |