Statistiques de base
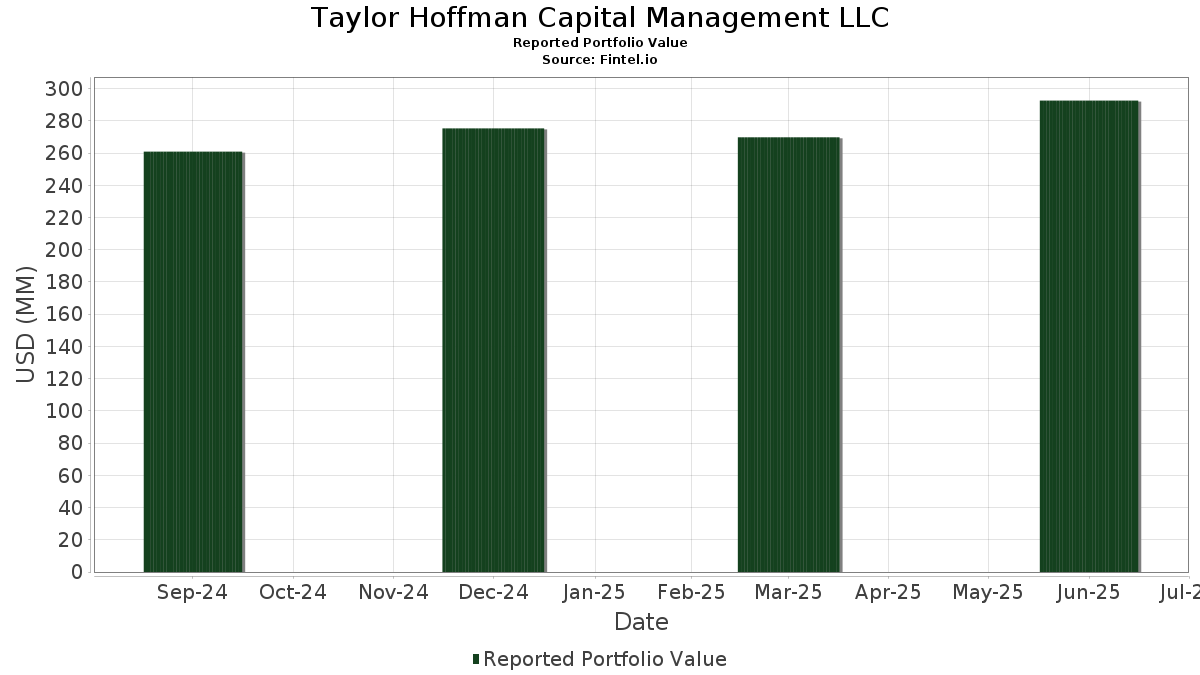
| Valeur du portefeuille | $ 292 582 062 |
| Positions actuelles | 119 |
Dernières positions, performances, ASG (à partir des dépôts 13F, 13D)
Taylor Hoffman Capital Management LLC a déclaré un total de 119 positions dans ses derniers dépôts auprès de la SEC. La valeur la plus récente du portefeuille est calculée à 292 582 062 USD. Les actifs sous gestion réels (ASG) sont cette valeur plus les liquidités (qui ne sont pas divulguées). Les principales positions de Taylor Hoffman Capital Management LLC sont Apple Inc. (US:AAPL) , Meta Platforms, Inc. (US:META) , Arista Networks Inc (US:ANET) , Fair Isaac Corporation (US:FICO) , and Lam Research Corporation (US:LRCX) . Les nouvelles positions de Taylor Hoffman Capital Management LLC incluent GE Vernova Inc. (US:GEV) , Cardinal Health, Inc. (US:CAH) , International Business Machines Corporation (US:IBM) , Invesco Exchange-Traded Fund Trust II - Invesco NASDAQ 100 ETF (US:QQQM) , and .
Meilleures augmentations ce trimestre
Nous utilisons la variation de l'allocation du portefeuille car il s'agit de l'indicateur le plus significatif. Les changements peuvent être dus à des transactions ou à des variations de prix des actions.
| Titre | Actions (en millions) |
Valeur ($ en millions) |
% du portefeuille | ΔPortefeuille % |
|---|---|---|---|---|
| 0,14 | 14,29 | 4,8828 | 0,8461 | |
| 0,02 | 14,98 | 5,1204 | 0,6861 | |
| 0,09 | 9,24 | 3,1588 | 0,6545 | |
| 0,05 | 8,69 | 2,9684 | 0,4919 | |
| 0,01 | 5,76 | 1,9678 | 0,2699 | |
| 0,07 | 6,22 | 2,1265 | 0,2156 | |
| 0,00 | 3,02 | 1,0305 | 0,1742 | |
| 0,04 | 7,20 | 2,4611 | 0,1678 | |
| 0,01 | 1,79 | 0,6102 | 0,1462 | |
| 0,04 | 7,23 | 2,4705 | 0,1443 |
Principales baisses ce trimestre
Nous utilisons la variation de l'allocation du portefeuille car il s'agit de l'indicateur le plus significatif. Les changements peuvent être dus à des transactions ou à des variations de prix des actions.
| Titre | Actions (en millions) |
Valeur ($ en millions) |
% du portefeuille | ΔPortefeuille % |
|---|---|---|---|---|
| 0,09 | 19,45 | 6,6487 | -1,2072 | |
| 0,01 | 9,55 | 3,2632 | -0,3450 | |
| 0,04 | 6,98 | 2,3861 | -0,3402 | |
| 0,02 | 6,89 | 2,3538 | -0,3347 | |
| 0,04 | 5,84 | 1,9948 | -0,2626 | |
| 0,04 | 3,53 | 1,2065 | -0,2330 | |
| 0,06 | 4,73 | 1,6177 | -0,2052 | |
| 0,00 | 0,68 | 0,2329 | -0,1906 | |
| 0,01 | 1,31 | 0,4464 | -0,1774 | |
| 0,01 | 1,00 | 0,3427 | -0,1718 |
Déclarations 13F et dépôts de fonds
Ce formulaire a été déposé le 2025-07-09 pour la période de déclaration 2025-06-30. Cliquez sur l'icône du lien pour voir l'historique complet des transactions.
Mettre à niveau pour débloquer les données premium et exporter vers Excel ![]() .
.
| Titre | Type | Prix moyen de l'action | Actions (en millions) |
ΔActions (%) |
ΔActions (%) |
Valeur ($ en millions) |
Portefeuille (%) |
ΔPortefeuille (%) |
|
|---|---|---|---|---|---|---|---|---|---|
| AAPL / Apple Inc. | 0,09 | -0,16 | 19,45 | -8,22 | 6,6487 | -1,2072 | |||
| META / Meta Platforms, Inc. | 0,02 | -0,58 | 14,98 | 25,23 | 5,1204 | 0,6861 | |||
| ANET / Arista Networks Inc | 0,14 | 0,64 | 14,29 | 31,18 | 4,8828 | 0,8461 | |||
| FICO / Fair Isaac Corporation | 0,01 | 0,25 | 9,55 | -1,92 | 3,2632 | -0,3450 | |||
| LRCX / Lam Research Corporation | 0,09 | 2,34 | 9,24 | 36,78 | 3,1588 | 0,6545 | |||
| AMAT / Applied Materials, Inc. | 0,05 | 3,42 | 8,69 | 30,00 | 2,9684 | 0,4919 | |||
| DE / Deere & Company | 0,02 | 1,21 | 8,62 | 7,56 | 2,9469 | -0,0241 | |||
| EBAY / eBay Inc. | 0,11 | 2,38 | 7,86 | 12,43 | 2,6866 | 0,0953 | |||
| CSCO / Cisco Systems, Inc. | 0,11 | 2,04 | 7,40 | 14,56 | 2,5287 | 0,1348 | |||
| GOOG / Alphabet Inc. | 0,04 | 2,65 | 7,23 | 15,19 | 2,4705 | 0,1443 | |||
| AWI / Armstrong World Industries, Inc. | 0,04 | 1,48 | 7,20 | 16,39 | 2,4611 | 0,1678 | |||
| PG / The Procter & Gamble Company | 0,04 | 1,61 | 6,98 | -5,08 | 2,3861 | -0,3402 | |||
| SNA / Snap-on Incorporated | 0,02 | 3,61 | 6,89 | -5,06 | 2,3538 | -0,3347 | |||
| VEA / Vanguard Tax-Managed Funds - Vanguard FTSE Developed Markets ETF | 0,11 | 0,03 | 6,46 | 11,80 | 2,2091 | 0,0662 | |||
| SEIC / SEI Investments Company | 0,07 | 3,79 | 6,22 | 20,68 | 2,1265 | 0,2156 | |||
| PAYX / Paychex, Inc. | 0,04 | 1,85 | 5,84 | -4,17 | 1,9948 | -0,2626 | |||
| VRSN / VeriSign, Inc. | 0,02 | 2,43 | 5,82 | 16,01 | 1,9887 | 0,1298 | |||
| MSFT / Microsoft Corporation | 0,01 | -3,43 | 5,76 | 25,70 | 1,9678 | 0,2699 | |||
| MCO / Moody's Corporation | 0,01 | 2,62 | 5,15 | 9,80 | 1,7613 | 0,0217 | |||
| ALSN / Allison Transmission Holdings, Inc. | 0,05 | 5,92 | 5,14 | 3,34 | 1,7567 | -0,0867 | |||
| SPGI / S&P Global Inc. | 0,01 | 2,59 | 5,13 | 5,92 | 1,7541 | -0,0420 | |||
| ADBE / Adobe Inc. | 0,01 | 7,32 | 5,05 | 8,35 | 1,7249 | -0,0015 | |||
| CNS / Cohen & Steers, Inc. | 0,06 | 3,06 | 4,73 | -3,76 | 1,6177 | -0,2052 | |||
| EA / Electronic Arts Inc. | 0,03 | 4,40 | 4,65 | 14,46 | 1,5881 | 0,0833 | |||
| JNJ / Johnson & Johnson | 0,03 | 2,62 | 4,56 | 2,29 | 1,5590 | -0,0939 | |||
| UNP / Union Pacific Corporation | 0,02 | 2,97 | 4,48 | -0,11 | 1,5297 | -0,1310 | |||
| QLYS / Qualys, Inc. | 0,03 | 5,74 | 4,47 | 17,40 | 1,5295 | 0,1167 | |||
| TROW / T. Rowe Price Group, Inc. | 0,04 | 3,32 | 3,99 | 8,05 | 1,3626 | -0,0049 | |||
| GGG / Graco Inc. | 0,05 | 3,36 | 3,95 | 5,31 | 1,3502 | -0,0401 | |||
| GNTX / Gentex Corporation | 0,17 | 9,61 | 3,82 | 2,74 | 1,3072 | -0,0726 | |||
| BND / Vanguard Bond Index Funds - Vanguard Total Bond Market ETF | 0,05 | -2,40 | 3,70 | -2,14 | 1,2654 | -0,1370 | |||
| CHD / Church & Dwight Co., Inc. | 0,04 | 3,53 | 3,53 | -9,12 | 1,2065 | -0,2330 | |||
| MNST / Monster Beverage Corporation | 0,05 | 3,55 | 3,43 | 9,87 | 1,1726 | 0,0151 | |||
| VOO / Vanguard Index Funds - Vanguard S&P 500 ETF | 0,01 | -0,93 | 3,39 | 9,08 | 1,1586 | 0,0070 | |||
| PM / Philip Morris International Inc. | 0,02 | 0,00 | 3,36 | 15,21 | 1,1494 | 0,0674 | |||
| KLAC / KLA Corporation | 0,00 | -0,56 | 3,02 | 30,52 | 1,0305 | 0,1742 | |||
| BKFOF / Brookfield Corporation - Preferred Stock | 0,05 | 0,00 | 2,88 | 14,99 | 0,9858 | 0,0559 | |||
| CSX / CSX Corporation | 0,08 | -0,53 | 2,57 | 9,88 | 0,8778 | 0,0114 | |||
| CBOE / Cboe Global Markets, Inc. | 0,01 | -0,29 | 1,98 | 3,34 | 0,6779 | -0,0336 | |||
| VUG / Vanguard Index Funds - Vanguard Growth ETF | 0,00 | -3,29 | 1,92 | 13,27 | 0,6569 | 0,0282 | |||
| NVDD / Direxion Shares ETF Trust - Direxion Daily NVDA Bear 1X Shares | 0,01 | -0,57 | 1,79 | 42,69 | 0,6102 | 0,1462 | |||
| NOW / ServiceNow, Inc. | 0,00 | -0,36 | 1,70 | 26,19 | 0,5815 | 0,0819 | |||
| MO / Altria Group, Inc. | 0,03 | 0,00 | 1,58 | -0,32 | 0,5399 | -0,0472 | |||
| D / Dominion Energy, Inc. | 0,03 | -6,19 | 1,55 | -5,79 | 0,5284 | -0,0796 | |||
| JPM / JPMorgan Chase & Co. | 0,00 | 0,70 | 1,42 | 19,85 | 0,4852 | 0,0460 | |||
| VTV / Vanguard Index Funds - Vanguard Value ETF | 0,01 | -1,80 | 1,41 | 0,71 | 0,4820 | -0,0370 | |||
| XOM / Exxon Mobil Corporation | 0,01 | -14,30 | 1,31 | -22,41 | 0,4464 | -0,1774 | |||
| BRK.B / Berkshire Hathaway Inc. | 0,00 | 0,19 | 1,25 | -8,68 | 0,4280 | -0,0803 | |||
| MCD / McDonald's Corporation | 0,00 | -0,47 | 1,25 | -7,28 | 0,4268 | -0,0724 | |||
| GOOG / Alphabet Inc. | 0,01 | -1,00 | 1,25 | 10,57 | 0,4256 | 0,0080 | |||
| DUK / Duke Energy Corporation | 0,01 | -1,62 | 1,24 | -4,10 | 0,4242 | -0,0556 | |||
| MDLZ / Mondelez International, Inc. | 0,02 | 0,00 | 1,24 | -0,24 | 0,4242 | -0,0373 | |||
| NSC / Norfolk Southern Corporation | 0,00 | 0,00 | 1,23 | 8,20 | 0,4196 | -0,0010 | |||
| VTEB / Vanguard Municipal Bond Funds - Vanguard Tax-Exempt Bond ETF | 0,02 | -3,07 | 1,07 | -4,31 | 0,3645 | -0,0487 | |||
| KO / The Coca-Cola Company | 0,01 | 0,26 | 1,02 | -1,26 | 0,3474 | -0,0343 | |||
| PEP / PepsiCo, Inc. | 0,01 | -18,12 | 1,00 | -27,81 | 0,3427 | -0,1718 | |||
| ZTS / Zoetis Inc. | 0,01 | 0,00 | 1,00 | -3,66 | 0,3420 | -0,0431 | |||
| KEYS / Keysight Technologies, Inc. | 0,01 | -1,66 | 0,90 | 7,38 | 0,3085 | -0,0030 | |||
| ALB / Albemarle Corporation | 0,01 | -3,56 | 0,85 | -15,79 | 0,2899 | -0,0837 | |||
| MRK / Merck & Co., Inc. | 0,01 | 0,04 | 0,82 | -9,18 | 0,2809 | -0,0542 | |||
| UPS / United Parcel Service, Inc. | 0,01 | -1,01 | 0,74 | -8,54 | 0,2528 | -0,0470 | |||
| ITW / Illinois Tool Works Inc. | 0,00 | 0,00 | 0,72 | -0,56 | 0,2447 | -0,0222 | |||
| IVOO / Vanguard Admiral Funds - Vanguard S&P Mid-Cap 400 ETF | 0,01 | -4,92 | 0,71 | 0,57 | 0,2420 | -0,0190 | |||
| GE / General Electric Company | 0,00 | -0,58 | 0,70 | 25,63 | 0,2399 | 0,0327 | |||
| UNH / UnitedHealth Group Incorporated | 0,00 | 0,00 | 0,68 | -40,37 | 0,2329 | -0,1906 | |||
| CAT / Caterpillar Inc. | 0,00 | 0,00 | 0,66 | 17,52 | 0,2270 | 0,0174 | |||
| BAM / Brookfield Asset Management Ltd. | 0,01 | 0,00 | 0,65 | 11,62 | 0,2234 | 0,0065 | |||
| MKL / Markel Group Inc. | 0,00 | -3,94 | 0,63 | 3,26 | 0,2164 | -0,0111 | |||
| ORCL / Oracle Corporation | 0,00 | -5,59 | 0,62 | 45,56 | 0,2132 | 0,0542 | |||
| FAST / Fastenal Company | 0,01 | 100,00 | 0,61 | 8,32 | 0,2092 | -0,0004 | |||
| BKNG / Booking Holdings Inc. | 0,00 | 0,00 | 0,60 | 23,61 | 0,2058 | 0,0252 | |||
| EMR / Emerson Electric Co. | 0,00 | 7,71 | 0,58 | 30,65 | 0,1998 | 0,0338 | |||
| VTI / Vanguard Index Funds - Vanguard Total Stock Market ETF | 0,00 | 0,00 | 0,58 | 10,15 | 0,1966 | 0,0031 | |||
| LLY / Eli Lilly and Company | 0,00 | 0,00 | 0,56 | -3,11 | 0,1916 | -0,0230 | |||
| ELV / Elevance Health, Inc. | 0,00 | -2,16 | 0,53 | -12,15 | 0,1808 | -0,0421 | |||
| EFA / iShares Trust - iShares MSCI EAFE ETF | 0,01 | 0,00 | 0,53 | 9,15 | 0,1796 | 0,0013 | |||
| NKSH / National Bankshares, Inc. | 0,02 | 0,00 | 0,49 | 4,45 | 0,1687 | -0,0062 | |||
| MU / Micron Technology, Inc. | 0,00 | -4,88 | 0,48 | 32,41 | 0,1635 | 0,0293 | |||
| GIS / General Mills, Inc. | 0,01 | -1,79 | 0,47 | -14,77 | 0,1617 | -0,0441 | |||
| NVR / NVR, Inc. | 0,00 | 0,00 | 0,46 | 2,24 | 0,1565 | -0,0093 | |||
| VIOO / Vanguard Admiral Funds - Vanguard S&P Small-Cap 600 ETF | 0,00 | -2,71 | 0,45 | 1,81 | 0,1539 | -0,0100 | |||
| LIN / Linde plc | 0,00 | 0,00 | 0,44 | 0,46 | 0,1490 | -0,0119 | |||
| TFC / Truist Financial Corporation | 0,01 | -1,19 | 0,43 | 3,60 | 0,1479 | -0,0070 | |||
| CVX / Chevron Corporation | 0,00 | 3,57 | 0,43 | -12,04 | 0,1476 | -0,0343 | |||
| SYY / Sysco Corporation | 0,01 | -1,27 | 0,42 | -0,71 | 0,1426 | -0,0134 | |||
| ORLY / O'Reilly Automotive, Inc. | 0,00 | 1 400,00 | 0,41 | -5,75 | 0,1405 | -0,0209 | |||
| DOV / Dover Corporation | 0,00 | 0,00 | 0,40 | 3,91 | 0,1366 | -0,0061 | |||
| CHH / Choice Hotels International, Inc. | 0,00 | -11,80 | 0,39 | -15,90 | 0,1323 | -0,0379 | |||
| AEP / American Electric Power Company, Inc. | 0,00 | 1,05 | 0,38 | -3,06 | 0,1299 | -0,0157 | |||
| UVV / Universal Corporation | 0,01 | 0,00 | 0,38 | 4,16 | 0,1286 | -0,0056 | |||
| NEE / NextEra Energy, Inc. | 0,01 | -4,52 | 0,37 | -6,58 | 0,1262 | -0,0202 | |||
| AMZN / Amazon.com, Inc. | 0,00 | 2,28 | 0,36 | 16,72 | 0,1242 | 0,0089 | |||
| WMT / Walmart Inc. | 0,00 | 0,87 | 0,35 | 10,76 | 0,1199 | 0,0028 | |||
| AMGN / Amgen Inc. | 0,00 | 2,45 | 0,35 | -6,93 | 0,1195 | -0,0195 | |||
| ADI / Analog Devices, Inc. | 0,00 | 0,49 | 0,34 | 19,86 | 0,1178 | 0,0114 | |||
| CHKP / Check Point Software Technologies Ltd. | 0,00 | 0,00 | 0,34 | -4,21 | 0,1167 | -0,0153 | |||
| OKE / ONEOK, Inc. | 0,00 | 0,00 | 0,34 | -18,05 | 0,1150 | -0,0370 | |||
| FTNT / Fortinet, Inc. | 0,00 | 0,00 | 0,33 | 9,67 | 0,1125 | 0,0009 | |||
| VEEV / Veeva Systems Inc. | 0,00 | 0,00 | 0,33 | 26,15 | 0,1123 | 0,0159 | |||
| COF / Capital One Financial Corporation | 0,00 | 0,00 | 0,33 | 19,34 | 0,1120 | 0,0103 | |||
| SHW / The Sherwin-Williams Company | 0,00 | 0,00 | 0,32 | -2,12 | 0,1107 | -0,0119 | |||
| PAYC / Paycom Software, Inc. | 0,00 | 0,00 | 0,32 | 4,56 | 0,1100 | -0,0039 | |||
| WSO / Watsco, Inc. | 0,00 | 0,00 | 0,32 | -13,78 | 0,1093 | -0,0280 | |||
| GEV / GE Vernova Inc. | 0,00 | 0,31 | 0,1072 | 0,1072 | |||||
| V / Visa Inc. | 0,00 | 5,45 | 0,31 | 8,07 | 0,1056 | -0,0003 | |||
| MMM / 3M Company | 0,00 | -7,27 | 0,29 | -4,33 | 0,0982 | -0,0132 | |||
| HRB / H&R Block, Inc. | 0,00 | 0,00 | 0,27 | -2,86 | 0,0933 | -0,0105 | |||
| TXN / Texas Instruments Incorporated | 0,00 | 11,34 | 0,27 | 29,76 | 0,0913 | 0,0151 | |||
| SBUX / Starbucks Corporation | 0,00 | -0,40 | 0,25 | -7,46 | 0,0851 | -0,0142 | |||
| TDG / TransDigm Group Incorporated | 0,00 | 0,00 | 0,24 | 9,09 | 0,0821 | 0,0003 | |||
| CAH / Cardinal Health, Inc. | 0,00 | 0,22 | 0,0759 | 0,0759 | |||||
| IBM / International Business Machines Corporation | 0,00 | 0,22 | 0,0755 | 0,0755 | |||||
| SO / The Southern Company | 0,00 | 0,00 | 0,21 | 0,00 | 0,0712 | -0,0060 | |||
| TFI / SPDR Series Trust - SPDR Nuveen ICE Municipal Bond ETF | 0,00 | 0,00 | 0,21 | -1,43 | 0,0711 | -0,0068 | |||
| QQQM / Invesco Exchange-Traded Fund Trust II - Invesco NASDAQ 100 ETF | 0,00 | 0,21 | 0,0703 | 0,0703 | |||||
| KMB / Kimberly-Clark Corporation | 0,00 | 0,00 | 0,20 | -10,18 | 0,0697 | -0,0142 | |||
| HD / The Home Depot, Inc. | 0,00 | 0,20 | 0,0694 | 0,0694 | |||||
| KMX / CarMax, Inc. | 0,00 | -7,26 | 0,20 | -21,09 | 0,0692 | -0,0258 | |||
| NBB / Nuveen Taxable Municipal Income Fund | 0,01 | 0,00 | 0,18 | -1,66 | 0,0610 | -0,0062 |