Statistiques de base
| Valeur du portefeuille | $ 2 855 748 |
| Positions actuelles | 69 |
Dernières positions, performances, ASG (à partir des dépôts 13F, 13D)
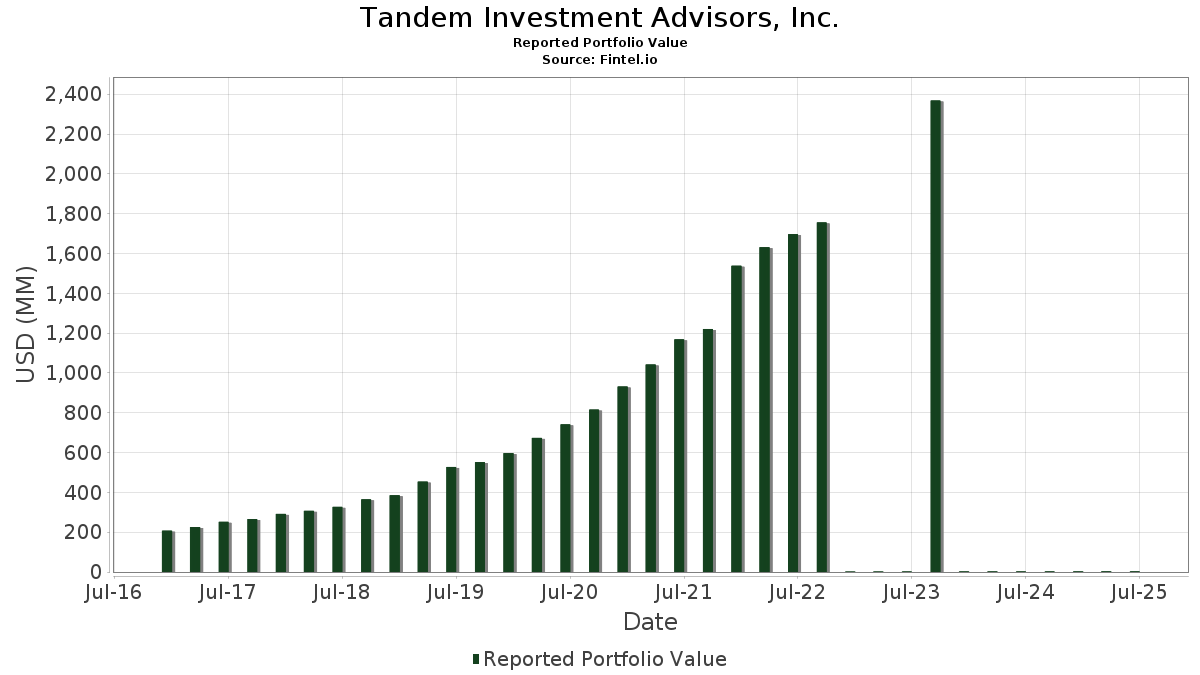
Tandem Investment Advisors, Inc. a déclaré un total de 69 positions dans ses derniers dépôts auprès de la SEC. La valeur la plus récente du portefeuille est calculée à 2 855 748 USD. Les actifs sous gestion réels (ASG) sont cette valeur plus les liquidités (qui ne sont pas divulguées). Les principales positions de Tandem Investment Advisors, Inc. sont Visa Inc. (US:V) , Intercontinental Exchange, Inc. (US:ICE) , Abbott Laboratories (US:ABT) , ResMed Inc. (US:RMD) , and Amphenol Corporation (US:APH) . Les nouvelles positions de Tandem Investment Advisors, Inc. incluent Gartner, Inc. (US:IT) , .
Meilleures augmentations ce trimestre
Nous utilisons la variation de l'allocation du portefeuille car il s'agit de l'indicateur le plus significatif. Les changements peuvent être dus à des transactions ou à des variations de prix des actions.
| Titre | Actions (en millions) |
Valeur ($ en millions) |
% du portefeuille | ΔPortefeuille % |
|---|---|---|---|---|
| 0,79 | 0,12 | 4,3200 | 2,0473 | |
| 0,24 | 0,12 | 4,2327 | 1,0331 | |
| 1,30 | 0,13 | 4,4795 | 0,8246 | |
| 0,38 | 0,11 | 3,9894 | 0,8202 | |
| 0,24 | 0,07 | 2,5404 | 0,7021 | |
| 0,20 | 0,11 | 4,0029 | 0,6418 | |
| 0,50 | 0,13 | 4,4982 | 0,5544 | |
| 0,71 | 0,07 | 2,3935 | 0,4974 | |
| 0,43 | 0,15 | 5,3602 | 0,4594 | |
| 0,81 | 0,15 | 5,1929 | 0,4474 |
Principales baisses ce trimestre
Nous utilisons la variation de l'allocation du portefeuille car il s'agit de l'indicateur le plus significatif. Les changements peuvent être dus à des transactions ou à des variations de prix des actions.
| Titre | Actions (en millions) |
Valeur ($ en millions) |
% du portefeuille | ΔPortefeuille % |
|---|---|---|---|---|
| 0,01 | 0,00 | 0,1211 | -6,3092 | |
| 0,28 | 0,05 | 1,6588 | -1,2558 | |
| 0,20 | 0,09 | 3,1496 | -0,8226 | |
| 0,28 | 0,03 | 0,9693 | -0,7219 | |
| 0,00 | 0,00 | -0,2438 | ||
| 0,29 | 0,04 | 1,5494 | -0,1506 | |
| 0,82 | 0,09 | 3,1687 | -0,1503 | |
| 2,07 | 0,08 | 2,6923 | -0,1282 | |
| 0,36 | 0,04 | 1,4451 | -0,0728 | |
| 0,10 | 0,06 | 1,9600 | -0,0606 |
Déclarations 13F et dépôts de fonds
Ce formulaire a été déposé le 2025-07-31 pour la période de déclaration 2025-06-30. Cliquez sur l'icône du lien pour voir l'historique complet des transactions.
Mettre à niveau pour débloquer les données premium et exporter vers Excel ![]() .
.
| Titre | Type | Prix moyen de l'action | Actions (en millions) |
ΔActions (%) |
ΔActions (%) |
Valeur ($ en millions) |
Portefeuille (%) |
ΔPortefeuille (%) |
|
|---|---|---|---|---|---|---|---|---|---|
| V / Visa Inc. | 0,43 | 7,57 | 0,15 | 9,29 | 5,3602 | 0,4594 | |||
| ICE / Intercontinental Exchange, Inc. | 0,81 | 2,51 | 0,15 | 8,82 | 5,1929 | 0,4474 | |||
| ABT / Abbott Laboratories | 0,99 | 0,53 | 0,14 | 3,05 | 4,7282 | 0,1577 | |||
| RMD / ResMed Inc. | 0,50 | -1,40 | 0,13 | 13,27 | 4,4982 | 0,5544 | |||
| APH / Amphenol Corporation | 1,30 | -18,89 | 0,13 | 22,12 | 4,4795 | 0,8246 | |||
| ZTS / Zoetis Inc. | 0,79 | 99,95 | 0,12 | 89,23 | 4,3200 | 2,0473 | |||
| JKHY / Jack Henry & Associates, Inc. | 0,67 | 3,74 | 0,12 | 2,54 | 4,2492 | 0,1131 | |||
| MSFT / Microsoft Corporation | 0,24 | -0,53 | 0,12 | 31,87 | 4,2327 | 1,0331 | |||
| MA / Mastercard Incorporated | 0,20 | 15,74 | 0,11 | 18,75 | 4,0029 | 0,6418 | |||
| ACN / Accenture plc | 0,38 | 30,94 | 0,11 | 25,56 | 3,9894 | 0,8202 | |||
| G / Genpact Limited | 2,58 | 13,84 | 0,11 | -0,88 | 3,9827 | -0,0076 | |||
| STE / STERIS plc | 0,46 | 1,56 | 0,11 | 6,86 | 3,8518 | 0,2865 | |||
| SYK / Stryker Corporation | 0,27 | 0,06 | 0,11 | 6,93 | 3,7824 | 0,2385 | |||
| NEE / NextEra Energy, Inc. | 1,42 | 3,21 | 0,10 | 1,03 | 3,4459 | 0,0489 | |||
| BRO / Brown & Brown, Inc. | 0,82 | 6,73 | 0,09 | -5,26 | 3,1687 | -0,1503 | |||
| FDS / FactSet Research Systems Inc. | 0,20 | -19,70 | 0,09 | -21,24 | 3,1496 | -0,8226 | |||
| CMCSA / Comcast Corporation | 2,39 | 3,90 | 0,09 | 1,19 | 2,9818 | 0,0256 | |||
| TRNO / Terreno Realty Corporation | 1,41 | 28,22 | 0,08 | 13,04 | 2,7661 | 0,3427 | |||
| C.WSA / Citigroup, Inc. | 0,07 | -0,64 | 0,08 | 10,00 | 2,7085 | 0,2586 | |||
| WTRG / Essential Utilities, Inc. | 2,07 | 1,23 | 0,08 | -5,00 | 2,6923 | -0,1282 | |||
| ADP / Automatic Data Processing, Inc. | 0,24 | 36,41 | 0,07 | 38,46 | 2,5404 | 0,7021 | |||
| WCN / Waste Connections, Inc. | 0,37 | 5,68 | 0,07 | 1,45 | 2,4512 | 0,0354 | |||
| CHD / Church & Dwight Co., Inc. | 0,71 | 44,06 | 0,07 | 25,93 | 2,3935 | 0,4974 | |||
| ROP / Roper Technologies, Inc. | 0,10 | 0,53 | 0,06 | -3,51 | 1,9600 | -0,0606 | |||
| RSG / Republic Services, Inc. | 0,22 | -1,99 | 0,05 | 0,00 | 1,9019 | 0,0034 | |||
| VRSK / Verisk Analytics, Inc. | 0,17 | 3,13 | 0,05 | 8,51 | 1,8143 | 0,1397 | |||
| BDX / Becton, Dickinson and Company | 0,28 | -24,59 | 0,05 | -43,37 | 1,6588 | -1,2558 | |||
| JNJ / Johnson & Johnson | 0,29 | -1,41 | 0,04 | -8,33 | 1,5494 | -0,1506 | |||
| COST / Costco Wholesale Corporation | 0,04 | 0,14 | 0,04 | 5,00 | 1,4875 | 0,0736 | |||
| EXPD / Expeditors International of Washington, Inc. | 0,36 | -0,16 | 0,04 | -4,65 | 1,4451 | -0,0728 | |||
| SJM / The J. M. Smucker Company | 0,28 | -31,14 | 0,03 | -43,75 | 0,9693 | -0,7219 | |||
| IDXX / IDEXX Laboratories, Inc. | 0,01 | 0,27 | 0,01 | 50,00 | 0,2206 | 0,0490 | |||
| ANSS / ANSYS, Inc. | 0,02 | 21,12 | 0,01 | 50,00 | 0,2182 | 0,0564 | |||
| QLYS / Qualys, Inc. | 0,04 | 0,51 | 0,01 | 0,00 | 0,2080 | 0,0263 | |||
| ORLY / O'Reilly Automotive, Inc. | 0,06 | 1 361,27 | 0,01 | -16,67 | 0,2008 | -0,0168 | |||
| TYL / Tyler Technologies, Inc. | 0,01 | -0,41 | 0,01 | 0,00 | 0,1818 | 0,0034 | |||
| ISRG / Intuitive Surgical, Inc. | 0,01 | 0,97 | 0,00 | 0,00 | 0,1679 | 0,0169 | |||
| MEDP / Medpace Holdings, Inc. | 0,01 | 27,36 | 0,00 | 33,33 | 0,1636 | 0,0394 | |||
| ADBE / Adobe Inc. | 0,01 | 158,72 | 0,00 | 300,00 | 0,1569 | 0,0970 | |||
| CBOE / Cboe Global Markets, Inc. | 0,01 | -98,18 | 0,00 | -98,37 | 0,1211 | -6,3092 | |||
| AKAM / Akamai Technologies, Inc. | 0,03 | -5,06 | 0,00 | 0,00 | 0,0834 | -0,0049 | |||
| ABBV / AbbVie Inc. | 0,01 | 7,31 | 0,00 | 0,00 | 0,0618 | -0,0029 | |||
| PG / The Procter & Gamble Company | 0,01 | -30,28 | 0,00 | -50,00 | 0,0603 | -0,0319 | |||
| AAPL / Apple Inc. | 0,01 | -6,91 | 0,00 | 0,00 | 0,0467 | -0,0074 | |||
| WMT / Walmart Inc. | 0,01 | -8,63 | 0,00 | 0,00 | 0,0375 | 0,0008 | |||
| HD / The Home Depot, Inc. | 0,00 | -7,49 | 0,00 | 0,0290 | -0,0022 | ||||
| TJX / The TJX Companies, Inc. | 0,01 | 1,59 | 0,00 | 0,0248 | 0,0008 | ||||
| RY / Royal Bank of Canada | 0,01 | -26,74 | 0,00 | 0,0240 | -0,0040 | ||||
| BX / Blackstone Inc. | 0,00 | -8,33 | 0,00 | 0,0220 | -0,0003 | ||||
| KO / The Coca-Cola Company | 0,01 | -15,58 | 0,00 | 0,0194 | -0,0038 | ||||
| FAST / Fastenal Company | 0,01 | 21,51 | 0,00 | 0,0179 | -0,0092 | ||||
| EXLS / ExlService Holdings, Inc. | 0,01 | -0,94 | 0,00 | 0,0157 | -0,0013 | ||||
| GOOG / Alphabet Inc. | 0,00 | 1,39 | 0,00 | 0,0136 | 0,0018 | ||||
| PM / Philip Morris International Inc. | 0,00 | 1,20 | 0,00 | 0,0134 | 0,0019 | ||||
| AMZN / Amazon.com, Inc. | 0,00 | -11,62 | 0,00 | 0,0131 | 0,0003 | ||||
| MO / Altria Group, Inc. | 0,01 | -6,21 | 0,00 | 0,0129 | -0,0011 | ||||
| ETN / Eaton Corporation plc | 0,00 | 0,00 | 0,0110 | 0,0110 | |||||
| META / Meta Platforms, Inc. | 0,00 | -68,01 | 0,00 | 0,0096 | -0,0069 | ||||
| JPM / JPMorgan Chase & Co. | 0,00 | -23,57 | 0,00 | 0,0095 | -0,0010 | ||||
| CTVA / Corteva, Inc. | 0,00 | -0,22 | 0,00 | 0,0093 | 0,0015 | ||||
| WEC / WEC Energy Group, Inc. | 0,00 | 4,09 | 0,00 | 0,0089 | -0,0000 | ||||
| GOOGL / Alphabet Inc. | 0,00 | -7,28 | 0,00 | 0,0089 | 0,0005 | ||||
| IT / Gartner, Inc. | 0,00 | 0,00 | 0,0085 | 0,0085 | |||||
| DD / DuPont de Nemours, Inc. | 0,00 | -9,71 | 0,00 | 0,0085 | -0,0017 | ||||
| QDEL / QuidelOrtho Corporation | 0,01 | -11,82 | 0,00 | 0,0075 | -0,0028 | ||||
| BRK.B / Berkshire Hathaway Inc. | 0,00 | -27,27 | 0,00 | 0,0075 | -0,0037 | ||||
| MRK / Merck & Co., Inc. | 0,00 | 0,00 | 0,0074 | 0,0074 | |||||
| AMGN / Amgen Inc. | 0,00 | 0,00 | 0,0073 | 0,0073 | |||||
| CVX / Chevron Corporation | 0,00 | 0,64 | 0,00 | 0,0070 | -0,0011 | ||||
| UPS / United Parcel Service, Inc. | 0,00 | -100,00 | 0,00 | 0,0000 | |||||
| NVDA / NVIDIA Corporation | 0,00 | -100,00 | 0,00 | 0,0000 | -0,0080 | ||||
| TFC / Truist Financial Corporation | 0,00 | -100,00 | 0,00 | 0,0000 | |||||
| UNH / UnitedHealth Group Incorporated | 0,00 | -100,00 | 0,00 | 0,0000 | |||||
| FI / Fiserv, Inc. | 0,00 | -100,00 | 0,00 | -100,00 | -0,2438 |