Statistiques de base
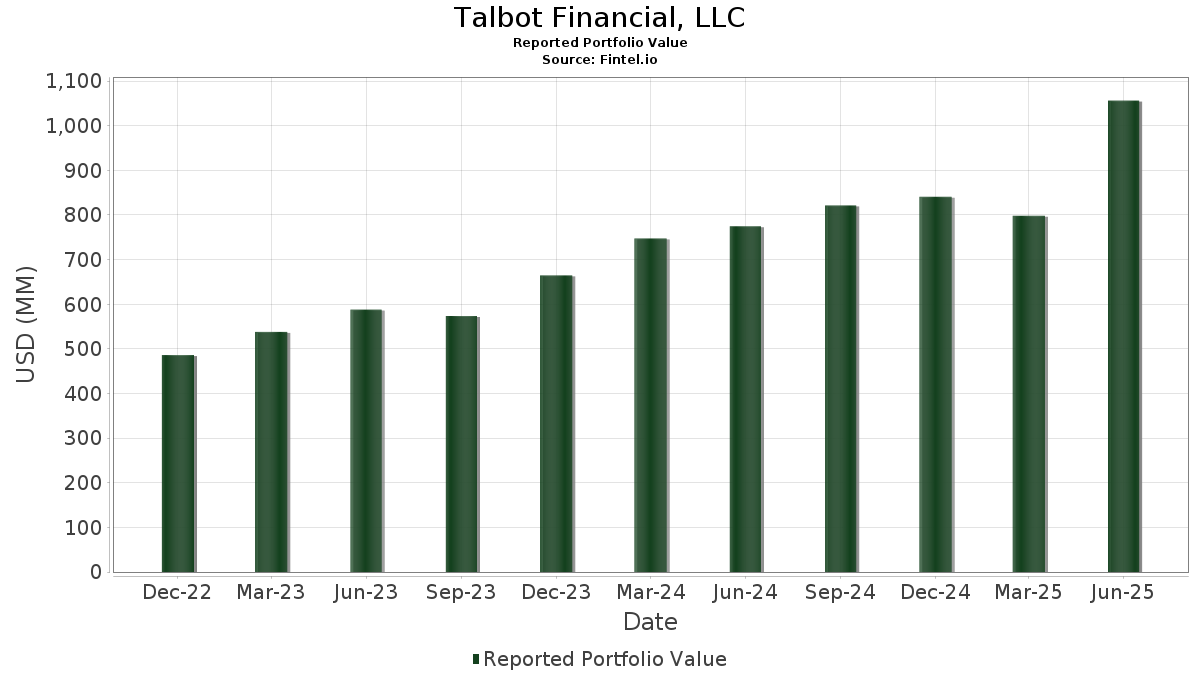
| Valeur du portefeuille | $ 1 056 378 632 |
| Positions actuelles | 63 |
Dernières positions, performances, ASG (à partir des dépôts 13F, 13D)
Talbot Financial, LLC a déclaré un total de 63 positions dans ses derniers dépôts auprès de la SEC. La valeur la plus récente du portefeuille est calculée à 1 056 378 632 USD. Les actifs sous gestion réels (ASG) sont cette valeur plus les liquidités (qui ne sont pas divulguées). Les principales positions de Talbot Financial, LLC sont Microsoft Corporation (US:MSFT) , Apple Inc. (US:AAPL) , Amazon.com, Inc. (US:AMZN) , NVIDIA Corporation (US:NVDA) , and Alphabet Inc. (US:GOOGL) . Les nouvelles positions de Talbot Financial, LLC incluent BlackRock, Inc. (US:BLK) , Meta Platforms, Inc. (US:META) , .
Meilleures augmentations ce trimestre
Nous utilisons la variation de l'allocation du portefeuille car il s'agit de l'indicateur le plus significatif. Les changements peuvent être dus à des transactions ou à des variations de prix des actions.
| Titre | Actions (en millions) |
Valeur ($ en millions) |
% du portefeuille | ΔPortefeuille % |
|---|---|---|---|---|
| 0,24 | 119,12 | 11,2492 | 1,5070 | |
| 0,01 | 14,97 | 1,4175 | 1,4175 | |
| 0,27 | 42,42 | 4,0060 | 0,8645 | |
| 0,07 | 18,28 | 1,7303 | 0,6595 | |
| 0,05 | 33,52 | 3,1657 | 0,3885 | |
| 0,15 | 26,64 | 2,5157 | 0,3730 | |
| 0,02 | 12,62 | 1,1918 | 0,3527 | |
| 0,02 | 22,74 | 2,1475 | 0,3477 | |
| 0,04 | 28,69 | 2,7091 | 0,2550 | |
| 0,01 | 14,85 | 1,4028 | 0,2287 |
Principales baisses ce trimestre
Nous utilisons la variation de l'allocation du portefeuille car il s'agit de l'indicateur le plus significatif. Les changements peuvent être dus à des transactions ou à des variations de prix des actions.
| Titre | Actions (en millions) |
Valeur ($ en millions) |
% du portefeuille | ΔPortefeuille % |
|---|---|---|---|---|
| 0,42 | 85,92 | 8,1142 | -2,0807 | |
| 0,12 | 21,60 | 2,0395 | -0,4338 | |
| 0,15 | 21,06 | 1,9884 | -0,3919 | |
| 0,04 | 12,19 | 1,1515 | -0,2716 | |
| 0,06 | 18,68 | 1,7639 | -0,2632 | |
| 0,05 | 14,75 | 1,3928 | -0,2525 | |
| 0,06 | 22,31 | 2,1072 | -0,2368 | |
| 0,13 | 20,21 | 1,9082 | -0,2115 | |
| 0,02 | 19,51 | 1,8427 | -0,1815 | |
| 0,03 | 21,11 | 1,9940 | -0,1804 |
Déclarations 13F et dépôts de fonds
Ce formulaire a été déposé le 2025-07-22 pour la période de déclaration 2025-06-30. Cliquez sur l'icône du lien pour voir l'historique complet des transactions.
Mettre à niveau pour débloquer les données premium et exporter vers Excel ![]() .
.
| Titre | Type | Prix moyen de l'action | Actions (en millions) |
ΔActions (%) |
ΔActions (%) |
Valeur ($ en millions) |
Portefeuille (%) |
ΔPortefeuille (%) |
|
|---|---|---|---|---|---|---|---|---|---|
| MSFT / Microsoft Corporation | 0,24 | 15,60 | 119,12 | 53,17 | 11,2492 | 1,5070 | |||
| AAPL / Apple Inc. | 0,42 | 14,31 | 85,92 | 5,58 | 8,1142 | -2,0807 | |||
| AMZN / Amazon.com, Inc. | 0,27 | 17,85 | 59,67 | 35,89 | 5,6352 | 0,1345 | |||
| NVDA / NVIDIA Corporation | 0,27 | 16,04 | 42,42 | 69,16 | 4,0060 | 0,8645 | |||
| GOOGL / Alphabet Inc. | 0,23 | 19,61 | 40,65 | 35,86 | 3,8392 | 0,0905 | |||
| GSCE / GS Connect S&P GSCI Enhanced Commodity Total Return ETN | 0,05 | 16,71 | 33,52 | 51,21 | 3,1657 | 0,3885 | |||
| JPM / JPMorgan Chase & Co. | 0,11 | 14,43 | 31,10 | 35,24 | 2,9369 | 0,0563 | |||
| INTU / Intuit Inc. | 0,04 | 14,15 | 28,69 | 46,43 | 2,7091 | 0,2550 | |||
| AMAT / Applied Materials, Inc. | 0,15 | 23,46 | 26,64 | 55,74 | 2,5157 | 0,3730 | |||
| NFLX / Netflix, Inc. | 0,02 | 10,22 | 22,74 | 58,28 | 2,1475 | 0,3477 | |||
| V / Visa Inc. | 0,06 | 17,71 | 22,31 | 19,25 | 2,1072 | -0,2368 | |||
| ABBV / AbbVie Inc. | 0,12 | 23,47 | 21,60 | 9,39 | 2,0395 | -0,4338 | |||
| CRM / Salesforce, Inc. | 0,08 | 28,90 | 21,50 | 30,99 | 2,0299 | -0,0259 | |||
| SYK / Stryker Corporation | 0,05 | 22,37 | 21,26 | 30,06 | 2,0081 | -0,0400 | |||
| LLY / Eli Lilly and Company | 0,03 | 28,89 | 21,11 | 21,65 | 1,9940 | -0,1804 | |||
| CVX / Chevron Corporation | 0,15 | 29,46 | 21,06 | 10,81 | 1,9884 | -0,3919 | |||
| HON / Honeywell International Inc. | 0,09 | 20,76 | 20,38 | 32,81 | 1,9250 | 0,0023 | |||
| JNJ / Johnson & Johnson | 0,13 | 29,65 | 20,21 | 19,41 | 1,9082 | -0,2115 | |||
| COST / Costco Wholesale Corporation | 0,02 | 15,37 | 19,51 | 20,76 | 1,8427 | -0,1815 | |||
| CB / Chubb Limited | 0,06 | 20,31 | 18,68 | 15,43 | 1,7639 | -0,2632 | |||
| AVGO / Broadcom Inc. | 0,07 | 29,88 | 18,28 | 113,85 | 1,7303 | 0,6595 | |||
| ADBE / Adobe Inc. | 0,05 | 26,03 | 17,86 | 27,13 | 1,6864 | -0,0733 | |||
| HD / The Home Depot, Inc. | 0,05 | 26,13 | 17,64 | 26,18 | 1,6657 | -0,0854 | |||
| SCHW / The Charles Schwab Corporation | 0,18 | 16,33 | 16,84 | 35,60 | 1,5904 | 0,0345 | |||
| NOC / Northrop Grumman Corporation | 0,03 | 22,43 | 15,67 | 19,55 | 1,4800 | -0,1622 | |||
| MDT / Medtronic plc | 0,18 | 32,12 | 15,52 | 28,17 | 1,4654 | -0,0513 | |||
| CSCO / Cisco Systems, Inc. | 0,22 | 20,04 | 15,45 | 34,97 | 1,4592 | 0,0250 | |||
| SNPS / Synopsys, Inc. | 0,03 | 23,51 | 15,21 | 47,67 | 1,4365 | 0,1460 | |||
| BLK / BlackRock, Inc. | 0,01 | 14,97 | 1,4175 | 1,4175 | |||||
| NOW / ServiceNow, Inc. | 0,01 | 22,73 | 14,85 | 58,49 | 1,4028 | 0,2287 | |||
| AMGN / Amgen Inc. | 0,05 | 25,30 | 14,75 | 12,30 | 1,3928 | -0,2525 | |||
| GJR / Strats Trust For Procter & Gambel Security - Preferred Security | 0,09 | 28,53 | 14,10 | 20,16 | 1,3311 | -0,1384 | |||
| EMR / Emerson Electric Co. | 0,10 | 32,76 | 13,48 | 61,44 | 1,2728 | 0,2270 | |||
| GEV / GE Vernova Inc. | 0,02 | 8,70 | 12,62 | 88,41 | 1,1918 | 0,3527 | |||
| AJG / Arthur J. Gallagher & Co. | 0,04 | 15,76 | 12,19 | 7,33 | 1,1515 | -0,2716 | |||
| TRV / The Travelers Companies, Inc. | 0,04 | 17,19 | 11,82 | 18,55 | 1,1165 | -0,1327 | |||
| UBER / Uber Technologies, Inc. | 0,12 | 17,67 | 11,44 | 50,69 | 1,0803 | 0,1292 | |||
| T / AT&T Inc. | 0,39 | 17,86 | 11,25 | 20,61 | 1,0624 | -0,1060 | |||
| MRK / Merck & Co., Inc. | 0,14 | 40,32 | 11,16 | 23,76 | 1,0539 | -0,0758 | |||
| MA / Mastercard Incorporated | 0,02 | 21,14 | 10,67 | 24,20 | 1,0077 | -0,0687 | |||
| PFE / Pfizer Inc. | 0,43 | 29,93 | 10,38 | 24,29 | 0,9800 | -0,0659 | |||
| ROK / Rockwell Automation, Inc. | 0,03 | 16,31 | 9,93 | 49,52 | 0,9382 | 0,1059 | |||
| TMO / Thermo Fisher Scientific Inc. | 0,02 | 40,78 | 9,93 | 14,73 | 0,9381 | -0,1467 | |||
| PEP / PepsiCo, Inc. | 0,07 | 33,18 | 9,87 | 17,29 | 0,9322 | -0,1221 | |||
| MCD / McDonald's Corporation | 0,03 | 26,35 | 9,64 | 18,18 | 0,9104 | -0,1115 | |||
| NVO / Novo Nordisk A/S - Depositary Receipt (Common Stock) | 0,12 | 22,72 | 8,63 | 21,98 | 0,8146 | -0,0713 | |||
| FFIV / F5, Inc. | 0,02 | 0,00 | 4,64 | 10,53 | 0,4382 | -0,0877 | |||
| WAFD / WaFd, Inc | 0,08 | 0,00 | 2,27 | 2,44 | 0,2145 | -0,0632 | |||
| XOM / Exxon Mobil Corporation | 0,01 | 247,37 | 1,42 | 215,30 | 0,1344 | 0,0778 | |||
| SHW / The Sherwin-Williams Company | 0,00 | 0,00 | 1,09 | -1,71 | 0,1030 | -0,0359 | |||
| WK / Workiva Inc. | 0,01 | 0,00 | 0,72 | -9,91 | 0,0679 | -0,0320 | |||
| IBM / International Business Machines Corporation | 0,00 | 0,00 | 0,68 | 18,56 | 0,0640 | -0,0076 | |||
| BRK.B / Berkshire Hathaway Inc. | 0,00 | 0,00 | 0,63 | -8,82 | 0,0597 | -0,0271 | |||
| CDNS / Cadence Design Systems, Inc. | 0,00 | 0,00 | 0,31 | 21,26 | 0,0291 | -0,0028 | |||
| UNP / Union Pacific Corporation | 0,00 | 0,00 | 0,30 | -2,61 | 0,0282 | -0,0102 | |||
| AXP / American Express Company | 0,00 | 0,00 | 0,29 | 18,60 | 0,0272 | -0,0032 | |||
| ORCL / Oracle Corporation | 0,00 | 0,28 | 0,0268 | 0,0268 | |||||
| ADP / Automatic Data Processing, Inc. | 0,00 | 0,00 | 0,28 | 1,09 | 0,0262 | -0,0082 | |||
| PROV / Provident Financial Holdings, Inc. | 0,02 | 0,00 | 0,28 | 6,15 | 0,0261 | -0,0065 | |||
| WMT / Walmart Inc. | 0,00 | 0,00 | 0,27 | 11,67 | 0,0253 | -0,0048 | |||
| MCK / McKesson Corporation | 0,00 | 0,00 | 0,26 | 8,90 | 0,0243 | -0,0053 | |||
| BSX / Boston Scientific Corporation | 0,00 | 0,00 | 0,22 | 6,40 | 0,0205 | -0,0050 | |||
| META / Meta Platforms, Inc. | 0,00 | 0,20 | 0,0194 | 0,0194 | |||||
| EXPD / Expeditors International of Washington, Inc. | 0,00 | -100,00 | 0,00 | 0,0000 | |||||
| C.WSA / Citigroup, Inc. | 0,00 | -100,00 | 0,00 | 0,0000 |