Statistiques de base
| Valeur du portefeuille | $ 2 361 247 025 |
| Positions actuelles | 107 |
Dernières positions, performances, ASG (à partir des dépôts 13F, 13D)
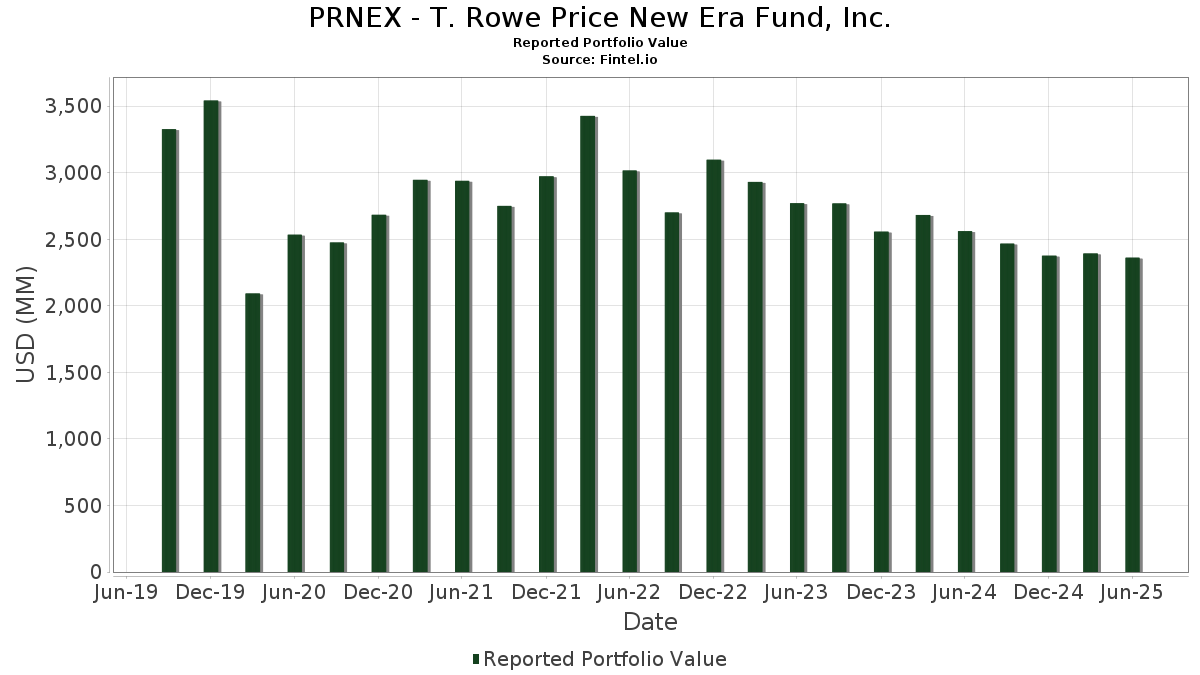
PRNEX - T. Rowe Price New Era Fund, Inc. a déclaré un total de 107 positions dans ses derniers dépôts auprès de la SEC. La valeur la plus récente du portefeuille est calculée à 2 361 247 025 USD. Les actifs sous gestion réels (ASG) sont cette valeur plus les liquidités (qui ne sont pas divulguées). Les principales positions de PRNEX - T. Rowe Price New Era Fund, Inc. sont Shell plc (GB:SHEL) , Exxon Mobil Corporation (US:XOM) , Chevron Corporation (US:CVX) , ConocoPhillips (US:COP) , and The Williams Companies, Inc. (US:WMB) . Les nouvelles positions de PRNEX - T. Rowe Price New Era Fund, Inc. incluent Woodside Energy Group Ltd (AU:WDS) , Vista Energy, S.A.B. de C.V. - Depositary Receipt (Common Stock) (US:VIST) , thyssenkrupp AG (DE:TKA) , Kajima Corporation (JP:1812) , and Shimizu Corporation (US:SHMUF) .
Meilleures augmentations ce trimestre
Nous utilisons la variation de l'allocation du portefeuille car il s'agit de l'indicateur le plus significatif. Les changements peuvent être dus à des transactions ou à des variations de prix des actions.
| Titre | Actions (en millions) |
Valeur ($ en millions) |
% du portefeuille | ΔPortefeuille % |
|---|---|---|---|---|
| 0,28 | 23,86 | 1,0132 | 1,0132 | |
| 1,45 | 22,47 | 0,9542 | 0,9542 | |
| 0,72 | 18,62 | 0,7907 | 0,7907 | |
| 0,50 | 37,11 | 1,5760 | 0,7103 | |
| 0,24 | 11,77 | 0,4998 | 0,4998 | |
| 0,26 | 17,81 | 0,7566 | 0,4665 | |
| 0,20 | 9,53 | 0,4047 | 0,4047 | |
| 11,61 | 11,61 | 0,4932 | 0,3835 | |
| 0,81 | 8,68 | 0,3686 | 0,3686 | |
| 0,10 | 17,94 | 0,7620 | 0,3629 |
Principales baisses ce trimestre
Nous utilisons la variation de l'allocation du portefeuille car il s'agit de l'indicateur le plus significatif. Les changements peuvent être dus à des transactions ou à des variations de prix des actions.
| Titre | Actions (en millions) |
Valeur ($ en millions) |
% du portefeuille | ΔPortefeuille % |
|---|---|---|---|---|
| 0,89 | 95,43 | 4,0533 | -0,8996 | |
| 0,55 | 78,10 | 3,3170 | -0,5798 | |
| 0,86 | 77,23 | 3,2803 | -0,5226 | |
| 0,55 | 21,07 | 0,8949 | -0,5108 | |
| 0,06 | 7,42 | 0,3153 | -0,4446 | |
| 0,22 | 38,88 | 1,6514 | -0,4038 | |
| 0,53 | 14,16 | 0,6013 | -0,3938 | |
| 1,16 | 39,28 | 1,6684 | -0,3756 | |
| 0,24 | 17,52 | 0,7440 | -0,3241 | |
| 0,43 | 34,73 | 1,4752 | -0,3011 |
Déclarations 13F et dépôts de fonds
Ce formulaire a été déposé le 2025-08-26 pour la période de déclaration 2025-06-30. Cliquez sur l'icône du lien pour voir l'historique complet des transactions.
Mettre à niveau pour débloquer les données premium et exporter vers Excel ![]() .
.
| Titre | Type | Prix moyen de l'action | Actions (en millions) |
ΔActions (%) |
ΔActions (%) |
Valeur ($ en millions) |
Portefeuille (%) |
ΔPortefeuille (%) |
|
|---|---|---|---|---|---|---|---|---|---|
| SHEL / Shell plc | 3,01 | 6,01 | 104,96 | 1,61 | 4,4578 | 0,1115 | |||
| XOM / Exxon Mobil Corporation | 0,89 | -10,56 | 95,43 | -18,93 | 4,0533 | -0,8996 | |||
| CVX / Chevron Corporation | 0,55 | -1,48 | 78,10 | -15,67 | 3,3170 | -0,5798 | |||
| COP / ConocoPhillips | 0,86 | 0,00 | 77,23 | -14,55 | 3,2803 | -0,5226 | |||
| WMB / The Williams Companies, Inc. | 1,11 | -6,63 | 69,43 | -1,86 | 2,9489 | -0,0279 | |||
| LIN / Linde plc | 0,15 | 0,00 | 69,01 | 0,76 | 2,9312 | 0,0493 | |||
| FP / TotalEnergies SE | 1,07 | 5,47 | 65,19 | 0,06 | 2,7688 | 0,0274 | |||
| EOG / EOG Resources, Inc. | 0,45 | -2,21 | 53,56 | -8,79 | 2,2749 | -0,1958 | |||
| ENB / Enbridge Inc. | 1,15 | 0,00 | 52,14 | 2,28 | 2,2145 | 0,0696 | |||
| MPC / Marathon Petroleum Corporation | 0,31 | 0,00 | 51,86 | 14,01 | 2,2028 | 0,2889 | |||
| CRC / Canadian Natural Resources Limited | 1,46 | -5,02 | 46,02 | -2,99 | 1,9544 | -0,0413 | |||
| AI / L'Air Liquide S.A. | 0,20 | 6,15 | 42,25 | 15,23 | 1,7947 | 0,2518 | |||
| VLO / Valero Energy Corporation | 0,31 | 0,00 | 41,84 | 1,78 | 1,7772 | 0,0474 | |||
| PSX / Phillips 66 | 0,33 | 0,00 | 39,41 | -3,39 | 1,6739 | -0,0424 | |||
| SLB / Schlumberger Limited | 1,16 | 0,00 | 39,28 | -19,14 | 1,6684 | -0,3756 | |||
| TRGP / Targa Resources Corp. | 0,22 | -8,33 | 38,88 | -20,40 | 1,6514 | -0,4038 | |||
| SU / Suncor Energy Inc. | 1,04 | 0,00 | 38,81 | -3,26 | 1,6484 | -0,0395 | |||
| CCJ / Cameco Corporation | 0,50 | 0,00 | 37,11 | 80,35 | 1,5760 | 0,7103 | |||
| OKE / ONEOK, Inc. | 0,43 | 0,00 | 34,73 | -17,73 | 1,4752 | -0,3011 | |||
| SHW / The Sherwin-Williams Company | 0,10 | 0,00 | 33,72 | -1,67 | 1,4323 | -0,0107 | |||
| EQT / EQT Corporation | 0,57 | 0,00 | 33,02 | 9,15 | 1,4024 | 0,1296 | |||
| 76105YYY8 / T ROWE PRICE GOVERNMENT RESERVE INVESTMENT FUND - Collateral | 32,99 | 19,43 | 32,99 | 19,43 | 1,4013 | 0,2390 | |||
| FCX / Freeport-McMoRan Inc. | 0,75 | 0,00 | 32,64 | 14,50 | 1,3864 | 0,1869 | |||
| EXE / Expand Energy Corporation | 0,24 | 0,00 | 28,55 | 5,05 | 1,2127 | 0,0691 | |||
| FTI / TechnipFMC plc | 0,79 | 0,00 | 27,28 | 8,68 | 1,1586 | 0,1025 | |||
| HEI / Heidelberg Materials AG | 0,11 | 0,00 | 26,58 | 36,62 | 1,1289 | 0,3103 | |||
| GALP / Galp Energia, SGPS, S.A. | 1,43 | 0,00 | 26,22 | 4,49 | 1,1138 | 0,0578 | |||
| FANG / Diamondback Energy, Inc. | 0,19 | 28,37 | 25,62 | 10,32 | 1,0879 | 0,1110 | |||
| HES / Hess Corporation | 0,18 | 0,00 | 24,38 | -13,27 | 1,0357 | -0,1472 | |||
| KOBOLD METALS SER B-1 CVT PFD STOCK PP / EP (000000000) | 0,28 | 23,86 | 1,0132 | 1,0132 | |||||
| 3FO / Franco-Nevada Corporation | 0,14 | 5,35 | 22,96 | 9,97 | 0,9751 | 0,0967 | |||
| WDS / Woodside Energy Group Ltd | 1,45 | 22,47 | 0,9542 | 0,9542 | |||||
| BAS / Leverage Shares Plc - Corporate Bond/Note | 0,45 | 11,76 | 22,36 | 10,27 | 0,9497 | 0,0965 | |||
| NEE / NextEra Energy, Inc. | 0,32 | 0,00 | 22,30 | -2,07 | 0,9470 | -0,0110 | |||
| BKR / Baker Hughes Company | 0,55 | -27,70 | 21,07 | -36,93 | 0,8949 | -0,5108 | |||
| AEM / Agnico Eagle Mines Limited | 0,17 | 5,91 | 20,46 | 16,19 | 0,8689 | 0,1281 | |||
| BP / BP p.l.c. - Depositary Receipt (Common Stock) | 3,97 | 20,86 | 19,78 | 7,30 | 0,8402 | 0,0645 | |||
| RRC / Range Resources Corporation | 0,48 | 0,00 | 19,45 | 1,85 | 0,8261 | 0,0226 | |||
| IP / International Paper Company | 0,41 | 30,26 | 19,39 | 14,34 | 0,8236 | 0,1100 | |||
| OVV / Ovintiv Inc. | 0,50 | 13,93 | 18,96 | 1,28 | 0,8051 | 0,0176 | |||
| TOU / Tourmaline Oil Corp. | 0,39 | 62,62 | 18,76 | 55,92 | 0,7969 | 0,3575 | |||
| OR / OR Royalties Inc. | 0,72 | 18,62 | 0,7907 | 0,7907 | |||||
| CTVA / Corteva, Inc. | 0,25 | 0,00 | 18,39 | 18,44 | 0,7809 | 0,1277 | |||
| SO / The Southern Company | 0,20 | 0,00 | 18,23 | -0,13 | 0,7742 | 0,0062 | |||
| KGX / KION GROUP AG | 0,32 | 0,00 | 18,10 | 33,20 | 0,7687 | 0,1970 | |||
| PKG / Packaging Corporation of America | 0,10 | 98,73 | 17,94 | 89,13 | 0,7620 | 0,3629 | |||
| DD / DuPont de Nemours, Inc. | 0,26 | 181,37 | 17,81 | 158,44 | 0,7566 | 0,4665 | |||
| HOLN / Holcim AG | 0,24 | 0,00 | 17,52 | -30,99 | 0,7440 | -0,3241 | |||
| GLEN / Glencore plc | 4,48 | 7,68 | 17,44 | 14,65 | 0,7407 | 0,1006 | |||
| WFG / West Fraser Timber Co. Ltd. | 0,23 | 0,00 | 17,01 | -4,53 | 0,7226 | -0,0272 | |||
| FQVLF / First Quantum Minerals Ltd. | 0,95 | 36,61 | 16,95 | 80,47 | 0,7199 | 0,3247 | |||
| PR / Permian Resources Corporation | 1,22 | -0,89 | 16,67 | -2,54 | 0,7078 | -0,0116 | |||
| SOBO / South Bow Corporation | 0,62 | 0,00 | 16,16 | 1,62 | 0,6863 | 0,0173 | |||
| DINO / HF Sinclair Corporation | 0,39 | 19,59 | 16,07 | 49,41 | 0,6827 | 0,2301 | |||
| BHPLF / BHP Group Limited | 0,66 | -17,52 | 15,90 | -18,23 | 0,6754 | -0,1428 | |||
| VNOM / Viper Energy, Inc. | 0,42 | 0,00 | 15,87 | -15,55 | 0,6740 | -0,1166 | |||
| UEC / Uranium Energy Corp. | 2,28 | 23,95 | 15,53 | 76,35 | 0,6596 | 0,2890 | |||
| STERV / Stora Enso Oyj | 1,43 | 8,98 | 15,50 | 25,03 | 0,6585 | 0,1367 | |||
| KMI / Kinder Morgan, Inc. | 0,50 | 0,00 | 14,72 | 3,05 | 0,6251 | 0,0242 | |||
| WFRD / Weatherford International plc | 0,28 | 46,28 | 14,33 | 37,43 | 0,6086 | 0,1699 | |||
| AGI / Alamos Gold Inc. | 0,53 | -39,73 | 14,16 | -40,14 | 0,6013 | -0,3938 | |||
| SY1 / Symrise AG | 0,13 | -13,39 | 13,91 | -22,27 | 0,5907 | -0,1360 | |||
| RPM / RPM International Inc. | 0,13 | 0,00 | 13,88 | -5,04 | 0,5895 | -0,0255 | |||
| AKZA / Akzo Nobel N.V. | 0,20 | 11,03 | 13,83 | 26,49 | 0,5876 | 0,1274 | |||
| HCC / Warrior Met Coal, Inc. | 0,28 | 8,84 | 13,03 | 4,53 | 0,5536 | 0,0289 | |||
| NRG / NRG Energy, Inc. | 0,08 | 0,00 | 12,85 | 68,23 | 0,5456 | 0,2243 | |||
| TS / Tenaris S.A. - Depositary Receipt (Common Stock) | 0,34 | 0,00 | 12,77 | -4,37 | 0,5425 | -0,0195 | |||
| IP / Interpump Group S.p.A. | 0,30 | 29,29 | 12,55 | 50,64 | 0,5330 | 0,1825 | |||
| ARGTF / Artemis Gold Inc. | 0,67 | 27,87 | 12,25 | 95,63 | 0,5204 | 0,2569 | |||
| UPM / UPM-Kymmene Oyj | 0,45 | 88,42 | 12,17 | 91,80 | 0,5167 | 0,2498 | |||
| AMRIZE LTD / EC (CH1430134226) | 0,24 | 11,77 | 0,4998 | 0,4998 | |||||
| US76105Y1091 / T. Rowe Price Government Reserve Fund | 11,61 | 345,21 | 11,61 | 345,25 | 0,4932 | 0,3835 | |||
| TC268FIM0 / JETTI HOLDINGS SER D CVT PFD STOCK PP | 0,09 | 0,00 | 11,51 | 0,00 | 0,4887 | 0,0046 | |||
| KNF / Knife River Corporation | 0,13 | 80,84 | 10,94 | 63,66 | 0,4646 | 0,1834 | |||
| 6326 / Kubota Corporation | 0,97 | 0,00 | 10,93 | -8,74 | 0,4642 | -0,0397 | |||
| SCCO / Southern Copper Corporation | 0,11 | 0,99 | 10,77 | 9,32 | 0,4575 | 0,0429 | |||
| TECK / Teck Resources Limited | 0,27 | -37,57 | 10,71 | -30,80 | 0,4549 | -0,1963 | |||
| LPX / Louisiana-Pacific Corporation | 0,12 | -7,50 | 10,71 | -13,53 | 0,4547 | -0,0662 | |||
| SKE / Skeena Resources Limited | 0,64 | 13,60 | 10,23 | 79,19 | 0,4346 | 0,1943 | |||
| SPIE / SPIE SA | 0,18 | 17,59 | 10,15 | 54,55 | 0,4310 | 0,1547 | |||
| KGS / Kodiak Gas Services, Inc. | 0,29 | -11,32 | 9,80 | -18,52 | 0,4163 | -0,0899 | |||
| TYNPF / Nippon Sanso Holdings Corporation | 0,26 | 0,00 | 9,77 | 24,74 | 0,4148 | 0,0854 | |||
| VIST / Vista Energy, S.A.B. de C.V. - Depositary Receipt (Common Stock) | 0,20 | 9,53 | 0,4047 | 0,4047 | |||||
| IE / Ivanhoe Electric Inc. | 1,05 | 0,00 | 9,52 | 56,10 | 0,4043 | 0,1477 | |||
| MMPI / Champion Iron Limited | 3,42 | 0,00 | 9,42 | -9,87 | 0,4003 | -0,0397 | |||
| AEE / Ameren Corporation | 0,10 | 0,00 | 9,35 | -4,34 | 0,3970 | -0,0141 | |||
| XPRO / Expro Group Holdings N.V. | 1,08 | 30,00 | 9,27 | 12,35 | 0,3937 | 0,0465 | |||
| SYENS / Syensqo SA/NV | 0,12 | 0,00 | 9,23 | 13,52 | 0,3922 | 0,0499 | |||
| TC2S64YY5 / JETTI HOLDINGS SER C CVT PFD STOCK PP | 0,08 | 0,00 | 8,89 | 0,00 | 0,3778 | 0,0035 | |||
| AA / Alcoa Corporation | 0,30 | 139,32 | 8,73 | 131,61 | 0,3710 | 0,2123 | |||
| TKA / thyssenkrupp AG | 0,81 | 8,68 | 0,3686 | 0,3686 | |||||
| PPG / PPG Industries, Inc. | 0,07 | 0,00 | 8,14 | 4,02 | 0,3459 | 0,0165 | |||
| AAL / Anglo American plc | 0,26 | 7,80 | 0,3313 | 0,3313 | |||||
| 1812 / Kajima Corporation | 0,29 | 7,63 | 0,3240 | 0,3240 | |||||
| STLD / Steel Dynamics, Inc. | 0,06 | -59,83 | 7,42 | -58,89 | 0,3153 | -0,4446 | |||
| CEG / Constellation Energy Corporation | 0,02 | -53,64 | 7,20 | -25,79 | 0,3057 | -0,1024 | |||
| IVN / Ivanhoe Mines Ltd. | 0,95 | 44,83 | 7,17 | 28,14 | 0,3047 | 0,0691 | |||
| FORM ENERGY SER F CVT PFD PP / EP (000000000) | 0,25 | 6,09 | 0,2585 | 0,2585 | |||||
| TC6T8T2V3 / LILAC SOLUTIONS SERIES B CVT PFD STOCK P | 0,60 | 0,00 | 5,59 | 0,00 | 0,2374 | 0,0022 | |||
| ENERGY RESERVOIR HLDG LLC TAX BLOCKER PP / EC (000000000) | 10,11 | 5,46 | 0,2318 | 0,2318 | |||||
| SHMUF / Shimizu Corporation | 0,46 | 5,16 | 0,2193 | 0,2193 | |||||
| KOBOLD METALS SER B-PRIME CVT PFD STOCK / EP (000000000) | 0,05 | 4,49 | 0,1908 | 0,1908 | |||||
| TONIAN HOLDINGS VOTING CVT PFD UNITS / EP (000000000) | 2,53 | 3,28 | 0,1395 | 0,1395 | |||||
| FLOC / Flowco Holdings Inc. | 0,15 | 0,00 | 2,61 | -30,59 | 0,1107 | -0,0472 | |||
| TONIAN HOLDINGS NON-VOTING CVT PFD / EP (000000000) | 1,80 | 2,34 | 0,0992 | 0,0992 | |||||
| AAVVF / Advantage Energy Ltd. | 0,09 | 0,83 | 0,0350 | 0,0350 | |||||
| ENERGY RESERVOIR 2022 CL A-3 PREFEQ PP / EP (000000000) | 0,23 | 0,27 | 0,0113 | 0,0113 | |||||
| Farmers Business Network Inc PP / EC (TC7HUI213) | 0,45 | -26,60 | 0,00 | -100,00 | 0,0000 | -0,0905 | |||
| FARMERS BUSINESS NETWORK INC CVT SR D PP / EP (000000000) | 0,17 | 0,00 | 0,0000 | 0,0000 |