Statistiques de base
| Valeur du portefeuille | $ 644 400 |
| Positions actuelles | 64 |
Dernières positions, performances, ASG (à partir des dépôts 13F, 13D)
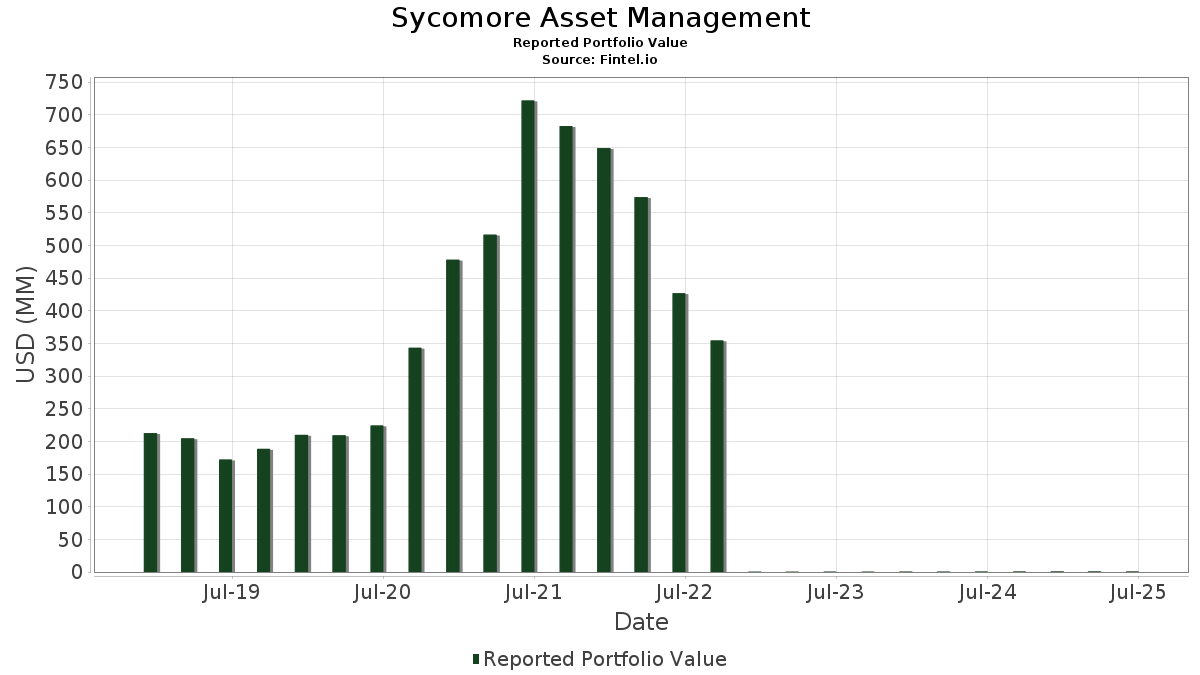
Sycomore Asset Management a déclaré un total de 64 positions dans ses derniers dépôts auprès de la SEC. La valeur la plus récente du portefeuille est calculée à 644 400 USD. Les actifs sous gestion réels (ASG) sont cette valeur plus les liquidités (qui ne sont pas divulguées). Les principales positions de Sycomore Asset Management sont Microsoft Corporation (US:MSFT) , NVIDIA Corporation (US:NVDA) , Waste Connections, Inc. (US:WCN) , Workday, Inc. (US:WDAY) , and ServiceNow, Inc. (US:NOW) .
Meilleures augmentations ce trimestre
Nous utilisons la variation de l'allocation du portefeuille car il s'agit de l'indicateur le plus significatif. Les changements peuvent être dus à des transactions ou à des variations de prix des actions.
| Titre | Actions (en millions) |
Valeur ($ en millions) |
% du portefeuille | ΔPortefeuille % |
|---|---|---|---|---|
| 0,19 | 0,08 | 12,7078 | 1,0851 | |
| 0,38 | 0,05 | 7,3220 | 0,6252 | |
| 0,12 | 0,03 | 4,3777 | 0,3738 | |
| 0,10 | 0,02 | 3,7398 | 0,3193 | |
| 0,03 | 0,02 | 3,5295 | 0,3014 | |
| 1,11 | 0,02 | 2,7489 | 0,2689 | |
| 0,04 | 0,02 | 3,0368 | 0,2593 | |
| 0,10 | 0,02 | 2,8793 | 0,2459 | |
| 0,02 | 0,02 | 2,8558 | 0,2439 | |
| 0,49 | 0,02 | 2,7933 | 0,2385 |
Principales baisses ce trimestre
Nous utilisons la variation de l'allocation du portefeuille car il s'agit de l'indicateur le plus significatif. Les changements peuvent être dus à des transactions ou à des variations de prix des actions.
| Titre | Actions (en millions) |
Valeur ($ en millions) |
% du portefeuille | ΔPortefeuille % |
|---|---|---|---|---|
| 0,00 | 0,00 | -2,8907 | ||
| 0,00 | 0,00 | -1,6152 | ||
| 0,00 | 0,00 | 0,0000 | -0,0417 | |
| 0,00 | 0,00 | 0,0000 | -0,0004 |
Déclarations 13F et dépôts de fonds
Ce formulaire a été déposé le 2025-08-01 pour la période de déclaration 2025-06-30. Cliquez sur l'icône du lien pour voir l'historique complet des transactions.
Mettre à niveau pour débloquer les données premium et exporter vers Excel ![]() .
.
| Titre | Type | Prix moyen de l'action | Actions (en millions) |
ΔActions (%) |
ΔActions (%) |
Valeur ($ en millions) |
Portefeuille (%) |
ΔPortefeuille (%) |
|
|---|---|---|---|---|---|---|---|---|---|
| MSFT / Microsoft Corporation | 0,19 | 0,00 | 0,08 | 0,00 | 12,7078 | 1,0851 | |||
| NVDA / NVIDIA Corporation | 0,38 | 0,00 | 0,05 | 0,00 | 7,3220 | 0,6252 | |||
| WCN / Waste Connections, Inc. | 0,12 | 0,00 | 0,03 | 0,00 | 4,3777 | 0,3738 | |||
| WDAY / Workday, Inc. | 0,10 | 0,00 | 0,02 | 0,00 | 3,7398 | 0,3193 | |||
| NOW / ServiceNow, Inc. | 0,03 | 0,00 | 0,02 | 0,00 | 3,5295 | 0,3014 | |||
| MA / Mastercard Incorporated | 0,04 | 0,00 | 0,02 | 0,00 | 3,0368 | 0,2593 | |||
| AVGO / Broadcom Inc. | 0,10 | 0,00 | 0,02 | 0,00 | 2,8793 | 0,2459 | |||
| LLY / Eli Lilly and Company | 0,02 | 0,00 | 0,02 | 0,00 | 2,8558 | 0,2439 | |||
| SW / Smurfit Westrock Plc | 0,49 | 0,00 | 0,02 | 0,00 | 2,7933 | 0,2385 | |||
| STLA / Stellantis N.V. | 1,11 | 0,00 | 0,02 | 0,00 | 2,7489 | 0,2689 | |||
| SYK / Stryker Corporation | 0,05 | 0,00 | 0,02 | 0,00 | 2,6679 | 0,2278 | |||
| MU / Micron Technology, Inc. | 0,16 | 0,00 | 0,02 | 0,00 | 2,6555 | 0,2268 | |||
| TMUS / T-Mobile US, Inc. | 0,08 | 0,00 | 0,02 | 0,00 | 2,4795 | 0,2117 | |||
| ETN / Eaton Corporation plc | 0,04 | 0,00 | 0,01 | 0,00 | 2,2959 | 0,1961 | |||
| TMO / Thermo Fisher Scientific Inc. | 0,02 | 0,00 | 0,01 | 0,00 | 2,2412 | 0,1914 | |||
| ALC N / Alcon Inc. | 0,13 | 0,00 | 0,01 | 0,00 | 2,1241 | 0,2196 | |||
| PGR / The Progressive Corporation | 0,05 | 0,00 | 0,01 | 0,00 | 2,0276 | 0,1731 | |||
| CYBR / CyberArk Software Ltd. | 0,04 | 0,00 | 0,01 | 0,00 | 1,9761 | 0,1687 | |||
| RACE / Ferrari N.V. | 0,02 | 0,00 | 0,01 | 0,00 | 1,7935 | 0,1754 | |||
| MDB / MongoDB, Inc. | 0,04 | 0,00 | 0,01 | 0,00 | 1,7677 | 0,1509 | |||
| URI / United Rentals, Inc. | 0,01 | 0,00 | 0,01 | 0,00 | 1,7512 | 0,1495 | |||
| SNPS / Synopsys, Inc. | 0,02 | 0,00 | 0,01 | 0,00 | 1,6839 | 0,1438 | |||
| PCOR / Procore Technologies, Inc. | 0,16 | 0,00 | 0,01 | 0,00 | 1,4860 | 0,1269 | |||
| PSTG / Pure Storage, Inc. | 0,19 | 0,00 | 0,01 | 0,00 | 1,4708 | 0,1256 | |||
| ISRG / Intuitive Surgical, Inc. | 0,02 | 0,00 | 0,01 | 0,00 | 1,4299 | 0,1221 | |||
| VEEV / Veeva Systems Inc. | 0,04 | 0,00 | 0,01 | 0,00 | 1,3088 | 0,1118 | |||
| DUOL / Duolingo, Inc. | 0,03 | 0,00 | 0,01 | 0,00 | 1,2157 | 0,1038 | |||
| GOOGL / Alphabet Inc. | 0,05 | 0,00 | 0,01 | 0,00 | 1,2072 | 0,1031 | |||
| VRT / Vertiv Holdings Co | 0,08 | 0,00 | 0,01 | 0,00 | 1,1969 | 0,1022 | |||
| CLH / Clean Harbors, Inc. | 0,03 | 0,00 | 0,01 | 0,00 | 1,1868 | 0,1013 | |||
| TSM / Taiwan Semiconductor Manufacturing Company Limited - Depositary Receipt (Common Stock) | 0,04 | 0,00 | 0,01 | 0,00 | 1,1749 | 0,1003 | |||
| SNOW / Snowflake Inc. | 0,06 | 0,00 | 0,01 | 0,00 | 1,1110 | 0,0949 | |||
| GTLB / GitLab Inc. | 0,13 | 0,00 | 0,01 | 0,00 | 1,0664 | 0,0911 | |||
| DE / Deere & Company | 0,02 | 0,00 | 0,01 | 0,00 | 1,0112 | 0,0863 | |||
| VRSK / Verisk Analytics, Inc. | 0,02 | 0,00 | 0,01 | 0,00 | 0,9904 | 0,0846 | |||
| JPM / JPMorgan Chase & Co. | 0,03 | 0,00 | 0,01 | 0,00 | 0,9494 | 0,0811 | |||
| WAB / Westinghouse Air Brake Technologies Corporation | 0,03 | 0,00 | 0,01 | 0,00 | 0,9493 | 0,0811 | |||
| PANW / Palo Alto Networks, Inc. | 0,02 | 0,00 | 0,01 | 0,00 | 0,9128 | 0,0779 | |||
| PWR / Quanta Services, Inc. | 0,02 | 0,00 | 0,01 | 0,00 | 0,8948 | 0,0764 | |||
| S / SentinelOne, Inc. | 0,21 | 0,00 | 0,00 | 0,00 | 0,7722 | 0,0659 | |||
| AAPL / Apple Inc. | 0,02 | 0,00 | 0,00 | 0,00 | 0,7584 | 0,0648 | |||
| DAR / Darling Ingredients Inc. | 0,13 | 0,00 | 0,00 | 0,00 | 0,7360 | 0,0629 | |||
| OC / Owens Corning | 0,02 | 0,00 | 0,00 | 0,00 | 0,5656 | 0,0483 | |||
| NEE / NextEra Energy, Inc. | 0,04 | 0,00 | 0,00 | 0,00 | 0,5556 | 0,0474 | |||
| CFLT / Confluent, Inc. | 0,18 | 0,00 | 0,00 | 0,00 | 0,5417 | 0,0463 | |||
| AWK / American Water Works Company, Inc. | 0,02 | 0,00 | 0,00 | 0,00 | 0,5233 | 0,0447 | |||
| QGEN / Qiagen N.V. | 0,06 | 0,00 | 0,00 | 0,00 | 0,5101 | 0,0498 | |||
| ON / ON Semiconductor Corporation | 0,04 | 0,00 | 0,00 | 0,00 | 0,5057 | 0,0432 | |||
| COHR / Coherent Corp. | 0,03 | 0,00 | 0,00 | 0,00 | 0,4930 | 0,0421 | |||
| CRWD / CrowdStrike Holdings, Inc. | 0,01 | 0,00 | 0,00 | 0,00 | 0,4741 | 0,0405 | |||
| RSG / Republic Services, Inc. | 0,01 | 0,00 | 0,00 | 0,00 | 0,4325 | 0,0369 | |||
| MTZ / MasTec, Inc. | 0,02 | 0,00 | 0,00 | 0,00 | 0,4274 | 0,0365 | |||
| ANET / Arista Networks Inc | 0,01 | 0,00 | 0,00 | 0,00 | 0,4219 | 0,0360 | |||
| AYI / Acuity Inc. | 0,01 | 0,00 | 0,00 | 0,00 | 0,3211 | 0,0274 | |||
| FSLR / First Solar, Inc. | 0,01 | 0,00 | 0,00 | 0,00 | 0,2199 | 0,0188 | |||
| CSL / Carlisle Companies Incorporated | 0,00 | 0,00 | 0,00 | 0,00 | 0,2022 | 0,0173 | |||
| ALAB / Astera Labs, Inc. | 0,02 | 0,00 | 0,00 | 0,1463 | 0,0125 | ||||
| DDOG / Datadog, Inc. | 0,01 | 0,00 | 0,00 | 0,1187 | 0,0101 | ||||
| WFG / West Fraser Timber Co. Ltd. | 0,01 | 0,00 | 0,00 | 0,0962 | 0,0089 | ||||
| DLR / Digital Realty Trust, Inc. | 0,50 | 0,00 | 0,00 | 0,0725 | 0,0072 | ||||
| TAN / Invesco Exchange-Traded Fund Trust II - Invesco Solar ETF | 0,01 | 0,00 | 0,00 | 0,0424 | 0,0036 | ||||
| CQQQ / Invesco Exchange-Traded Fund Trust II - Invesco China Technology ETF | 0,01 | 0,00 | 0,00 | 0,0362 | 0,0031 | ||||
| AMZN / Amazon.com, Inc. | 0,00 | 0,00 | 0,00 | 0,0088 | 0,0008 | ||||
| NXT / Nextracker Inc. | 0,00 | 0,00 | 0,00 | 0,0009 | 0,0001 | ||||
| XYL / Xylem Inc. | 0,00 | -100,00 | 0,00 | 0,0000 | |||||
| INTU / Intuit Inc. | 0,00 | -100,00 | 0,00 | 0,0000 | |||||
| ACN / Accenture plc | 0,00 | -100,00 | 0,00 | -100,00 | -2,8907 | ||||
| AMAT / Applied Materials, Inc. | 0,00 | -100,00 | 0,00 | 0,0000 | |||||
| BIDU / Baidu, Inc. - Depositary Receipt (Common Stock) | 0,00 | -100,00 | 0,00 | 0,0000 | |||||
| BABA / Alibaba Group Holding Limited - Depositary Receipt (Common Stock) | 0,00 | -100,00 | 0,00 | 0,0000 | -0,0417 | ||||
| ADI / Analog Devices, Inc. | 0,00 | -100,00 | 0,00 | 0,0000 | |||||
| AMD / Advanced Micro Devices, Inc. | 0,00 | -100,00 | 0,00 | -100,00 | -1,6152 | ||||
| RUN / Sunrun Inc. | 0,00 | -100,00 | 0,00 | 0,0000 | -0,0004 |