Statistiques de base
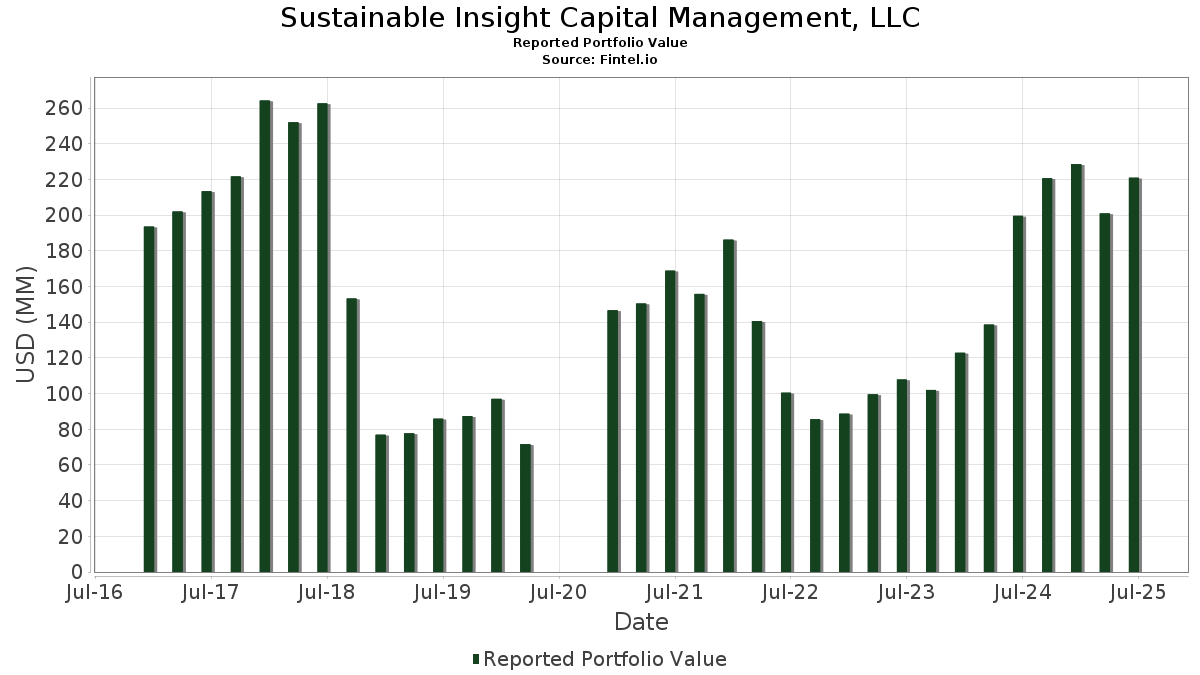
| Valeur du portefeuille | $ 220 912 353 |
| Positions actuelles | 61 |
Dernières positions, performances, ASG (à partir des dépôts 13F, 13D)
Sustainable Insight Capital Management, LLC a déclaré un total de 61 positions dans ses derniers dépôts auprès de la SEC. La valeur la plus récente du portefeuille est calculée à 220 912 353 USD. Les actifs sous gestion réels (ASG) sont cette valeur plus les liquidités (qui ne sont pas divulguées). Les principales positions de Sustainable Insight Capital Management, LLC sont Apple Inc. (US:AAPL) , NVIDIA Corporation (US:NVDA) , Microsoft Corporation (US:MSFT) , Amazon.com, Inc. (US:AMZN) , and Broadcom Inc. (US:AVGO) . Les nouvelles positions de Sustainable Insight Capital Management, LLC incluent Ferrari N.V. (US:RACE) , Willis Towers Watson Public Limited Company (US:WTW) , Vistra Corp. (US:VST) , .
Meilleures augmentations ce trimestre
Nous utilisons la variation de l'allocation du portefeuille car il s'agit de l'indicateur le plus significatif. Les changements peuvent être dus à des transactions ou à des variations de prix des actions.
| Titre | Actions (en millions) |
Valeur ($ en millions) |
% du portefeuille | ΔPortefeuille % |
|---|---|---|---|---|
| 0,06 | 12,38 | 5,6054 | 5,6054 | |
| 0,10 | 15,99 | 7,2383 | 3,4424 | |
| 0,03 | 15,93 | 7,2110 | 3,0003 | |
| 0,01 | 4,07 | 1,8436 | 1,8436 | |
| 0,01 | 4,95 | 2,2425 | 1,7657 | |
| 0,07 | 15,01 | 6,7951 | 1,3058 | |
| 0,02 | 3,47 | 1,5717 | 1,3008 | |
| 0,01 | 2,17 | 0,9807 | 0,9807 | |
| 0,02 | 2,15 | 0,9748 | 0,9748 | |
| 0,01 | 2,15 | 0,9728 | 0,9728 |
Principales baisses ce trimestre
Nous utilisons la variation de l'allocation du portefeuille car il s'agit de l'indicateur le plus significatif. Les changements peuvent être dus à des transactions ou à des variations de prix des actions.
| Titre | Actions (en millions) |
Valeur ($ en millions) |
% du portefeuille | ΔPortefeuille % |
|---|---|---|---|---|
| 0,03 | 4,03 | 1,8244 | -1,8655 | |
| 0,02 | 3,91 | 1,7703 | -1,7518 | |
| 0,03 | 6,87 | 3,1097 | -1,5768 | |
| 0,01 | 2,38 | 1,0794 | -1,5277 | |
| 0,24 | 7,02 | 3,1759 | -1,5141 | |
| 0,03 | 2,21 | 1,0019 | -1,4388 | |
| 0,00 | 1,15 | 0,5215 | -1,3367 | |
| 0,00 | 1,84 | 0,8328 | -0,7826 | |
| 0,01 | 1,10 | 0,4998 | -0,7624 | |
| 0,01 | 1,86 | 0,8429 | -0,7207 |
Déclarations 13F et dépôts de fonds
Ce formulaire a été déposé le 2025-08-06 pour la période de déclaration 2025-06-30. Cliquez sur l'icône du lien pour voir l'historique complet des transactions.
Mettre à niveau pour débloquer les données premium et exporter vers Excel ![]() .
.
| Titre | Type | Prix moyen de l'action | Actions (en millions) |
ΔActions (%) |
ΔActions (%) |
Valeur ($ en millions) |
Portefeuille (%) |
ΔPortefeuille (%) |
|
|---|---|---|---|---|---|---|---|---|---|
| AAPL / Apple Inc. | 0,08 | 20,99 | 17,17 | 11,75 | 7,7734 | 0,1247 | |||
| NVDA / NVIDIA Corporation | 0,10 | 43,84 | 15,99 | 109,68 | 7,2383 | 3,4424 | |||
| MSFT / Microsoft Corporation | 0,03 | 42,12 | 15,93 | 88,32 | 7,2110 | 3,0003 | |||
| AMZN / Amazon.com, Inc. | 0,07 | 18,04 | 15,01 | 36,12 | 6,7951 | 1,3058 | |||
| AVGO / Broadcom Inc. | 0,05 | -31,58 | 14,78 | 12,64 | 6,6886 | 0,1592 | |||
| PANW / Palo Alto Networks, Inc. | 0,07 | -5,03 | 14,35 | 13,89 | 6,4936 | 0,2240 | |||
| DRI / Darden Restaurants, Inc. | 0,06 | 12,38 | 5,6054 | 5,6054 | |||||
| LLY / Eli Lilly and Company | 0,01 | 37,55 | 10,04 | 29,82 | 4,5464 | 0,6956 | |||
| T / AT&T Inc. | 0,24 | -27,24 | 7,02 | -25,55 | 3,1759 | -1,5141 | |||
| TMUS / T-Mobile US, Inc. | 0,03 | -18,32 | 6,87 | -27,04 | 3,1097 | -1,5768 | |||
| META / Meta Platforms, Inc. | 0,01 | 303,85 | 4,95 | 417,66 | 2,2425 | 1,7657 | |||
| ALL / The Allstate Corporation | 0,02 | -5,58 | 4,33 | -8,20 | 1,9616 | -0,3882 | |||
| MMC / Marsh & McLennan Companies, Inc. | 0,02 | -0,39 | 4,25 | -10,75 | 1,9241 | -0,4467 | |||
| MSCI / MSCI Inc. | 0,01 | -12,70 | 4,21 | -10,97 | 1,9071 | -0,4483 | |||
| COST / Costco Wholesale Corporation | 0,00 | 52,83 | 4,18 | 59,96 | 1,8901 | 0,5908 | |||
| RACE / Ferrari N.V. | 0,01 | 4,07 | 1,8436 | 1,8436 | |||||
| TDG / TransDigm Group Incorporated | 0,00 | 23,67 | 4,07 | 35,93 | 1,8413 | 0,3520 | |||
| CPRT / Copart, Inc. | 0,08 | 45,34 | 4,06 | 26,02 | 1,8398 | 0,2346 | |||
| ABT / Abbott Laboratories | 0,03 | -46,98 | 4,03 | -45,64 | 1,8244 | -1,8655 | |||
| HUM / Humana Inc. | 0,02 | -40,18 | 3,91 | -44,73 | 1,7703 | -1,7518 | |||
| TD / The Toronto-Dominion Bank | 0,05 | 32,82 | 3,81 | 63,12 | 1,7260 | 0,5626 | |||
| GOOGL / Alphabet Inc. | 0,02 | 459,72 | 3,47 | 538,24 | 1,5717 | 1,3008 | |||
| GOOGL / Alphabet Inc. | 0,01 | 1 508,70 | 2,63 | 2,42 | 1,1884 | -0,6348 | |||
| JPM / JPMorgan Chase & Co. | 0,01 | -61,48 | 2,38 | -54,48 | 1,0794 | -1,5277 | |||
| WFC / Wells Fargo & Company | 0,03 | -59,55 | 2,21 | -54,86 | 1,0019 | -1,4388 | |||
| ICE / Intercontinental Exchange, Inc. | 0,01 | 2,17 | 0,9807 | 0,9807 | |||||
| HIG / The Hartford Insurance Group, Inc. | 0,02 | 2,15 | 0,9748 | 0,9748 | |||||
| COF / Capital One Financial Corporation | 0,01 | 2,15 | 0,9728 | 0,9728 | |||||
| ACGL / Arch Capital Group Ltd. | 0,02 | 2,14 | 0,9669 | 0,9669 | |||||
| WTW / Willis Towers Watson Public Limited Company | 0,01 | 2,11 | 0,9561 | 0,9561 | |||||
| NFLX / Netflix, Inc. | 0,00 | 468,15 | 2,05 | 718,33 | 0,9299 | 0,8046 | |||
| JCI / Johnson Controls International plc | 0,02 | 1,90 | 0,8581 | 0,8581 | |||||
| DOV / Dover Corporation | 0,01 | -43,16 | 1,86 | -40,72 | 0,8429 | -0,7207 | |||
| PH / Parker-Hannifin Corporation | 0,00 | -50,66 | 1,84 | -43,33 | 0,8328 | -0,7826 | |||
| ORCL / Oracle Corporation | 0,01 | 1,68 | 0,7596 | 0,7596 | |||||
| CNQ / Canadian Natural Resources Limited | 0,04 | 79,40 | 1,31 | 83,26 | 0,5952 | 0,2382 | |||
| FNV / Franco-Nevada Corporation | 0,01 | 57,40 | 1,17 | 64,47 | 0,5303 | 0,1756 | |||
| SHW / The Sherwin-Williams Company | 0,00 | -68,62 | 1,15 | -69,17 | 0,5215 | -1,3367 | |||
| CP / Canadian Pacific Kansas City Limited | 0,01 | 37,07 | 1,14 | 54,88 | 0,5177 | 0,1501 | |||
| WMT / Walmart Inc. | 0,01 | -60,91 | 1,10 | -56,45 | 0,4998 | -0,7624 | |||
| NOW / ServiceNow, Inc. | 0,00 | 55,30 | 1,05 | 100,57 | 0,4770 | 0,2155 | |||
| FSV / FirstService Corporation | 0,00 | 68,78 | 0,77 | 77,42 | 0,3489 | 0,1328 | |||
| CRWD / CrowdStrike Holdings, Inc. | 0,00 | 55,88 | 0,64 | 125,18 | 0,2875 | 0,1471 | |||
| MOS / The Mosaic Company | 0,02 | 0,60 | 0,2725 | 0,2725 | |||||
| ANET / Arista Networks Inc | 0,01 | 54,87 | 0,55 | 104,44 | 0,2502 | 0,1157 | |||
| KR / The Kroger Co. | 0,01 | -59,59 | 0,55 | -57,18 | 0,2501 | -0,3920 | |||
| CHD / Church & Dwight Co., Inc. | 0,01 | -51,46 | 0,52 | -57,68 | 0,2362 | -0,3767 | |||
| DG / Dollar General Corporation | 0,00 | 0,51 | 0,2296 | 0,2296 | |||||
| EQIX / Equinix, Inc. | 0,00 | 11,88 | 0,50 | 9,15 | 0,2272 | -0,0017 | |||
| SPG / Simon Property Group, Inc. | 0,00 | -3,05 | 0,46 | -6,13 | 0,2081 | -0,0357 | |||
| APH / Amphenol Corporation | 0,00 | 0,44 | 0,1992 | 0,1992 | |||||
| TSLA / Tesla, Inc. | 0,00 | -54,06 | 0,33 | -43,68 | 0,1513 | -0,1441 | |||
| BRK.A / Berkshire Hathaway Inc. | 0,00 | -54,42 | 0,32 | -58,44 | 0,1427 | -0,2348 | |||
| TRGP / Targa Resources Corp. | 0,00 | 0,24 | 0,1103 | 0,1103 | |||||
| PLD / Prologis, Inc. | 0,00 | -49,81 | 0,24 | -52,84 | 0,1093 | -0,1454 | |||
| CCI / Crown Castle Inc. | 0,00 | 0,23 | 0,1061 | 0,1061 | |||||
| SBAC / SBA Communications Corporation | 0,00 | -55,24 | 0,23 | -52,32 | 0,1026 | -0,1335 | |||
| BXP / Boston Properties, Inc. | 0,00 | -51,28 | 0,22 | -51,11 | 0,1002 | -0,1251 | |||
| V / Visa Inc. | 0,00 | -54,42 | 0,22 | -53,89 | 0,0995 | -0,1374 | |||
| VST / Vistra Corp. | 0,00 | 0,21 | 0,0965 | 0,0965 | |||||
| TPIC / TPI Composites, Inc. | 0,02 | 0,01 | 0,0063 | 0,0063 | |||||
| NI / NiSource Inc. | 0,00 | -100,00 | 0,00 | 0,0000 | |||||
| CNI / Canadian National Railway Company | 0,00 | -100,00 | 0,00 | 0,0000 | |||||
| HES / Hess Corporation | 0,00 | -100,00 | 0,00 | 0,0000 | |||||
| ATO / Atmos Energy Corporation | 0,00 | -100,00 | 0,00 | 0,0000 | |||||
| PSX / Phillips 66 | 0,00 | -100,00 | 0,00 | 0,0000 | |||||
| MSI / Motorola Solutions, Inc. | 0,00 | -100,00 | 0,00 | 0,0000 | |||||
| MAA / Mid-America Apartment Communities, Inc. | 0,00 | -100,00 | 0,00 | 0,0000 | |||||
| ABBV / AbbVie Inc. | 0,00 | -100,00 | 0,00 | 0,0000 | |||||
| JNJ / Johnson & Johnson | 0,00 | -100,00 | 0,00 | 0,0000 | |||||
| UNH / UnitedHealth Group Incorporated | 0,00 | -100,00 | 0,00 | 0,0000 | |||||
| UBS / UBS Group AG | 0,00 | -100,00 | 0,00 | 0,0000 | |||||
| PLTR / Palantir Technologies Inc. | 0,00 | -100,00 | 0,00 | -100,00 | -0,2909 | ||||
| CRM / Salesforce, Inc. | 0,00 | -100,00 | 0,00 | 0,0000 | |||||
| CM / Canadian Imperial Bank of Commerce | 0,00 | -100,00 | 0,00 | 0,0000 | |||||
| HD / The Home Depot, Inc. | 0,00 | -100,00 | 0,00 | 0,0000 | |||||
| FTNT / Fortinet, Inc. | 0,00 | -100,00 | 0,00 | 0,0000 | |||||
| MA / Mastercard Incorporated | 0,00 | -100,00 | 0,00 | 0,0000 | |||||
| MNST / Monster Beverage Corporation | 0,00 | -100,00 | 0,00 | 0,0000 | |||||
| MET / MetLife, Inc. | 0,00 | -100,00 | 0,00 | 0,0000 | |||||
| PG / The Procter & Gamble Company | 0,00 | -100,00 | 0,00 | 0,0000 | |||||
| CMG / Chipotle Mexican Grill, Inc. | 0,00 | -100,00 | 0,00 | 0,0000 | |||||
| WELL / Welltower Inc. | 0,00 | -100,00 | 0,00 | 0,0000 |